This comprehensive analysis compares TNSR and RUNE, two distinct blockchain tokens with different market positioning and investment profiles. TNSR, launched in April 2024, operates as Solana's leading NFT marketplace, while RUNE, established in July 2019, functions as a multi-chain liquidity protocol utilizing pBFT consensus. The article examines historical price trends, current market status, tokenomics, institutional adoption, and technical ecosystems to help investors understand their relative strengths. With current prices at $0.06171 (TNSR) and $0.5899 (RUNE) amid extreme market fear, the guide provides allocation strategies for conservative and aggressive investors, price forecasts through 2031, and detailed risk assessments. Both tokens are available for trading on Gate, enabling investors to make informed decisions based on their risk tolerance and portfolio objectives.
Introduction: Investment Comparison Between TNSR and RUNE
In the cryptocurrency market, the comparison between TNSR vs RUNE has been a topic of ongoing interest among investors. The two assets exhibit notable differences in market capitalization ranking, application scenarios, and price performance, representing distinct positioning within the crypto asset landscape.
TNSR (Tensor): Launched in April 2024, this token has gained recognition through its positioning as Solana's leading NFT marketplace for both traders and creators.
RUNE (THORChain): Since its inception in July 2019, RUNE has been recognized as a multi-chain liquidity protocol utilizing pBFT consensus, serving as one of the notable cross-chain decentralized exchange solutions in the crypto ecosystem.
This article will provide a comprehensive analysis of TNSR vs RUNE investment value comparison, examining historical price trends, supply mechanisms, institutional adoption, technical ecosystems, and future projections, while addressing the question that investors care about most:
"Which is the better buy right now?"
I. Historical Price Comparison and Current Market Status
Historical Price Trends of TNSR (Coin A) and RUNE (Coin B)
- 2024: TNSR reached a price peak of $3.89 on April 8, 2024, shortly after its initial listing on April 8, 2024.
- 2025: TNSR experienced a price decline, reaching its lowest point of $0.02852 on October 10, 2025.
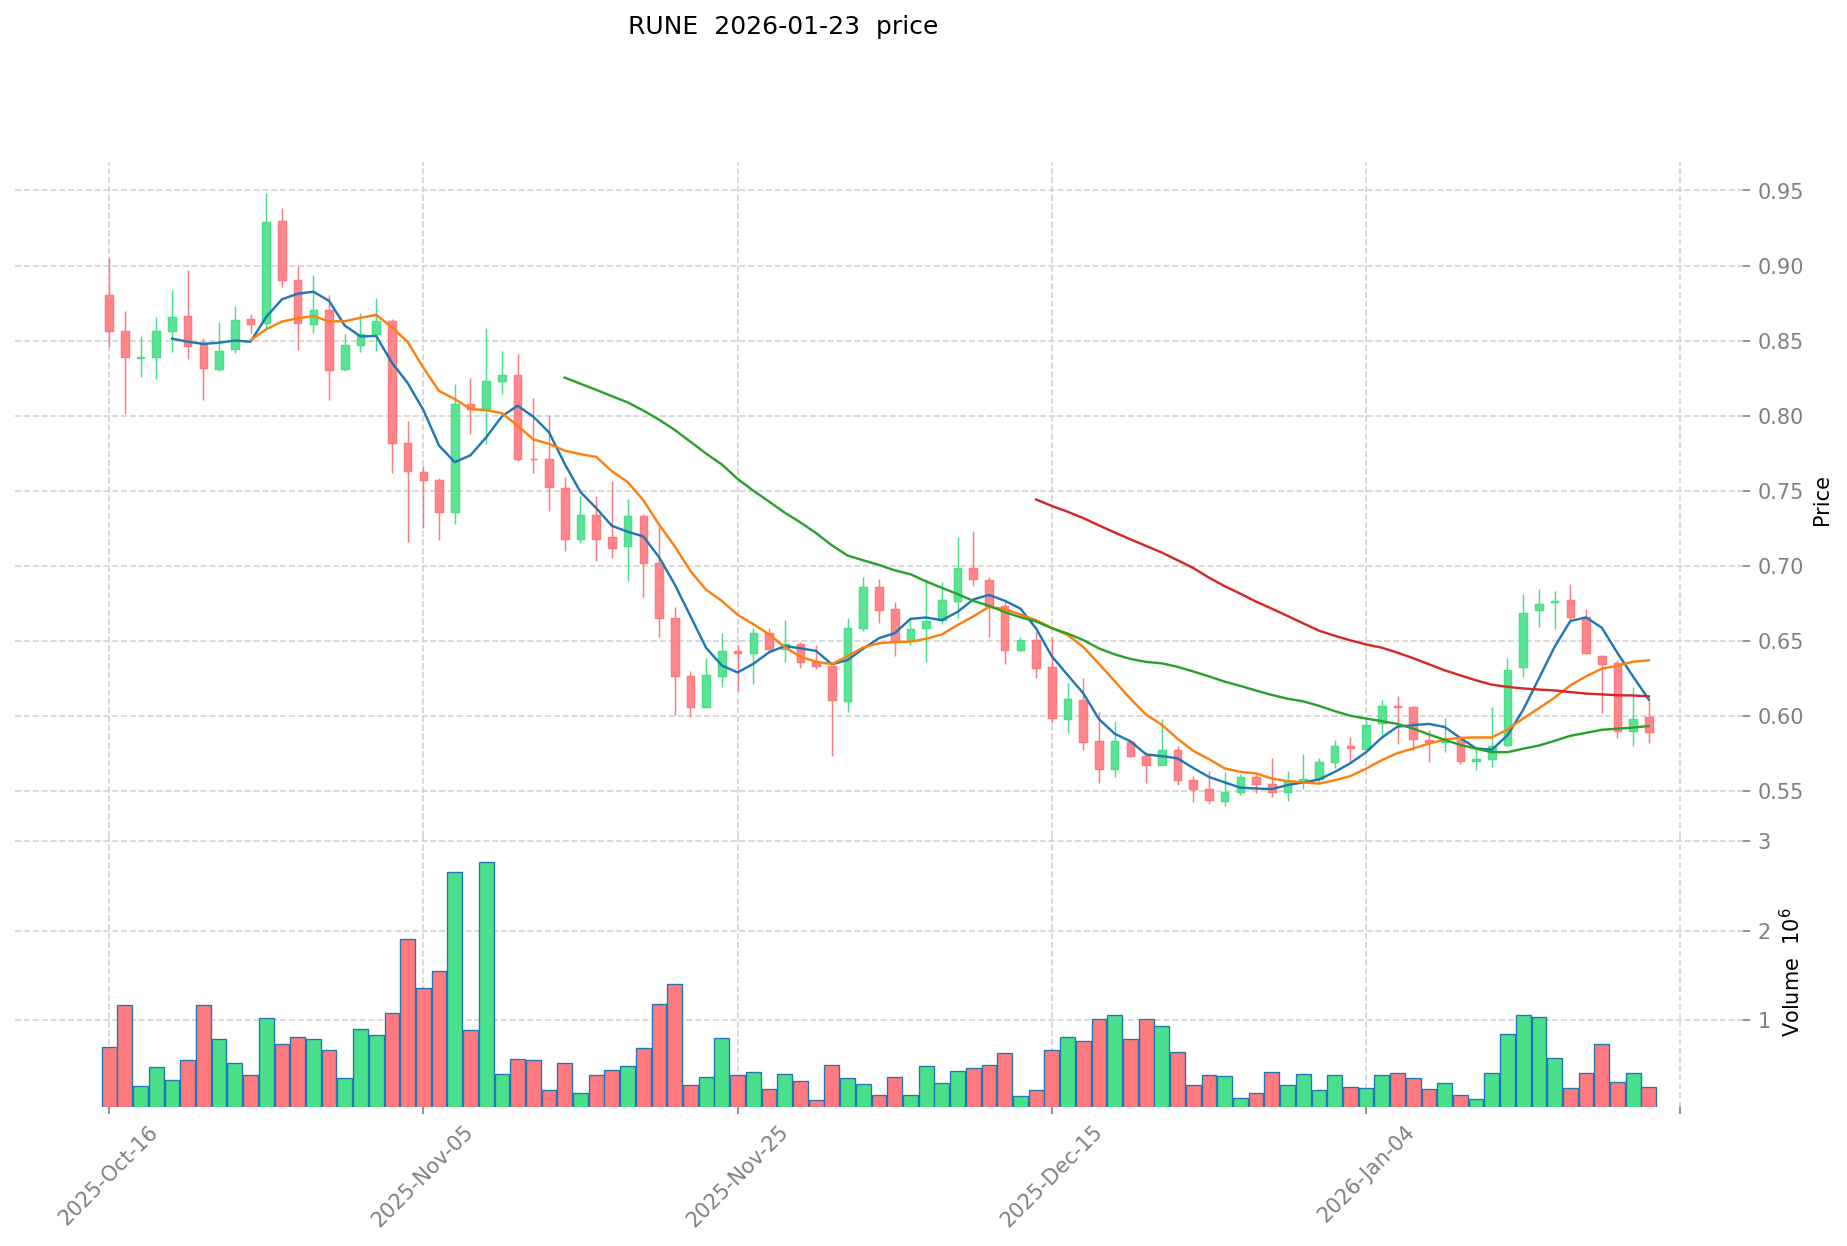
- 2021: RUNE achieved its highest price of $20.87 on May 19, 2021, during a period of heightened market activity.
- 2019: RUNE recorded its lowest price of $0.00851264 on September 28, 2019, in its early trading phase.
- Comparative Analysis: During the recent market cycle, TNSR declined from its high of $3.89 to a low of $0.02852, representing an approximate 99.3% decrease, while RUNE experienced a decline from $20.87 to $0.00851264 over a longer period, demonstrating different volatility patterns across varying market conditions.
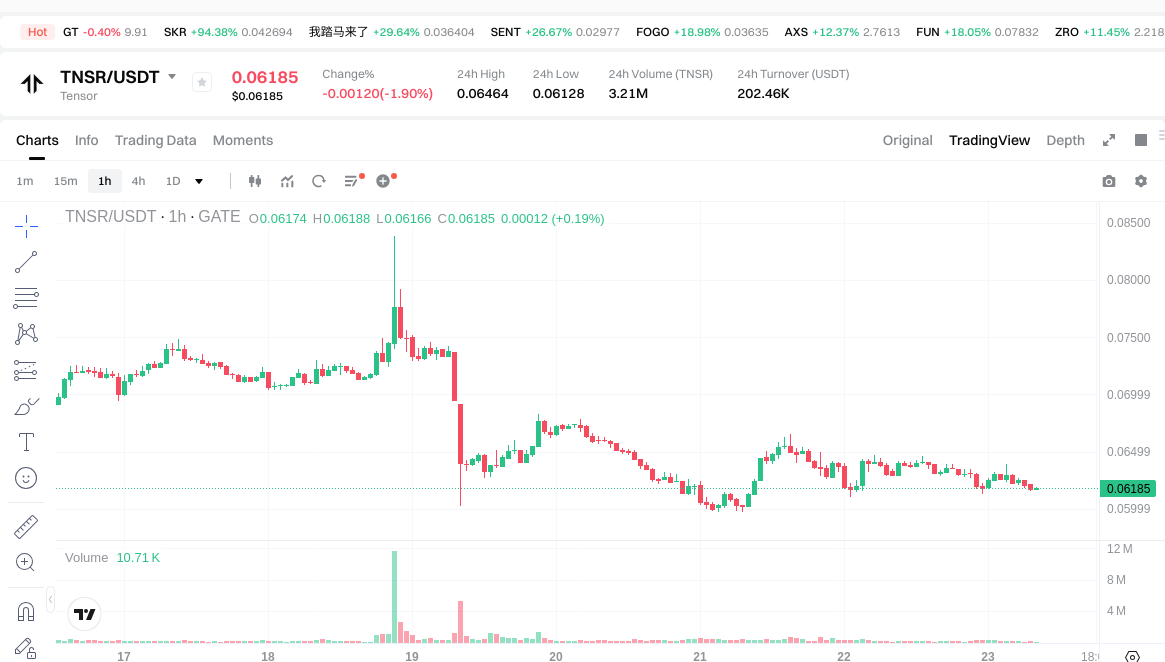
Current Market Status (2026-01-23)
- TNSR Current Price: $0.06171
- RUNE Current Price: $0.5899
- 24-Hour Trading Volume: TNSR $203,629.23 vs RUNE $153,064.09
- Market Sentiment Index (Fear & Greed Index): 20 (Extreme Fear)
View Real-Time Prices:
II. Core Factors Influencing TNSR vs RUNE Investment Value
Supply Mechanism Comparison (Tokenomics)
Due to limited available information in the reference materials regarding the specific supply mechanisms of TNSR and RUNE, a detailed comparison cannot be provided at this time. Tokenomics analysis typically requires comprehensive data on total supply, circulating supply, emission schedules, and any deflationary or inflationary mechanisms built into the protocol design.
Institutional Adoption and Market Application
The reference materials do not contain sufficient information regarding institutional holdings, enterprise adoption patterns, or regulatory positions for either TNSR or RUNE across different jurisdictions. A comparative analysis of institutional preference, cross-border payment applications, settlement use cases, or portfolio allocation strategies cannot be established based on the available data.
Technical Development and Ecosystem Building
Without specific technical roadmap details, upgrade schedules, or ecosystem development metrics in the provided materials, a comparative assessment of technological advancement for TNSR and RUNE remains unavailable. Evaluation of DeFi integration, NFT marketplace presence, payment infrastructure, and smart contract deployment across both ecosystems requires more comprehensive data sources.
Macroeconomic Environment and Market Cycles
The reference materials do not provide performance data under various macroeconomic conditions for either TNSR or RUNE. Analysis of inflation-hedging characteristics, correlation with monetary policy changes, interest rate sensitivity, U.S. dollar index relationships, or geopolitical impact factors cannot be conducted without historical performance metrics and market correlation studies.
III. 2026-2031 Price Forecast: TNSR vs RUNE
Short-term Forecast (2026)
- TNSR: Conservative $0.051-$0.062 | Optimistic $0.062-$0.069
- RUNE: Conservative $0.39-$0.59 | Optimistic $0.59-$0.74
Mid-term Forecast (2028-2029)
- TNSR may enter a gradual growth phase, with estimated price range of $0.048-$0.108
- RUNE may enter a moderate expansion phase, with estimated price range of $0.35-$0.87
- Key drivers: institutional capital flows, ETF developments, ecosystem growth
Long-term Forecast (2030-2031)
- TNSR: Baseline scenario $0.052-$0.094 | Optimistic scenario $0.079-$0.145
- RUNE: Baseline scenario $0.79-$0.83 | Optimistic scenario $0.80-$1.23
View detailed price predictions for TNSR and RUNE
Disclaimer
TNSR:
| Year |
Predicted High Price |
Predicted Average Price |
Predicted Low Price |
Price Change |
| 2026 |
0.0686868 |
0.06188 |
0.0507416 |
0 |
| 2027 |
0.082909918 |
0.0652834 |
0.047004048 |
5 |
| 2028 |
0.08521115785 |
0.074096659 |
0.04816282835 |
20 |
| 2029 |
0.10753277637375 |
0.079653908425 |
0.05336811864475 |
29 |
| 2030 |
0.101080809791325 |
0.093593342399375 |
0.05241227174365 |
51 |
| 2031 |
0.145032243382071 |
0.09733707609535 |
0.078843031637233 |
57 |
RUNE:
| Year |
Predicted High Price |
Predicted Average Price |
Predicted Low Price |
Price Change |
| 2026 |
0.736125 |
0.5889 |
0.394563 |
0 |
| 2027 |
0.775139625 |
0.6625125 |
0.351131625 |
12 |
| 2028 |
0.841026493125 |
0.7188260625 |
0.567872589375 |
21 |
| 2029 |
0.87351743115 |
0.7799262778125 |
0.45235724113125 |
32 |
| 2030 |
1.190479470453 |
0.82672185448125 |
0.785385761757187 |
40 |
| 2031 |
1.230492808209892 |
1.008600662467125 |
0.796794523349028 |
70 |
IV. Investment Strategy Comparison: TNSR vs RUNE
Long-term vs Short-term Investment Strategies
- TNSR: May be suitable for investors interested in NFT marketplace developments and emerging Solana ecosystem opportunities, with consideration given to its relatively recent market entry in April 2024.
- RUNE: May be suitable for investors evaluating cross-chain liquidity protocols and decentralized exchange infrastructure, with attention to its longer operational history since July 2019.
Risk Management and Asset Allocation
- Conservative Investors: TNSR 20-30% vs RUNE 70-80%, prioritizing assets with longer operational track records
- Aggressive Investors: TNSR 40-50% vs RUNE 50-60%, balancing between emerging and established protocols
- Hedging Tools: stablecoin allocation, options strategies, cross-asset portfolio diversification
V. Potential Risk Comparison
Market Risk
- TNSR: Price volatility patterns following April 2024 launch, with observed decline from $3.89 to $0.02852, representing exposure to broader market sentiment and NFT sector performance
- RUNE: Historical price fluctuations from $20.87 peak in May 2021 to lower levels, reflecting sensitivity to cross-chain DeFi adoption trends and liquidity protocol competition
Technical Risk
- TNSR: Considerations related to NFT marketplace scalability and network performance on Solana infrastructure
- RUNE: Factors associated with cross-chain bridge security, pBFT consensus mechanism reliability, and multi-chain integration complexity
Regulatory Risk
- Global regulatory frameworks may impact both assets differently, with NFT marketplace operations and cross-chain liquidity protocols potentially subject to varying compliance requirements across jurisdictions
VI. Conclusion: Which Is the Better Buy?
📌 Investment Value Summary:
- TNSR Characteristics: Positioning within Solana's NFT marketplace sector, relatively recent market entry with associated early-stage dynamics
- RUNE Characteristics: Established presence in cross-chain liquidity protocols, longer operational history since 2019 with demonstrated market cycles
✅ Investment Considerations:
- Beginning Investors: Consider starting with smaller position sizes in both assets, prioritizing understanding of NFT marketplace mechanics (TNSR) and cross-chain liquidity protocols (RUNE) before allocation
- Experienced Investors: May evaluate portfolio diversification between NFT infrastructure exposure (TNSR) and DeFi liquidity protocol participation (RUNE), with attention to respective sector developments
- Institutional Investors: Assessment may include analysis of operational track records, ecosystem maturity levels, and alignment with broader portfolio strategies across different blockchain sectors
⚠️ Risk Disclosure: Cryptocurrency markets exhibit high volatility characteristics. This content does not constitute investment advice, financial guidance, or trading recommendations. Investors should conduct independent research and consider consulting qualified financial professionals before making investment decisions.
VII. FAQ
Q1: What are the main differences between TNSR and RUNE in terms of their core functions?
TNSR operates as Solana's leading NFT marketplace platform for traders and creators, while RUNE functions as a multi-chain liquidity protocol and cross-chain decentralized exchange solution. TNSR launched in April 2024, focusing on facilitating NFT trading within the Solana ecosystem, whereas RUNE has been operational since July 2019, utilizing pBFT consensus to enable cross-chain liquidity across multiple blockchain networks. These fundamental differences reflect distinct positioning within the crypto asset landscape—TNSR addresses NFT marketplace infrastructure needs, while RUNE tackles cross-chain DeFi liquidity challenges.
Q2: How do the historical price volatilities of TNSR and RUNE compare?
TNSR experienced approximately 99.3% decline from its April 2024 peak of $3.89 to its October 2025 low of $0.02852, demonstrating extreme short-term volatility. RUNE showed significant fluctuation from its May 2021 high of $20.87 to its September 2019 low of $0.00851264 over a longer timeframe. The volatility patterns differ primarily due to their different market entry periods and operational histories—TNSR's volatility reflects early-stage market dynamics following its recent launch, while RUNE's price movements demonstrate exposure to multiple market cycles and broader DeFi sector developments over a five-year period.
Q3: What is the current market sentiment for TNSR and RUNE as of January 23, 2026?
The current market sentiment index stands at 20, indicating "Extreme Fear" conditions in the cryptocurrency market. As of January 23, 2026, TNSR trades at $0.06171 with 24-hour trading volume of $203,629.23, while RUNE trades at $0.5899 with 24-hour volume of $153,064.09. This extreme fear sentiment reflects broader market uncertainty and may influence short-term price movements for both assets. Despite the fearful market conditions, TNSR shows higher trading volume compared to RUNE, suggesting maintained market interest in NFT marketplace infrastructure even during risk-averse periods.
Q4: What are the projected price ranges for TNSR and RUNE through 2031?
For 2026, TNSR's conservative forecast ranges from $0.051-$0.062, with optimistic projections at $0.062-$0.069, while RUNE's conservative estimate spans $0.39-$0.59, with optimistic scenarios reaching $0.59-$0.74. By 2031, TNSR's baseline scenario projects $0.052-$0.094 with optimistic potential up to $0.145, representing a 57% average change from current levels. RUNE's 2031 baseline forecast ranges from $0.79-$0.83, with optimistic scenarios extending to $1.23, indicating a 70% average projected change. These projections suggest RUNE may offer higher absolute price appreciation potential, though both assets show substantial long-term growth possibilities depending on ecosystem adoption and market conditions.
Q5: Which asset allocation strategy is recommended for different investor profiles regarding TNSR vs RUNE?
Conservative investors may consider allocating 20-30% to TNSR and 70-80% to RUNE, prioritizing the longer operational track record of RUNE since 2019. Aggressive investors might balance their portfolio with 40-50% TNSR and 50-60% RUNE, accepting higher exposure to emerging NFT marketplace opportunities while maintaining cross-chain liquidity protocol participation. Beginning investors should start with smaller position sizes in both assets, focusing on understanding NFT marketplace mechanics and cross-chain liquidity protocols before significant allocation. These strategies should be complemented with risk management tools including stablecoin reserves, options hedging strategies, and cross-asset portfolio diversification to mitigate cryptocurrency market volatility.
Q6: What are the primary risk factors investors should consider when comparing TNSR and RUNE?
TNSR faces market risks related to NFT sector performance volatility and early-stage price dynamics following its April 2024 launch, with technical considerations including NFT marketplace scalability and Solana network performance dependencies. RUNE's risk profile includes exposure to cross-chain DeFi adoption trends, liquidity protocol competition, cross-chain bridge security vulnerabilities, and pBFT consensus mechanism reliability factors. Both assets encounter regulatory uncertainties as global frameworks may impact NFT marketplace operations and cross-chain liquidity protocols differently across jurisdictions. Additionally, TNSR's shorter operational history presents less historical data for risk assessment compared to RUNE's demonstrated performance across multiple market cycles since 2019.
Q7: How do the 24-hour trading volumes of TNSR and RUNE indicate market interest?
As of January 23, 2026, TNSR records a 24-hour trading volume of $203,629.23, exceeding RUNE's volume of $153,064.09 by approximately 33%. This higher trading volume for TNSR despite its lower absolute price ($0.06171 vs $0.5899) and shorter market history suggests sustained market interest in Solana's NFT marketplace infrastructure. The volume differential indicates active trading participation in TNSR, potentially reflecting speculative interest in emerging NFT platforms or ongoing marketplace activity. However, trading volume should be evaluated within the broader context of the "Extreme Fear" market sentiment (index at 20), which may amplify short-term volatility patterns for both assets regardless of their respective volume levels.
Q8: What factors should institutional investors prioritize when evaluating TNSR versus RUNE?
Institutional investors should assess operational track records, with RUNE's longer history since July 2019 providing more extensive performance data across market cycles compared to TNSR's limited track record since April 2024. Ecosystem maturity evaluation is critical—RUNE's established cross-chain liquidity protocol infrastructure may offer more predictable integration pathways, while TNSR represents exposure to emerging NFT marketplace developments within the Solana ecosystem. Portfolio strategy alignment considerations include sector diversification between NFT infrastructure (TNSR) and DeFi liquidity protocols (RUNE), correlation analysis with broader portfolio holdings, and assessment of regulatory compliance frameworks applicable to each asset class. Due diligence should encompass technical architecture review, governance mechanisms analysis, and long-term sustainability evaluation of both protocols' business models.
* The information is not intended to be and does not constitute financial advice or any other recommendation of any sort offered or endorsed by Gate.