This comprehensive guide compares TokenFi (TOKEN) and Ethereum Classic (ETC) as investment assets, addressing critical differences in market positioning, price performance, and investment potential. TOKEN, launched in October 2023, operates as a no-code tokenization platform targeting the $16 trillion asset digitization industry, while ETC serves as a decentralized smart contract platform maintaining original Ethereum chain principles since November 2015. The article examines historical price trends, current market status, supply mechanisms, institutional adoption, technical ecosystems, and 2026-2031 price forecasts for both assets. It provides tailored investment strategies for conservative, aggressive, and institutional investors, alongside comprehensive risk analysis covering market volatility, technical vulnerabilities, and regulatory considerations. Real-time pricing and detailed price predictions are available on Gate. The guide concludes with actionable recommendations and FAQs addressing stability com
Introduction: Investment Comparison Between TOKEN and ETC
In the cryptocurrency market, the comparison between TokenFi (TOKEN) and Ethereum Classic (ETC) represents a fundamental discussion for investors. These two assets differ significantly in market capitalization ranking, application scenarios, and price performance, representing distinct crypto asset positioning.
TokenFi (TOKEN): Launched in October 2023, this all-in-one tokenization platform targets the tokenization industry projected to reach $16 trillion by 2030, positioning itself as a no-code solution for launching tokens and tokenizing assets.
Ethereum Classic (ETC): Since November 2015, it has maintained its position as a continuation of the original Ethereum chain, upholding the "code is law" principle while operating as a decentralized platform for smart contracts without downtime or third-party interference.
This article will provide a comprehensive analysis of TOKEN vs ETC investment value comparison, examining historical price trends, supply mechanisms, institutional adoption, technological ecosystems, and future projections, attempting to address investors' most pressing question:
"Which is the better buy right now?"
I. Historical Price Comparison and Current Market Overview
TokenFi (TOKEN) and Ethereum Classic (ETC) Historical Price Trends
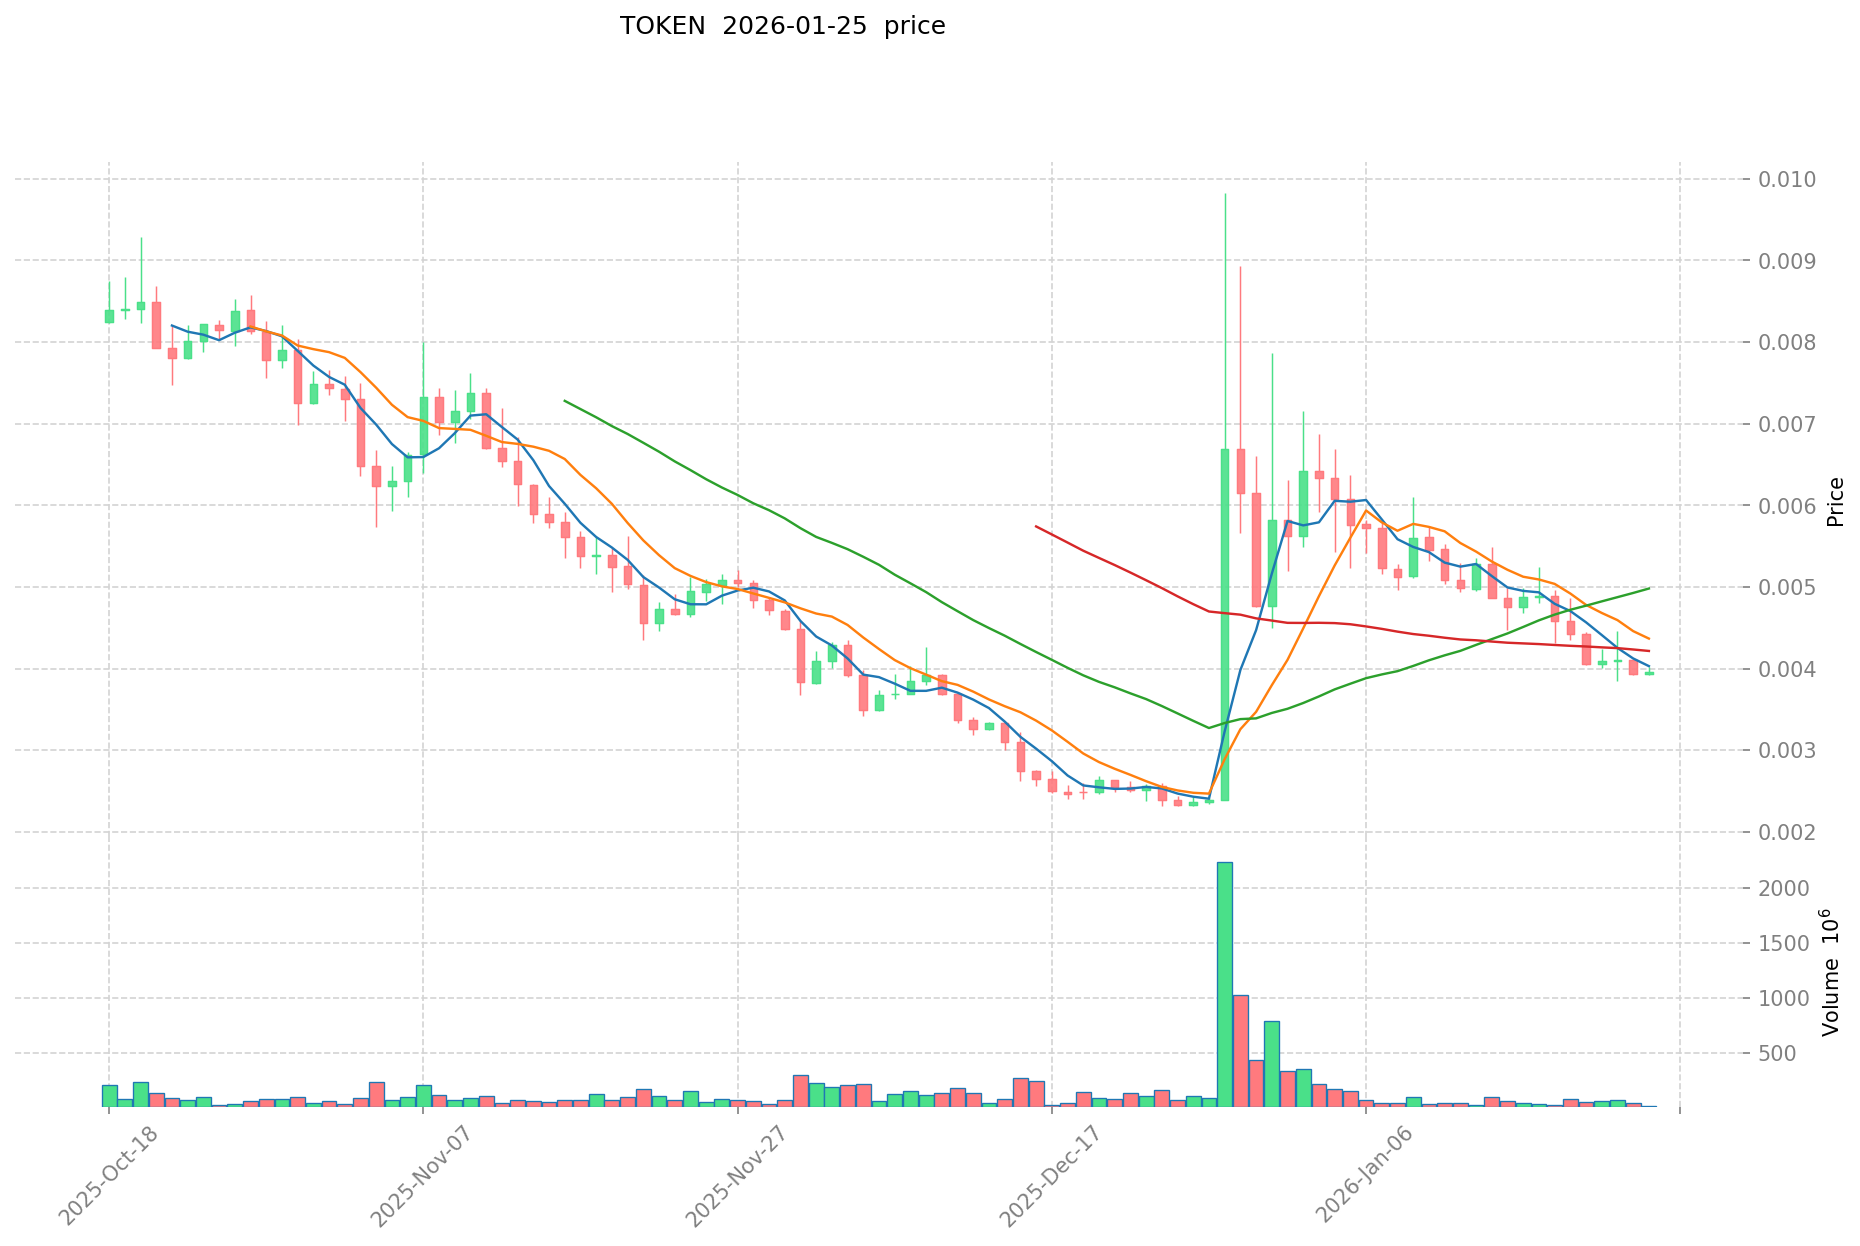
- 2024: TOKEN reached its historical high of $0.24646 on March 26, 2024, reflecting initial market enthusiasm following its launch in October 2023.
- 2021: ETC experienced significant price appreciation, reaching its all-time high of $167.09 on May 7, 2021, driven by broader cryptocurrency market momentum.
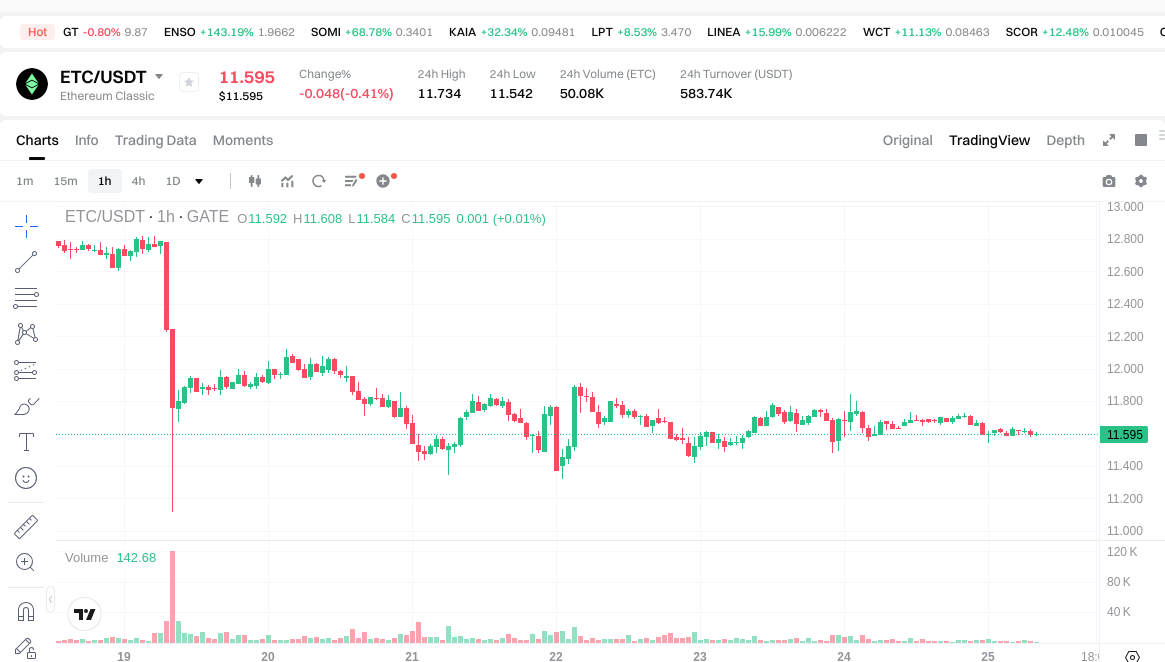
- Comparative Analysis: TOKEN has declined approximately 98.4% from its historical high of $0.24646 to its historical low of $0.002316 recorded on December 24, 2025. In contrast, ETC has experienced a decline from its peak of $167.09 to a current price of $11.594, representing a substantial correction from historical highs.
Current Market Status (January 25, 2026)
- TOKEN Current Price: $0.003955
- ETC Current Price: $11.594
- 24-Hour Trading Volume: TOKEN $71,088.42 vs ETC $584,819.84
- Market Sentiment Index (Fear & Greed Index): 25 (Extreme Fear)
View real-time prices:
II. Core Factors Affecting the Investment Value of TOKEN vs ETC
Supply Mechanism Comparison (Tokenomics)
Due to insufficient reference materials, specific supply mechanism details for both assets cannot be provided at this time.
Institutional Adoption and Market Application
Institutional Holdings: Current data does not allow for a comparative analysis of institutional preference between the two assets.
Enterprise Adoption: Information regarding the application of these assets in cross-border payments, settlements, and investment portfolios is not available in the provided materials.
National Policies: Regulatory attitudes from different countries toward these two assets cannot be determined from the available information.
Technical Development and Ecosystem Building
Without sufficient technical documentation in the reference materials, comparative analysis of technical upgrades and their potential impacts cannot be conducted.
Ecosystem Comparison: Data regarding DeFi, NFT, payment systems, and smart contract implementations for both assets is not available in the provided materials.
Macroeconomic Environment and Market Cycles
Performance in Inflationary Environments: Comparative analysis of anti-inflation properties cannot be established due to lack of historical performance data.
Macroeconomic Monetary Policy: The relationship between interest rates, US dollar index movements, and the performance of these assets requires more comprehensive data for meaningful analysis.
Geopolitical Factors: Information about cross-border transaction demand and international circumstances affecting these assets is not available in the provided materials.
III. 2026-2031 Price Forecast: TOKEN vs ETC
Short-term Forecast (2026)
- TOKEN: Conservative $0.0032431 - $0.003955 | Optimistic $0.003955 - $0.00423185
- ETC: Conservative $10.4355 - $11.595 | Optimistic $11.595 - $11.94285
Mid-term Forecast (2028-2029)
- TOKEN may enter a consolidation phase with projected price range of $0.00453571957125 - $0.006870850703325
- ETC may enter a moderate growth phase with projected price range of $10.77092016 - $17.38034844
- Key drivers: institutional capital inflows, ETF developments, ecosystem expansion
Long-term Forecast (2030-2031)
- TOKEN: Baseline scenario $0.005114421329086 - $0.007640822226586 | Optimistic scenario $0.007640822226586 - $0.009119691044635
- ETC: Baseline scenario $11.243763555024 - $17.635766123976 | Optimistic scenario $17.635766123976 - $20.81020402629168
View detailed price predictions for TOKEN and ETC
Disclaimer
TOKEN:
| Year |
Predicted High Price |
Predicted Average Price |
Predicted Low Price |
Price Change |
| 2026 |
0.00423185 |
0.003955 |
0.0032431 |
0 |
| 2027 |
0.00609920325 |
0.004093425 |
0.00225138375 |
3 |
| 2028 |
0.0058097981025 |
0.005096314125 |
0.00453571957125 |
28 |
| 2029 |
0.006870850703325 |
0.00545305611375 |
0.004962281063512 |
37 |
| 2030 |
0.009119691044635 |
0.006161953408537 |
0.005114421329086 |
55 |
| 2031 |
0.007946455115649 |
0.007640822226586 |
0.005195759114078 |
93 |
ETC:
| Year |
Predicted High Price |
Predicted Average Price |
Predicted Low Price |
Price Change |
| 2026 |
11.94285 |
11.595 |
10.4355 |
0 |
| 2027 |
12.710439 |
11.768925 |
7.41442275 |
1 |
| 2028 |
17.38034844 |
12.239682 |
10.77092016 |
5 |
| 2029 |
15.9948164376 |
14.81001522 |
13.6252140024 |
27 |
| 2030 |
19.869116419152 |
15.4024158288 |
11.243763555024 |
32 |
| 2031 |
20.81020402629168 |
17.635766123976 |
11.81596330306392 |
52 |
IV. Investment Strategy Comparison: TOKEN vs ETC
Long-term vs Short-term Investment Strategies
- TOKEN: Suitable for investors focused on tokenization industry growth potential and emerging blockchain infrastructure development. The asset's positioning in the no-code tokenization platform sector may appeal to those anticipating expansion in asset tokenization markets.
- ETC: Suitable for investors seeking exposure to established smart contract platforms with historical market presence and adherence to immutability principles. The asset may attract those interested in original Ethereum chain continuity and decentralized computation infrastructure.
Risk Management and Asset Allocation
- Conservative Investors: TOKEN 10-15% vs ETC 85-90%
- Aggressive Investors: TOKEN 30-40% vs ETC 60-70%
- Hedging Instruments: Stablecoin allocation, options strategies, cross-asset portfolio diversification
V. Potential Risk Comparison
Market Risks
- TOKEN: Significant volatility evidenced by the 98.4% decline from historical high to low, limited trading volume of $71,088.42 in 24-hour period, relatively recent market entry since October 2023 presenting limited historical performance data.
- ETC: Substantial correction from all-time high of $167.09 to current levels, exposure to broader cryptocurrency market cyclical fluctuations, comparative trading volume of $584,819.84 reflecting moderate liquidity conditions.
Technical Risks
- TOKEN: Network scalability considerations for tokenization platform operations, stability factors related to relatively new infrastructure deployment.
- ETC: Computational resource distribution considerations, potential security vulnerabilities inherent in smart contract platforms.
Regulatory Risks
- Global regulatory framework developments may impact both assets differently, with tokenization platforms potentially facing specific securities regulations, while established smart contract platforms may encounter varying jurisdictional treatment regarding decentralized computation services.
VI. Conclusion: Which Is the Better Buy?
📌 Investment Value Summary:
- TOKEN Advantages: Exposure to tokenization industry growth trajectory, positioning in no-code solution market segment, potential alignment with asset digitization trends.
- ETC Advantages: Established market presence since November 2015, proven track record in decentralized smart contract execution, adherence to immutability principles, higher trading volume indicating greater liquidity.
✅ Investment Recommendations:
- Novice Investors: Consider prioritizing ETC for greater historical market data and established infrastructure, while limiting TOKEN exposure to small portfolio percentages given extreme volatility characteristics.
- Experienced Investors: Evaluate risk tolerance and strategic allocation between established platform exposure (ETC) and emerging tokenization infrastructure (TOKEN), implementing position sizing appropriate to volatility profiles.
- Institutional Investors: Conduct comprehensive due diligence on both assets' technical architecture, regulatory positioning, and market microstructure before allocation decisions, considering liquidity requirements and risk management frameworks.
⚠️ Risk Disclosure: Cryptocurrency markets exhibit extreme volatility characteristics. This content does not constitute investment advice. Market participants should conduct independent research and consult qualified financial advisors before making investment decisions.
VII. FAQ
Q1: Which cryptocurrency has demonstrated greater price stability: TOKEN or ETC?
ETC has demonstrated significantly greater price stability compared to TOKEN. While TOKEN has experienced an extreme 98.4% decline from its historical high of $0.24646 to its historical low of $0.002316, ETC maintains a more established price structure with a 24-hour trading volume of $584,819.84 compared to TOKEN's $71,088.42. ETC's longer market presence since November 2015 has resulted in more predictable volatility patterns, whereas TOKEN's recent launch in October 2023 has been accompanied by substantial price swings characteristic of newly introduced assets.
Q2: What are the key differences in the use cases between TOKEN and ETC?
TOKEN functions as a no-code tokenization platform targeting the asset digitization industry, while ETC operates as a decentralized smart contract platform. TOKEN positions itself specifically for launching tokens and tokenizing real-world assets within an industry projected to reach $16 trillion by 2030. In contrast, ETC serves as a continuation of the original Ethereum chain, providing infrastructure for smart contracts, decentralized applications, and computational services while adhering to the "code is law" principle and maintaining immutability without third-party interference.
Q3: How do the 2026-2031 price forecasts compare between TOKEN and ETC?
The forecasts indicate markedly different growth trajectories for each asset. TOKEN's projected range spans from $0.0032431 (conservative 2026) to $0.009119691044635 (optimistic 2031), representing potential moderate appreciation from current levels. ETC's forecasts range from $10.4355 (conservative 2026) to $20.81020402629168 (optimistic 2031), suggesting relatively contained upside potential given its current price of $11.594. TOKEN's percentage growth potential appears higher due to its lower price base, though this comes with correspondingly elevated risk profiles.
Q4: What portfolio allocation strategy is recommended for conservative versus aggressive investors?
Conservative investors should consider allocating 10-15% to TOKEN and 85-90% to ETC, prioritizing the established infrastructure and historical performance data of ETC while maintaining limited exposure to TOKEN's emerging tokenization platform. Aggressive investors may allocate 30-40% to TOKEN and 60-70% to ETC, accepting higher volatility in exchange for potential exposure to tokenization industry growth. Both strategies should incorporate stablecoin positions, options strategies, and cross-asset diversification to manage risk effectively within the extreme volatility characteristic of cryptocurrency markets.
Q5: What are the primary technical risks associated with each cryptocurrency?
TOKEN faces technical risks related to network scalability for tokenization platform operations and infrastructure stability concerns given its recent deployment since October 2023. The platform's ability to handle increasing tokenization demands while maintaining security and performance remains to be proven through extended operational history. ETC encounters technical risks associated with computational resource distribution across its network and potential security vulnerabilities inherent in smart contract platforms, including consensus mechanism considerations and smart contract exploitation possibilities that have historically affected blockchain platforms.
Q6: How does current market sentiment affect investment decisions for TOKEN versus ETC?
The current Fear & Greed Index stands at 25 (Extreme Fear), indicating widespread market pessimism that affects both assets. This sentiment environment historically presents potential accumulation opportunities for investors with longer time horizons, though it also signals continued downside risk in the near term. TOKEN's limited trading volume of $71,088.42 makes it particularly susceptible to sentiment-driven volatility, while ETC's higher trading volume of $584,819.84 provides relatively better liquidity during adverse market conditions, enabling more efficient position entry and exit for investors.
Q7: What regulatory considerations should investors evaluate when comparing TOKEN and ETC?
Investors must assess different regulatory frameworks applicable to each asset. TOKEN's positioning as a tokenization platform may subject it to securities regulations governing asset digitization, token issuance, and potentially real-world asset backing requirements depending on jurisdiction. These regulations are evolving and may materially impact TOKEN's operational capacity and market access. ETC, as an established smart contract platform, faces regulatory considerations related to decentralized computation services, which various jurisdictions treat differently. Both assets remain subject to broader cryptocurrency regulatory developments that could affect market accessibility, taxation treatment, and institutional participation.
Q8: What are the key factors that could drive future price appreciation for TOKEN versus ETC?
For TOKEN, future price appreciation depends primarily on adoption rates within the tokenization industry, successful deployment of its no-code platform, and realization of the projected $16 trillion asset tokenization market opportunity. Platform user growth, strategic partnerships, and successful tokenization implementations would serve as key catalysts. For ETC, price appreciation factors include sustained smart contract utilization, network security improvements, ecosystem expansion in DeFi and decentralized applications, and broader institutional recognition of its immutability principles and position as the original Ethereum chain continuation. Both assets would benefit from favorable macroeconomic conditions and positive cryptocurrency market cycles.
* The information is not intended to be and does not constitute financial advice or any other recommendation of any sort offered or endorsed by Gate.