Master effective long wick candle trading strategies to boost your profits on Gate. Gain insight into bullish and bearish reversal patterns, learn precise identification techniques, implement robust risk management, and apply expert trading tips from seasoned technical analysts.
Key Points
- The "John Wick" candle features a small body and dramatic wick, signaling a strong rejection of the prevailing price direction. This pattern often marks the end of an uptrend (bearish signal) or downtrend (bullish signal).
- This pattern stands out for its ability to capture decisive shifts in market sentiment, where buyers or sellers mount a rapid and overwhelming counterattack within a single trading session.
- Successful long wick trading depends on placing stop-loss orders near the candle close, taking profits at relevant support/resistance levels, and always confirming signals with volume or trend indicators.
- Long wick effectiveness drops sharply in low-liquidity, highly volatile, or news-driven markets—never rely solely on this pattern for entries or exits.
What Is a Long Wick Candle?
The long wick candlestick pattern is recognized as a reversal signal that typically moves against the prevailing trend. Its name comes from the extended wick attached to the candle body.
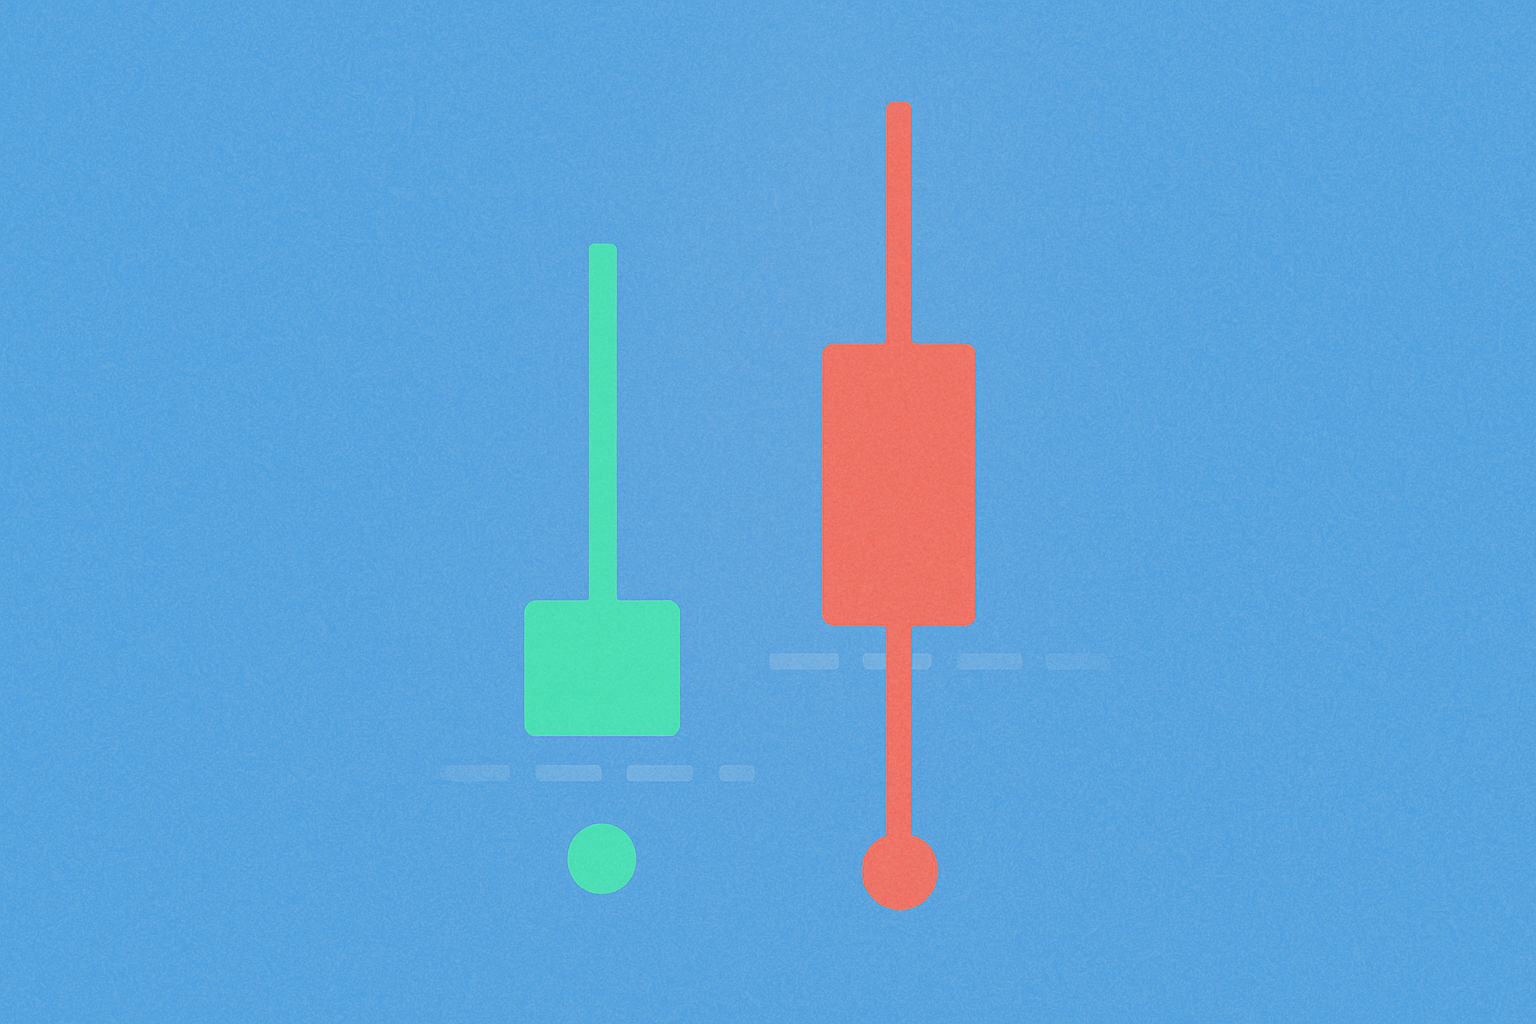
A bullish reversal signal with a long wick often appears at the end of a downtrend. This candle—commonly known as a Hammer—features a small body at the top, a small (or absent) upper shadow, and a long lower shadow. It demonstrates that sellers drove the price down, but buyers stepped in forcefully to close near the high.
A bearish reversal signal with a long wick shows up at the end of an uptrend. This candle, often called a Shooting Star, has a small body at the bottom, a small (or absent) lower shadow, and a long upper shadow. It indicates that buyers attempted to push prices higher but failed as sellers took control.
This long wick candlestick pattern is critical in technical analysis, providing a clear visual of the tug-of-war between bulls and bears in a single trading session. When a long wick forms, it means one side tried to dominate, but the opposition managed to reverse the situation before the candle closed.
Why Is It Called the "John Wick" Candle?
The "John Wick" candle captures moments of extreme market conflict, resulting in swift and unforgiving rejection. The name refers to the character John Wick—an unstoppable force known for ruthless efficiency and turning impossible scenarios upside down.
Long Wick = Rejection Weapon
A long wick visually records the intense battles that occur in the market.
-
During an uptrend (Bearish "John Wick" / Shooting Star): The long upper wick shows bulls aggressively driving prices higher, only to hit a powerful wall. Bears push prices back down, leaving a trail of destruction as a long wick. It’s a crushing counterattack—sellers assert dominance by forcing prices off their highs.
-
During a downtrend (Bullish "John Wick" / Hammer): The long lower wick tells the opposite story. Bears push prices to new lows, but suddenly massive buying power floods the market. Bulls launch a fierce retaliation, driving prices back up. This rejection of low prices shows buyers are ready to defend that level at any cost.
Small Body = Professional Efficiency
The classic John Wick candle has a relatively small real body compared to its wick. This means that, even with significant price swings during the session, the opening and closing prices are very close together—reflecting the efficiency and precision of the reversal.
This small body also signals that, despite major efforts to move price in one direction, opposing forces nearly neutralized those moves. It’s a sign that momentum is shifting.
Result = Brutal, Decisive Reversal
This candle signals a high-probability reversal. The psychological impact is powerful: trapped traders see the balance of power shifting, while new traders spot a clear entry signal.
When traders spot a John Wick candle, they recognize that market sentiment has fundamentally changed. Traders on the winning side may begin to close positions, while new traders open positions in the opposite direction.
The Psychology Behind Long Wick Candles
-
Bullish Long Wick (Long Lower Shadow): This typically occurs during a downtrend when sellers push prices sharply lower. Buyers then step in, driving prices back up at the close—signaling rejection of lower prices. Sellers attempt to maintain pressure, but buyers offer strong resistance, seeing the price as a buying opportunity.
-
Bearish Long Wick (Long Upper Shadow): In an uptrend, this pattern forms when buyers push prices up but sellers counter, leading to a close near the open. Buyers lose momentum, sellers regain control. Early-session buyers are overwhelmed by heavy selling, signaling the market may not be ready to continue rising.
-
Spinning Top Candles (Both Long Wicks): This pattern shows long wicks on both ends with a small body—indicating uncertainty and often foreshadowing trend changes. Bulls and bears are both strong, but neither can dominate, leaving the market in unstable equilibrium. This often precedes a major breakout.
Understanding this psychology is essential for anticipating the next price move. Long wicks aren’t just technical patterns—they’re visual evidence of the emotions and decisions of thousands of market participants.
What Happens When a Candlestick Has Two Long Wicks?
Spinning Top
Some candlesticks feature very long upper and lower shadows. This is known as a "spinning top." A spinning top signals buyer and seller uncertainty and suggests the market trend may reverse or shift sideways.
Spinning tops are important signals, indicating the market is in transition. No side holds full control, and spinning tops often appear at critical points such as:
- After extended trends when momentum starts to fade
- At major support or resistance levels
- Before key economic news releases
- At the end of consolidation periods
Experienced traders use spinning tops as alerts to prepare for market direction changes or to reduce position size until a clear trend emerges.
How to Identify Long Wick Candlesticks
How Long Is "Long Enough"? Practical Guidelines
The standard rule is that the wick must be at least two to three times the length of the candle body.
-
Strong Signal: If the wick is three times the body, this is a strong rejection signal. An extremely long wick relative to the body means the price level was intensely rejected and is likely to hold.
-
Weak Signal: If the wick is only slightly longer than the body, its significance is reduced and should be considered cautiously. In such cases, the pattern may reflect normal volatility rather than a true reversal.
In addition to the wick-to-body ratio, traders should factor in:
- Trend context: Long wicks are more meaningful after sustained, powerful trends
- Volume: High-volume long wicks are more reliable
- Location in price range: Long wicks at historical support/resistance are more important
- Timeframe: Long wicks on higher timeframes (daily, weekly) matter more than on lower (1-minute, 5-minute)
Don’t just look at the wick’s absolute length—consider the broader market context to assess its real significance.
How to Trade the "John Wick" (Long Wick) Candle Strategy
Consistent identification of long wick candlestick patterns should be followed by a plan for entering or exiting the market and placing Stop Loss or Take Profit orders.
For long wick candlestick trading:
- Place Stop Loss orders near the candle’s closing price.
- Take Profit orders are determined by resistance and support levels.
- Resistance marks where an uptrend temporarily stalls. When trading bullish long wick candles, place Take Profit near resistance.
- Support is where a downtrend pauses. For bearish long wick trades, set Take Profit near support.
Have a clear trading plan before entering a position based on a long wick candle. This includes:
- Choosing position size aligned with your risk tolerance
- Calculating your risk-reward ratio (ideally at least 1:2)
- Setting clear exit conditions for early trade closure
- Factoring in wider market conditions
When Is the Best Time to Trade Long Wick Candles?
Don’t jump into trades immediately after spotting long wick candles. Instead, wait for additional confirmation from technical indicators, oscillators, or other tools to confirm the reversal. Adjust your chart timeframe based on your trading strategy.
Effective confirmation methods include:
- Next candle confirmation: Wait for the following candle to close in the expected direction
- Volume confirmation: Look for increased volume on the confirmation candle
- Momentum indicators: Use RSI, MACD, or Stochastic for further confirmation
- Moving averages: See if price interacts with key moving averages
- Support/resistance: Confirm the long wick forms at critical technical levels
A patient approach and waiting for confirmation can dramatically reduce false signals and improve your win rate.
Trading Bullish Long Wick Candlesticks
- Spot bullish long wick candles at the end of bearish trends, marked by a long lower shadow.
- Place orders near the closing price of the identified long wick candle.
- Set Stop Loss at the bottom tip of the long wick.
- Place Take Profit at logical support levels, such as the previous swing low in the uptrend or the next major historical support.
Practical Example:
Suppose you spot a hammer with these characteristics:
- Open: $100
- High: $102
- Low: $90
- Close: $101
For this setup:
- Entry: Around $101–102 (after confirmation)
- Stop loss: Below $90 (e.g., $89)
- Take profit: Next resistance, e.g., $115
- Risk-reward: $12 risk for $14 potential gain (about 1:1.17)
Wait for the next candle to close above $102 for confirmation before entering.
Trading Bearish Long Wick Candlesticks
- Spot bearish long wick candles at the end of uptrends, marked by a long upper shadow.
- Place orders near the closing price of the identified candle and prepare to short.
- Set Stop Loss at the top tip of the long wick.
- Place Take Profit near support levels.
Practical Example:
Suppose you identify a shooting star with:
- Open: $200
- High: $220
- Low: $198
- Close: $199
For this setup:
- Entry: Around $199–198 (after confirmation)
- Stop loss: Above $220 (e.g., $222)
- Take profit: Next support, e.g., $180
- Risk-reward: $23 risk for $19 potential gain (consider adjusting or seeking a better setup)
In this case, the risk-reward ratio isn’t ideal. Wait for a better setup or adjust your targets.
Limitations of the Long Wick Candle Strategy
-
Low Liquidity & Disorderly Markets: In thinly traded assets or during off-peak hours, long wicks may be market noise rather than true reversal signals, often caused by a single large order. In low-liquidity markets, one big trader can create a long wick that doesn’t reflect real sentiment.
-
Lack of Trend Context: Long wicks lose significance in volatile or range-bound markets. Only treat long wicks as signals after sustained trends. In sideways markets, long wicks may be normal noise rather than reliable reversal indicators.
-
No Confirmation: Acting on long wicks alone is risky. Always wait for confirmation before trading. Many beginners get trapped by entering too soon, only to see the market continue its original trend.
-
Near Major News Events: Be careful if long wicks form around major news releases. Initial reactions can be misleading. Extreme volatility often accompanies news, and long wicks formed then may not last.
-
Ignoring Other Indicators: Never rely solely on wicks; always consider other indicators and market context. Using multiple indicators provides stronger confirmation and reduces false signals.
-
Extreme Volatility: In highly volatile markets, numerous long wicks may form in both directions, complicating reversal identification. During such times, it’s better to scale back trading or wait for stability.
-
No Guarantee of Reversal: Long wicks suggest possible, not certain, reversals. No technical pattern is 100% reliable, and robust risk management is always vital.
Successful traders recognize these limits and use long wick candles as part of a comprehensive strategy—not the sole basis for trading decisions.
Conclusion
Trading long wick candlesticks can be highly rewarding if you can reliably identify them. Bullish long wick candles usually mark the end of downtrends; bearish long wick candles signal the end of uptrends. By learning to read these patterns and understanding the market struggle between bulls and bears, you can anticipate reversals with greater confidence.
Still, trading long wick candlesticks involves certain risks. These candles only signal a possible reversal—they don’t guarantee it. Combine this pattern with other trading tools and practice before committing real capital.
Additional tips for success with long wick candle strategies:
- Always practice strict risk management with tight stop losses
- Never risk more than 1–2% of your trading capital on a single trade
- Practice pattern recognition in demo accounts before trading live
- Record every trade to learn from both wins and losses
- Continuously expand your technical and fundamental analysis skills
- Be patient and wait for high-quality setups—don’t force trades
With discipline and deep knowledge of long wick patterns, you can enhance your trading skills and make better-informed decisions in the market.
FAQ
What is a Long Wick Candlestick, and why is it important in technical analysis?
A Long Wick Candlestick is a candle with a wick much longer than its body, indicating strong buying or selling pressure. In technical analysis, it highlights significant market sentiment and potential trend reversals, helping traders spot market direction changes and high-probability trading opportunities.
How do you identify and distinguish the 'John Wick' candlestick pattern, and what conditions lead to its formation?
The 'John Wick' pattern is a bullish reversal featuring a long lower shadow, a small real body, and no upper shadow. It forms after a downtrend and signals strong upward movement potential, especially on high volume.
What are the most effective trading strategies and entry points for Long Wick Candlestick patterns?
The best entry is at the candlestick’s low, using a gradual entry strategy during pullbacks. Employ averaging down techniques to maximize profits and exit incrementally at resistance levels.
What risk management methods apply to Long Wick Candlestick patterns, and where should stop loss be placed?
Place stop losses beyond the nearest support or resistance of the pattern. Adjust according to your risk tolerance, and confirm signals with technical indicators like RSI or MACD before entering.
Does this pattern perform and behave differently across timeframes (daily, 4-hour, 1-hour)?
Yes, its reliability varies across timeframes. Shorter intervals tend to be more stable and produce more accurate signals, while longer intervals are influenced by broader market trends. Always validate with real data for best results.
How does the Long Wick Candlestick differ from other common patterns like Pin Bar and Hammer?
Long Wick Candlesticks feature a long lower wick indicating strong price rejection, while the Hammer appears at the bottom of a downtrend. Pin Bars resemble Hammers but are more universal. Long Wicks signal volatility and significant reversal potential.
How do you combine other technical indicators to validate Long Wick signals in practical trading?
Combine Long Wick patterns with RSI and MACD to confirm trend strength and momentum. Use support and resistance levels to validate entries and exits, and wait for confirmation from the next candle before opening a position.
* The information is not intended to be and does not constitute financial advice or any other recommendation of any sort offered or endorsed by Gate.