Master long-wick Japanese candlestick patterns (John Wick) for cryptocurrency trading. Discover how to spot hammers, shooting stars, and reversal setups on Gate. This in-depth guide is designed for both beginner and intermediate traders.
What Is a Long-Wick Candlestick?
Long-wick candlesticks are among the most revealing patterns in technical analysis for cryptocurrency trading. Seasoned traders regard this pattern as a reversal signal that tends to resolve in the opposite direction of the prevailing trend. The color of the candlestick body is key: green means the closing price is higher than the opening price, showing buying pressure, while red indicates selling dominance and a lower close.
These formations mark critical moments when the market sharply rejects specific price levels. The long wick visually records an intense struggle between buyers and sellers, where one side overpowers the other and reverses the initial move. This price rejection makes these candlesticks powerful indicators of potential trend shifts.
A bullish reversal signal with a long wick typically appears at the end of a prolonged downtrend. This candlestick, known as a Hammer, features a small body at the top, a short or nonexistent upper shadow, and a long lower wick extending two or three times the body’s length. The hammer formation shows that sellers pushed the price sharply down during the session, but buyers stepped in with enough force to close near or above the opening price.
On the other hand, a bearish reversal signal with a long wick usually emerges at the end of an extended uptrend. This candlestick, called a Shooting Star, presents a small body at the bottom, a short or absent lower shadow, and a long upper wick. The shooting star reveals that buyers tried to drive the price higher, but sellers regained control and forced a close near the session low, rejecting higher prices.
Why Is It Called a "John Wick Candlestick"?
The term "John Wick candlestick" has gained popularity in trading circles, drawing a parallel to the character’s brutal efficiency and ability to change the outcome in seconds. Just as the movie character is known for decisive action, these candlesticks reflect moments of extreme market conflict that end with rapid, relentless rejection—leaving one side out of the game.
The Long Wick: The Rejection Weapon
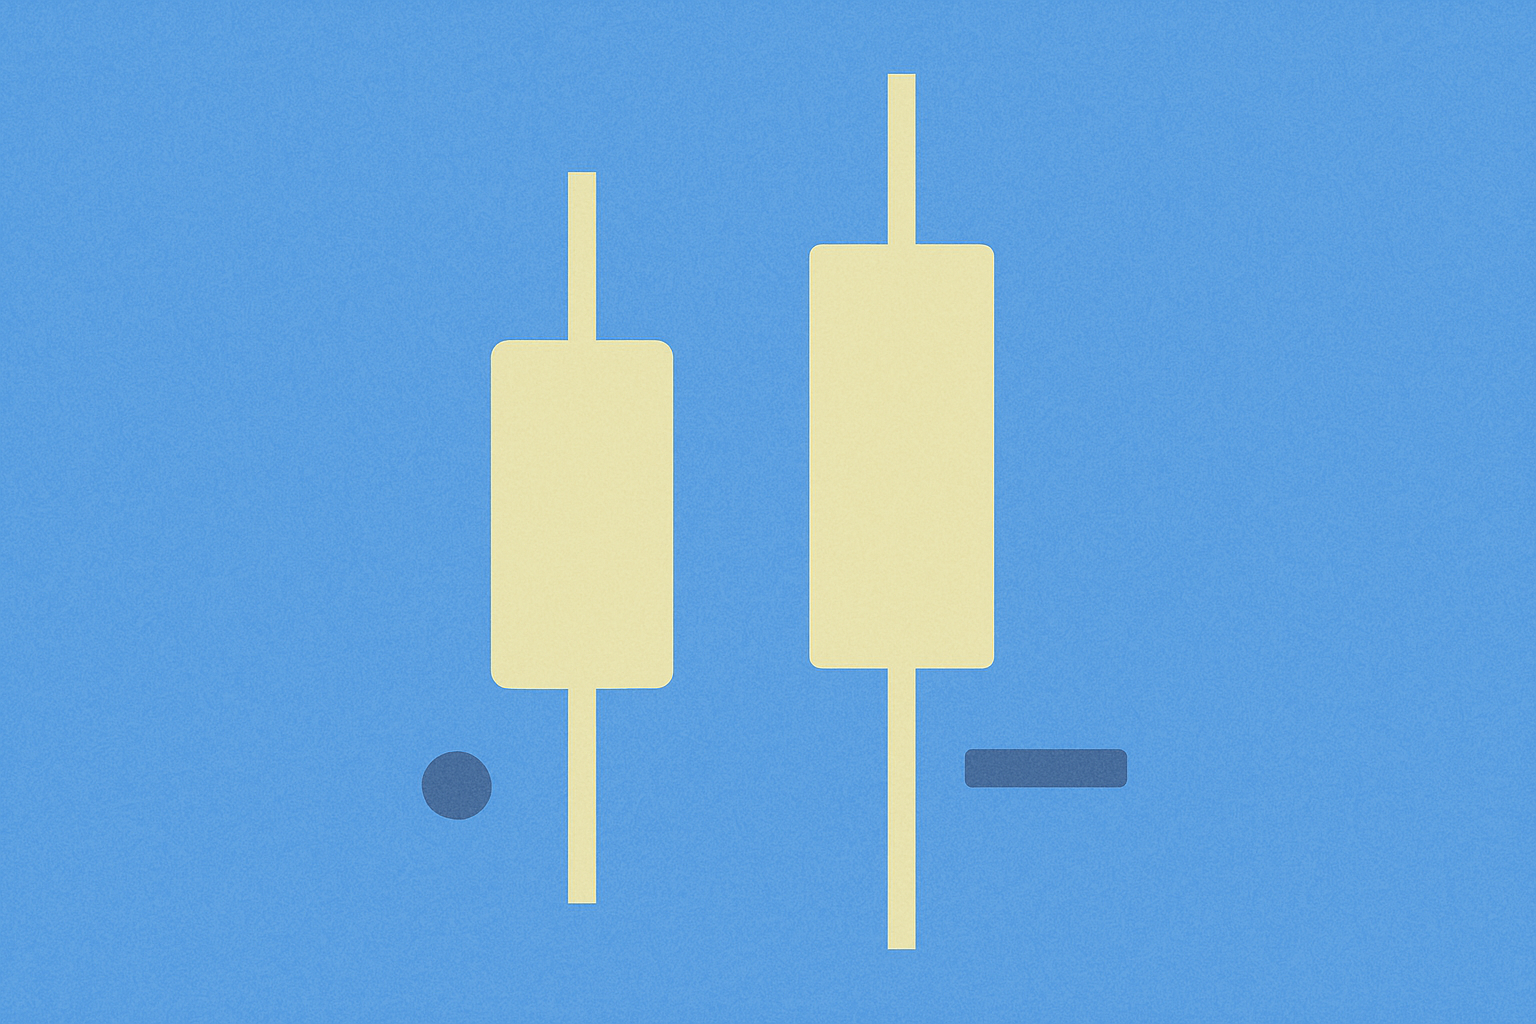
The defining feature of a John Wick candlestick is its long wick—more than just a chart line, it’s the visual record of a fierce battle between opposing market forces. The wick shows the full price range reached in the session, highlighting how far the market moved before a violent rejection. The longer the wick compared to the body, the more aggressive the rejection and the stronger the reversal signal.
The long wick acts as a double-edged sword: first, one group (buyers or sellers) pushes price to an extreme, creating the illusion of trend continuation. Then, the other side responds forcefully, erasing the move and trapping traders who chose the wrong direction. This "trap" mechanism is what makes John Wick candlesticks so effective.
The Small Body: Professional Efficiency
A classic John Wick candlestick has a small body relative to its wick, representing efficiency and precision in reversal. There’s no hesitation or erratic movement—the market rejects the price level with clear resolve. The small body means the open and close are close together, signaling that all the action happened at the extremes where the rejection occurred.
This feature is crucial because it sets John Wick candlesticks apart from other long-wick patterns. A large body may indicate indecision or erratic volatility, but a small body confirms a clean, decisive rejection. Professional traders seek this proportion as it suggests conviction in the reversal.
The Result: A Brutal and Decisive Reversal
A John Wick candlestick signals a high-probability reversal, trapping traders who followed the previous trend in losing positions. This pattern is particularly effective because it captures the exact moment when market sentiment shifts dramatically. Traders who entered late in the old trend end up on the wrong side, while those who spot the John Wick candlestick can position early for the new move.
The reversal’s intensity is reflected in how quickly price rejects the extreme. In crypto markets, where volatility and explosive moves are common, a well-formed John Wick candlestick can trigger a new trend lasting days, or even weeks.
Psychology Behind Long-Wick Candlesticks
Understanding the market psychology that produces long-wick candlesticks is essential for accurate interpretation and confident trading. Each wick type tells a different story about the buyer-seller battle, revealing who truly controls the market beneath the surface price moves.
Bullish long wick (long lower wick): This pattern appears in a downtrend when sellers push price to new session lows. At that critical point, buyers step in aggressively and drive price up, closing near the session high. The rejection at low prices signals strong demand and seller exhaustion. The psychology here: participants see the asset as undervalued and buy heavily, creating a support floor.
Bearish long wick (long upper wick): In an uptrend, buyers push price to new highs, fueling euphoria and expectations of further gains. Sellers then decisively regain control, driving price down to close near or below the open. This shows strong resistance at upper levels and buyers’ inability to sustain higher prices. The market psychology: traders are taking profits or new sellers see the asset as overvalued.
Spinning top candlesticks (both long wicks): This formation, with long wicks above and below, signals extreme market indecision. Both buyers and sellers push price in both directions during the session, but neither prevails. The result: a small body with long wicks on both sides. This pattern often precedes a trend change, reflecting an unstable balance of forces that will soon break. Experienced traders interpret the spinning top as a sign the current trend is losing momentum, and a major market decision is imminent.
What Happens If a Candlestick Has Two Long Wicks?
A Spinning Top
Some Japanese candlesticks show long shadows above and below, forming a "spinning top." This pattern deserves special attention for the valuable insight it provides into market psychology.
The spinning top signals deep indecision between buyers and sellers; neither side asserts clear control. During the session, price swings widely in both directions before closing near the open. This erratic action reveals a market in unstable balance.
This pattern suggests the market trend could soon change—either reversing completely or entering a sideways consolidation. Traders see spinning tops as warnings: the current trend is weakening and participants are reassessing their positions. In strong trends, a spinning top can flag exhaustion and the need for a pause or correction before continuation.
How to Identify a Long-Wick Candlestick?
Accurate identification of long-wick candlesticks requires objective criteria to avoid confusion with less significant patterns. Not every candlestick with wicks is a valid reversal signal; the wick-to-body ratio is the key factor.
How Long Should a Wick Be to Count as “Long Enough”?
Professional traders typically use the rule that the wick should be at least two to three times the body size. This ratio ensures that the price rejection was significant enough to be a valid signal.
Strong signal: If the wick is three times or more the body size, the price rejection is clear and forceful. These patterns have a higher chance of successful reversals because they show the market aggressively rejected extreme levels. Experienced traders prioritize these strong signals, especially at key support or resistance.
Weak signal: If the wick is only slightly longer than the body (less than 2x), the signal is much weaker and should be approached with caution. The rejection lacked decisiveness and may just be market noise, not a true reversal. Prudent traders wait for additional confirmation before acting on weak signals.
Besides wick-to-body ratio, context matters: a long-wick candlestick means more when it appears after an extended trend, at key support or resistance, or with high volume confirming the rejection’s strength.
How to Trade the “John Wick” Long-Wick Candlestick Strategy?
Trading long-wick candlesticks successfully requires disciplined pattern identification, strict risk management, and confirmation of signals. The strategy involves several key steps that must be executed precisely.
When trading long-wick candlesticks, place your stop loss strategically near the wick’s extreme, not the candlestick’s close. This makes sense: if price breaks beyond the wick’s extreme, the initial rejection failed and the reversal signal is invalid. This stop loss placement protects capital while allowing trades room to develop.
Take profit depends on the relevant support or resistance for the anticipated reversal:
Resistance: This level halts an uptrend due to selling pressure. Sellers find it attractive for taking profits or opening shorts, creating a temporary ceiling. For bullish long-wick candlesticks (hammers), set take profit near the next resistance, as price will likely face difficulty breaking through on the first try.
Support: This level stops a downtrend as buyers enter, creating a temporary floor. For bearish long-wick candlesticks (shooting stars), set take profit near the next support, anticipating price will find demand there.
When Is It Best to Trade a Long-Wick Candlestick?
Timing is critical when trading long-wick candlesticks. Don’t enter immediately upon seeing one—even if it meets all technical criteria. Patience and confirmation are key to avoiding losses from false signals.
Wait for confirmation from technical indicators before trading. This could come from momentum indicators like RSI showing divergence, rising volume validating the rejection, or the next candlestick closing in the reversal direction. Multiple signals add reliability.
Day traders seeking quick moves may use short timeframes (5 or 15 minutes) to catch intraday reversals, but these require constant attention and considerable experience to filter out market noise. For most traders, especially beginners, longer timeframes (1 hour, 4 hours, daily) offer more reliable signals and less noise.
Beginners should practice on demo or simulation platforms before risking real capital. This builds familiarity with the pattern, develops intuition in different market conditions, and refines the strategy without financial risk. When trading real money, start with small amounts and gradually increase position size as confidence and experience grow.
How to Trade a Bullish Long-Wick Candlestick
Trading bullish long-wick candlesticks (hammers) follows a structured process:
-
Identification: Look for a bullish long-wick candlestick at the end of a clearly defined downtrend. The candlestick should have a prominent lower wick (at least 2–3 times the body), a small body at the top, and a minimal or nonexistent upper shadow. Placement at the end of a downtrend is essential—a hammer in the middle of an uptrend does not carry the same weight.
-
Entry: Enter a buy order near the close of the long-wick candlestick and prepare to go long. Some traders wait for confirmation by the next candlestick closing above the hammer’s high, which reduces the risk of false signals but may mean a less favorable entry price.
-
Stop Loss: Set a stop loss just below the long wick’s low to limit losses. If price falls below this level, the initial rejection failed and the reversal signal is invalid. This stop loss placement makes sense because it marks where the trade thesis breaks down.
-
Take Profit: Set take profit at the next key resistance visible on the chart, such as a previous high, major moving average, or area where the asset faced resistance before. Consider trailing stops to protect gains if price moves favorably past the initial target.
How to Trade a Bearish Long-Wick Candlestick
Trading bearish long-wick candlesticks (shooting stars) uses a similar but inverted logic:
-
Identification: Spot a bearish long-wick candlestick at the end of a strong uptrend. Look for a prominent upper wick (at least 2–3 times the body), a small body at the bottom, and a minimal or nonexistent lower shadow. The pattern should appear after a significant rally to be valid as a reversal signal.
-
Entry: Enter a sell order near the candlestick’s close for a short position. As with hammers, some traders wait for confirmation by the next candlestick closing below the shooting star’s low, sacrificing entry price for more certainty.
-
Stop Loss: Set a stop loss just above the upper wick’s high to limit losses. If price rises above this level, the bearish reversal is invalid and it’s time to exit to preserve capital.
-
Take Profit: Place take profit near the next support level, expecting the reversal will meet demand there. Support can be a previous low, uptrend line, or major psychological level.
Limitations of the Long-Wick Candlestick Strategy
Like any trading strategy, long-wick candlestick trading has important limitations traders must understand to avoid unnecessary losses. Recognizing these boundaries helps you use the pattern more effectively and know when to stay out.
Low liquidity and erratic markets: In thin markets, long wicks may be noise generated by large orders—not true reversal signals. A single big buy or sell can create a temporary long wick with no real shift in sentiment. Always check for high volume to confirm genuine market participation.
Lack of trend: In sideways or consolidating markets, long wicks lose significance. These patterns work best at the end of established trends; in ranges, wicks appear often without meaningful reversals, increasing false signals.
No confirmation: Acting on a long wick alone, without confirmation from other indicators or subsequent price action, is risky. Even a perfect candlestick doesn’t guarantee reversal. Successful traders always seek additional confirmation before committing capital.
Near major news: Market reactions to news or events can create long wicks that don’t reflect real sentiment. Prices may quickly reverse after participants digest information, invalidating the original signal. Avoid trading long-wick candlesticks that appear right before or after major news releases.
Ignoring other indicators: Don’t rely solely on long wicks for trading decisions. Always consider other technical indicators, broader market context, support and resistance levels, and volume analysis. Multiple converging signals greatly boost success probability.
Extreme volatility: In highly volatile markets, especially during panic or euphoric runs, multiple long wicks may appear in opposite directions. This makes individual signals less reliable and calls for greater caution.
No guarantee of reversal: A long wick only suggests the possibility of a trend reversal—it does not guarantee it. Even perfect patterns can fail. Rigorous risk management, with well-placed stop losses and controlled position sizes, is absolutely essential when trading this pattern.
Conclusion
Trading long-wick candlesticks can be highly profitable if you learn to identify them correctly and incorporate them into a disciplined, comprehensive trading system. By spotting patterns like the hammer and shooting star and understanding the bull-bear dynamics behind them, you can anticipate potential reversals with greater confidence.
John Wick candlesticks mark critical moments when the market aggressively rejects specific price levels, revealing shifts in the power balance between buyers and sellers. The long wick records this battle visually, and the small body confirms the efficiency and decisiveness of the rejection. In the right context—at the end of extended trends, at key support or resistance, with confirming volume—these patterns offer high-probability signals.
However, remember: a long wick only signals the possibility of a trend reversal, never a guarantee. Success with this pattern requires pairing accurate candlestick identification with other technical analysis tools, strict risk management, and confirmation of signals before entering trades.
Practice is critical for developing the skill to recognize these patterns in real time and separate valid signals from market noise. Use demo accounts or simulation platforms for extensive practice before risking real money. Start with small positions, always use appropriate stop losses, and gradually increase your exposure as you build experience and confidence trading this pattern.
FAQ
What Exactly Is a 'John Wick' Long Candlestick and How Is It Identified on Trading Charts?
A John Wick candlestick is defined by a very long wick and a small body, signaling a strong market reversal. You identify it by a wick that stands out sharply from the body, revealing abrupt price direction changes.
What Are the Main Trading Strategies for 'John Wick' Long Candlesticks?
The main strategies focus on identifying rejections in uptrends for short entries. Look for candlesticks with long upper wicks, confirm price action, and execute orders after validating key support and resistance levels.
What Are the Risks and Limitations of Trading Based on the 'John Wick' Pattern?
The 'John Wick' pattern brings significant risks: lack of robust statistical validation, heavy reliance on visual patterns, vulnerability to false signals in volatile markets, and need for strict risk management discipline. Its effectiveness depends on market conditions and trader experience.
Which Timeframes Are Most Effective for the 'John Wick' Pattern?
The 'John Wick' pattern is most effective in short to medium timeframes, particularly 15-minute to 4-hour candlesticks. It works best in highly volatile markets with clear trends.
How Do You Distinguish a 'John Wick' Candlestick from Other Long-Wick Patterns?
A 'John Wick' candlestick stands out with a small body and extremely long upper and lower shadows. While other long-wick patterns have larger bodies or uneven shadows, the 'John Wick' maintains balance between both shadows.
Which Technical Indicators Best Complement Trading with 'John Wick' Candlesticks?
The most effective indicators are moving averages for trend confirmation, RSI for detecting overbought/oversold conditions, and the stochastic oscillator for precise entry signals. These provide robust confirmation for trades involving John Wick candlesticks.
* The information is not intended to be and does not constitute financial advice or any other recommendation of any sort offered or endorsed by Gate.