This comprehensive guide explores highs and lows as essential price points in trading, covering higher highs/lower lows patterns that signal market trends and trader psychology. The article explains how to identify bullish patterns (higher highs with higher lows) indicating buyer dominance and bearish formations (lower highs with lower lows) signaling seller control. It details multiple trading approaches including trend-following strategies, countertrend tactics, and breakout trading, each leveraging high/low analysis with Gate exchange integration. Traders learn practical applications: setting entry points at support/resistance levels, placing stop-losses below previous lows, and targeting profits at prior highs. The guide addresses both advantages (consistent income, frequent opportunities) and disadvantages (higher commissions, intensive monitoring) of highs/lows strategies. By mastering these patterns alongside risk management and technical indicators, traders develop systematic decision-making framework
What Are Highs and Lows in Trading?
In the world of trading, highs and lows represent fundamental price points that every trader must understand. A high refers to the maximum price level at which a security or asset has been traded during a specific period, while a low indicates the minimum price point reached during that same timeframe. These metrics are typically expressed in time-based formats to provide context for price movements and volatility analysis.
For instance, a 20-day high/low measurement displays the highest and lowest prices an asset has achieved over the past 20 trading days, offering insights into short-term price action. Similarly, a 52-week high/low provides a comprehensive view of an asset's annual price range, helping traders identify long-term trends and potential support or resistance levels. These timeframes can be adjusted based on trading strategies, ranging from intraday measurements to multi-year analyses.
A critical aspect to understand is that these highs and lows are calculated based on the closing price of each trading session. The closing price represents the final traded price when the market closes for the day, making it a standardized reference point for comparing price movements across different time periods. This consistency allows traders to make meaningful comparisons and identify patterns in price behavior.
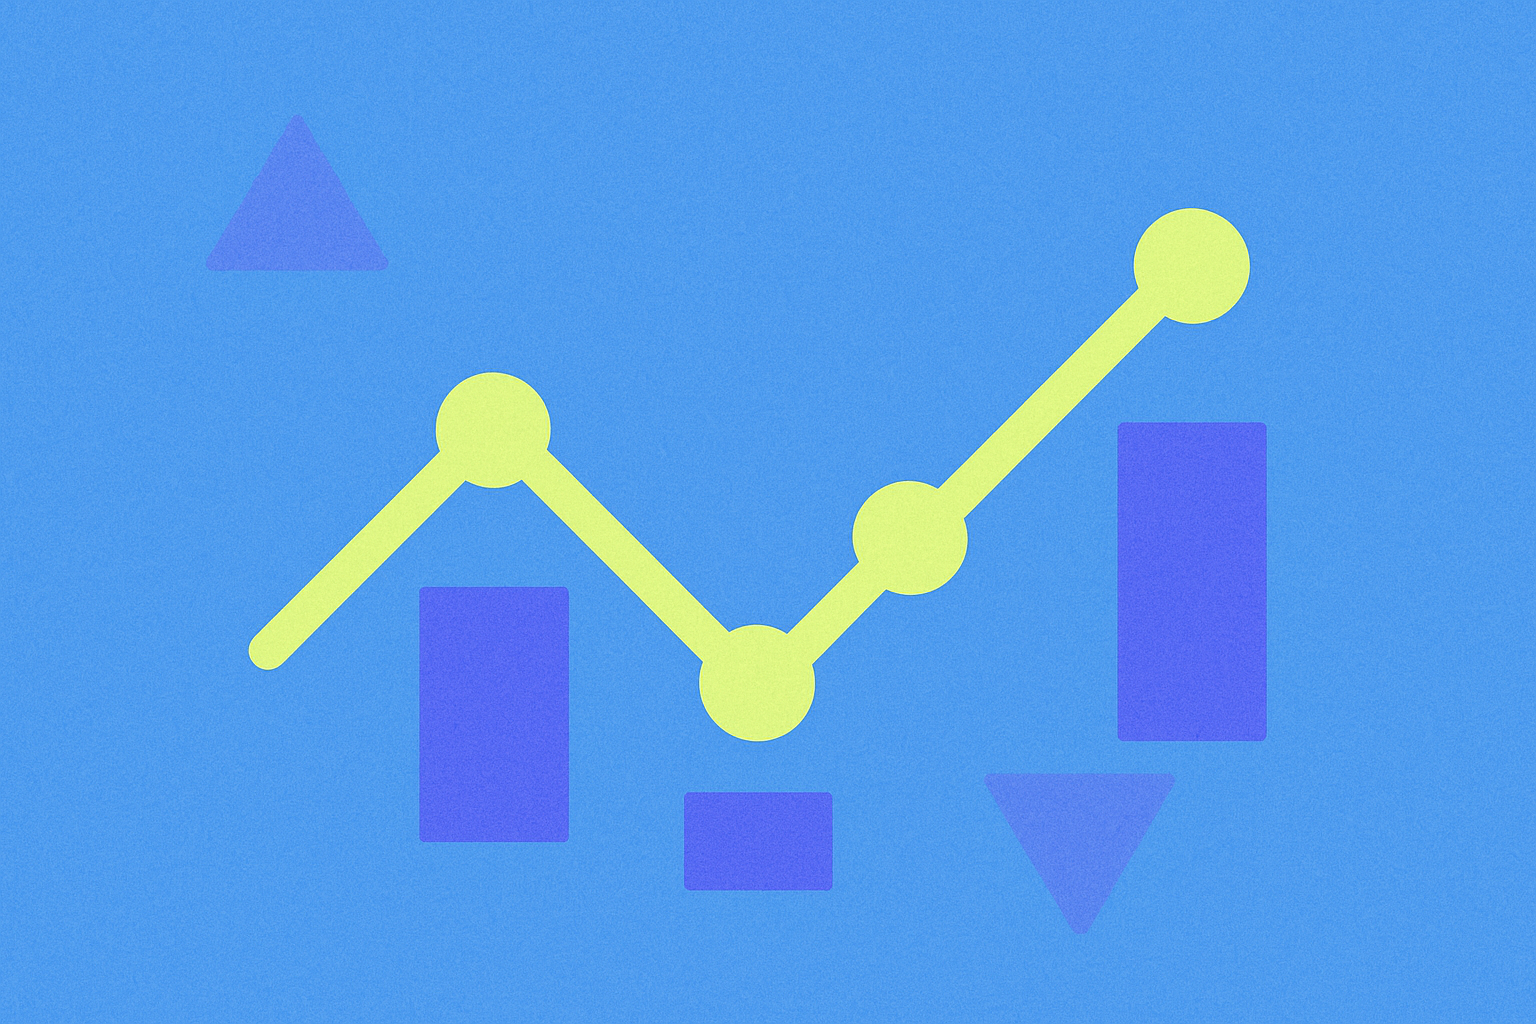
What Are Higher Highs and Lower Lows?
When traders discuss higher highs and lower lows, or their counterparts lower highs and higher lows, they are essentially expressing their analysis and expectations regarding an asset's future price trajectory. These patterns serve as key indicators of market sentiment and trend direction, helping traders make informed decisions about entry and exit points.
To identify upward trending patterns in asset values, traders look for two specific formations:
Higher High: This pattern occurs when a security's closing price reaches a new peak that exceeds the previous day's high closing price. For example, if a cryptocurrency closed at $50,000 yesterday (which was a high), and today it closes at $52,000 (also a high), this creates a higher high pattern. This formation is generally considered a reliable indication of bullish momentum and a strengthening upward trend, suggesting that buyers are willing to push prices to new levels.
Higher Low: This pattern emerges when a security closes at what would be considered a low price for that trading session, but that low is still higher than the previous day's closing low. For instance, if yesterday's low close was $48,000 and today's low close is $49,000, this creates a higher low. This pattern is particularly significant because it demonstrates that even during price pullbacks, the market is finding support at progressively higher levels, indicating underlying strength and buyer confidence.
Conversely, to identify downward trending patterns, traders monitor these formations:
Lower Low: This occurs when a security's closing price drops below the previous day's low closing price. If yesterday's low close was $48,000 and today's low close is $46,000, this creates a lower low pattern. This formation typically signals weakening support and increasing selling pressure, suggesting that the downtrend is gaining momentum and traders should exercise caution.
Lower High: This pattern appears when a security closes at a high price, but that high is lower than the previous day's closing high. For example, if yesterday's high close was $52,000 and today's high close is $51,000, this creates a lower high. This pattern indicates that even during upward price movements, the market is encountering resistance at progressively lower levels, suggesting weakening bullish momentum.
Mixed Pattern: Occasionally, traders encounter unusual situations where higher highs coincide with lower lows within the same analysis period. This rare pattern indicates extreme market volatility and indecision, where neither buyers nor sellers have established clear control. Such conditions typically arise during major news events, regulatory announcements, or periods of significant market uncertainty, making price predictions particularly challenging and risky.
What Is Higher High/Lower Low Strategy?
While the concepts of higher highs and lower lows are valuable tools for analyzing market trends and informing trading decisions, it is relatively uncommon for traders to base entire trading systems or strategies solely on the conjunction of higher high and lower low patterns. The primary reason for this cautious approach is that when these opposing patterns occur simultaneously, they typically indicate a highly unstable and unpredictable market environment.
A higher high combined with a lower low suggests that the market is experiencing significant volatility with no clear directional bias. During such periods, buyers and sellers are engaged in intense battles for control, leading to wild price swings that can quickly invalidate trading positions. Professional traders generally prefer to wait for clearer trend establishment before committing significant capital.
However, some experienced traders do incorporate these patterns into broader analytical frameworks. They might use higher high/lower low occurrences as signals to reduce position sizes, tighten stop-losses, or temporarily move to the sidelines until market conditions stabilize. Additionally, options traders might view such volatility as an opportunity to implement strategies that profit from price swings rather than directional movements.
The key takeaway is that while these patterns provide valuable information about market conditions, they should be combined with other technical indicators, fundamental analysis, and risk management principles to form a comprehensive trading approach.
How to Identify Lower Highs and Higher Lows Pattern
Identifying patterns of lower highs combined with higher lows represents an advanced skill in technical analysis, and while such patterns are less common than straightforward trending patterns, they do occur and can present unique trading opportunities for those who understand them. These patterns typically emerge during periods of price consolidation or when a trend is losing momentum, creating a narrowing price range that often precedes significant breakouts.
Experienced traders have developed various sophisticated methods to recognize and exploit lower high/higher low patterns, particularly during downtrends or transitional market phases. The key to successfully trading these patterns lies in understanding that they represent a compression of price action, where the trading range is systematically narrowing. This compression often builds up energy that eventually releases in a directional move, similar to a coiled spring.
To effectively identify these patterns, traders should:
- Chart multiple timeframes to confirm the pattern exists across different time horizons
- Use volume analysis to gauge the strength of each high and low formation
- Monitor momentum indicators to detect potential trend exhaustion
- Identify key support and resistance levels that define the narrowing range
- Watch for catalysts that might trigger the eventual breakout
Successful identification requires patience and discipline, as premature entries can result in losses if the pattern continues to develop further before breaking out.
Higher High/Lower Low and Lower High/Higher Low Patterns in Countertrend Strategies
Countertrend strategies represent a more aggressive and sophisticated approach to trading, where investors or traders deliberately position themselves against the prevailing market trend. This approach, also known as contrarian investing or countertrend trading, requires substantial experience, discipline, and risk management skills, as it involves taking positions that oppose the broader market momentum.
The fundamental premise behind countertrend strategies is that even strong trends experience temporary reversals or pullbacks. Skilled traders attempt to capitalize on these short-term price corrections by entering positions that profit from the temporary move against the trend, then exiting before the primary trend reasserts itself. This requires precise timing and a deep understanding of market psychology and technical patterns.
Typically, traders employing countertrend strategies are operating under the assumption that an established trend will experience a temporary market pullback or correction during its overall trajectory. For example, in a strong uptrend, prices rarely move straight up without periodic consolidations or minor retracements. These pullbacks create opportunities for countertrend traders to profit from the temporary weakness before the uptrend resumes.
Due to the inherently risky nature of trading against the trend, countertrend strategies are usually implemented as medium-term approaches at most. Positions are generally held for a few days to a few weeks maximum, as holding longer increases the risk that the primary trend will overwhelm the countertrend position. Quick execution and strict stop-loss discipline are essential components of successful countertrend trading.
What Are the Pros and Cons of Using Countertrend Trade Strategies?
Countertrend trading strategies offer distinct advantages and disadvantages that traders must carefully weigh before implementation. Understanding these trade-offs is crucial for determining whether this approach aligns with your risk tolerance, capital base, and trading objectives.
Advantages:
Shallower High/Low Periods: One of the primary benefits of countertrend strategies is that they typically exhibit less dramatic high/low oscillation compared to trend-following models. While individual profits per trade may be smaller, these gains occur with greater frequency. This creates a more consistent income stream and can result in a smoother equity curve. For traders who prefer regular, modest gains over occasional large wins, this characteristic makes countertrend strategies particularly appealing. The reduced volatility in returns can also make these strategies more psychologically manageable for many traders.
Increased Opportunity for Trades: When a security's price fluctuates within a relatively consistent range between established high and low prices, it creates numerous opportunities for both buying and short selling. Countertrend traders can repeatedly enter and exit positions as prices oscillate between these boundaries. This high frequency of trading opportunities means traders can stay active in the markets more consistently, potentially generating returns even when broader trends are unclear or absent. Additionally, the ability to profit from both upward and downward price movements within the range provides flexibility in various market conditions.
Disadvantages:
Higher and More Frequent Commissions: The increased trading frequency that characterizes countertrend strategies comes with a significant cost consideration. Each trade incurs transaction costs, including commissions, spreads, and potentially slippage. Traders who frequently engage in countertrend activity will often execute a substantially higher number of transactions compared to trend-following traders, leading to accumulated costs that can significantly impact overall profitability. This makes countertrend strategies more suitable for traders with access to low-cost trading platforms and sufficient capital to absorb these expenses.
Increased Monitoring Requirements: The market corrections and pullbacks that countertrend traders target are typically much shorter in duration and smaller in magnitude than the primary trends themselves. This necessitates much more intensive monitoring of positions and market conditions. Countertrend traders must be prepared to act quickly to capture profits or cut losses, often requiring real-time market monitoring during trading hours. This time commitment and attention requirement makes countertrend trading less suitable for part-time traders or those who cannot dedicate substantial time to market observation.
Psychology of Trading Highs and Lows
Understanding the psychological dynamics underlying patterns of highs and lows in trading is essential for developing market intuition and making informed decisions. These patterns are not merely mathematical constructs; they represent the collective emotions, expectations, and actions of all market participants, creating a window into market psychology that savvy traders can exploit.
Higher highs combined with higher lows signal that buyers have gained control of the market, demonstrating strong bullish sentiment. This pattern reflects growing confidence among traders, who are willing to purchase assets at progressively higher prices because they believe values will continue to rise. Each new higher high confirms that buyers are willing to pay more than previous buyers, while each higher low shows that sellers are unable to push prices down to previous levels. This creates a self-reinforcing cycle where success breeds confidence, attracting more buyers and further strengthening the upward trend.
Conversely, lower highs paired with lower lows suggest that sellers have taken control, indicating growing pessimism and bearish sentiment. This pattern reflects increasing fear and negative expectations among market participants. Each new lower high demonstrates that even temporary rallies are losing strength, while each lower low confirms that support levels are breaking down. Traders become increasingly willing to sell at lower prices, fearing that values will continue to decline. This negative psychology can create downward spirals where falling prices trigger more selling, accelerating the decline.
In summary, the psychological implications are:
Bullish Trend (Higher Highs/Higher Lows): Market participants exhibit confidence and optimism, actively driving prices upward through sustained buying pressure. Fear of missing out (FOMO) often intensifies these moves as more traders jump in, not wanting to miss the rally. This positive feedback loop can push prices well beyond fundamental valuations during extreme euphoria.
Bearish Trend (Lower Highs/Lower Lows): Traders demonstrate fear and pessimism, anticipating further price drops and acting accordingly through selling or short selling. Panic selling can accelerate during these periods, as traders rush to exit positions before suffering additional losses. This negative sentiment can persist even after prices reach objectively attractive levels.
Transitional/Indecisive Patterns: Mixed or conflicting high/low patterns signal market volatility, uncertainty, and caution. During these periods, neither bulls nor bears have established clear dominance, leading to choppy, unpredictable price action. Traders often reduce position sizes or stay on the sidelines during such phases, waiting for clearer directional signals before committing capital.
How to Trade Using Highs and Lows
Incorporating highs and lows into your trading strategy provides a systematic framework for making decisions based on observable price action rather than emotion or speculation. These price levels serve as objective reference points that can guide entry and exit decisions, risk management, and profit targets. Here are several proven approaches to consider when trading based on highs and lows:
1. Trend-Following Strategy: This approach involves aligning your trades with the established trend direction, which is generally considered the path of least resistance in trading. In an uptrend characterized by higher highs and higher lows, traders seek buying opportunities during temporary pullbacks or consolidations. The strategy involves entering long positions near higher low support zones, where previous price action has demonstrated buying interest. Stop-loss orders are typically placed just below these higher low levels to limit downside risk if the trend fails. Conversely, in a downtrend marked by lower highs and lower lows, traders look to short sell when new lower high formations appear, placing stop-losses just above these resistance levels. This strategy capitalizes on the statistical tendency for trends to continue rather than reverse.
2. Countertrend Strategy: More advanced and risk-tolerant traders sometimes attempt to identify and profit from trend reversals, though this approach requires considerable skill and experience. The strategy involves looking for signs that an established trend is losing momentum and may be ready to reverse direction. Key signals include divergences between price action and momentum indicators, extreme sentiment readings, or the formation of reversal patterns like double tops or bottoms. When implementing countertrend strategies, confirmation from multiple indicators is essential before entering positions, as premature entries can result in significant losses if the trend continues. Risk management is particularly crucial in countertrend trading, with tight stop-losses mandatory to protect against the primary trend reasserting itself.
3. Breakout Trading: This strategy focuses on key high and low price levels as potential breakout points that, when breached, often lead to significant directional moves. Traders monitor established resistance levels (previous highs) and support levels (previous lows), waiting for price to break through these barriers with conviction. When an asset breaks above a significant resistance level with strong volume, traders enter long positions, anticipating continued upward momentum. Conversely, when price breaks below major support with high volume, traders short sell, expecting further declines. The key to successful breakout trading is distinguishing genuine breakouts from false breakouts, which requires analysis of volume, momentum, and broader market context.
4. Using Highs and Lows for Targets and Stops: Beyond entry signals, understanding highs and lows can significantly refine trade execution and risk management. Previous high and low levels serve as logical profit targets, as these areas often represent zones where price action may stall or reverse due to previous buying or selling interest. For example, if entering a long position during an uptrend, setting take-profit targets at or just below previous swing highs provides a rational exit strategy based on observable resistance. Similarly, stop-loss placement just below previous swing lows (for long positions) or above previous swing highs (for short positions) provides protection based on meaningful technical levels rather than arbitrary distances.
In all cases, it is wise to combine high and low analysis with other analytical tools and indicators. While price highs and lows are powerful and objective measures of market behavior, they do not account for fundamental factors, broader market sentiment, volume dynamics, or other technical indicators that can provide additional confirmation or warning signals. A comprehensive approach that integrates multiple analytical perspectives typically produces more consistent results than relying on any single methodology.
Conclusion
Mastering the analysis and application of trading highs and lows represents a fundamental skill that can significantly enhance your cryptocurrency trading performance and decision-making capabilities. By developing the ability to clearly identify whether an asset is trending upward, downward, or moving sideways based on its peaks and troughs, you gain a strategic advantage in timing entries and exits, managing risk, and setting realistic profit expectations.
The patterns of higher highs and higher lows signal bullish strength and buyer dominance, suggesting opportunities to enter long positions or add to existing holdings. Conversely, lower highs and lower lows indicate bearish weakness and seller control, pointing toward short selling opportunities or the wisdom of staying on the sidelines. Recognizing these patterns early provides the foundation for profitable trading strategies aligned with market momentum.
However, it is crucial to remember that no single analytical tool or indicator provides a complete picture of market conditions. The most successful traders combine high and low analysis with comprehensive risk management practices, including proper position sizing, stop-loss placement, and capital preservation strategies. Additionally, integrating other technical analysis tools such as volume analysis, momentum indicators, and chart patterns, along with fundamental analysis and market sentiment evaluation, creates a more robust framework for trading decisions.
As you develop proficiency in identifying and trading based on highs and lows, maintain discipline in your approach, continuously refine your strategies based on results, and never risk more capital than you can afford to lose. With practice and experience, these concepts will become intuitive components of your trading toolkit, enabling you to navigate cryptocurrency markets with greater confidence and consistency.
FAQ
What are highs and lows in trading? What are their definitions and differences?
Highs are the highest prices reached during a trading period, while lows are the lowest prices. Rising highs and rising lows indicate an uptrend, whereas falling highs and falling lows signal a downtrend. These price extremes help traders identify market trends and potential entry/exit points.
How to identify and confirm price highs and lows in actual trading?
Identify highs and lows by tracking higher highs and higher lows in price charts. Use technical indicators like moving averages, RSI, and MACD for confirmation. Combine with trading volume surge and trend lines to validate patterns accurately.
What are the applications of highs and lows in technical analysis? How to use them to formulate trading strategies?
Highs and lows identify trends and support/resistance levels. Higher highs and higher lows signal bullish trends for buy opportunities during pullbacks. Lower highs and lower lows indicate bearish trends for sell signals. Traders use these patterns to set entry and exit points effectively.
How to use highs and lows to set stop-loss and take-profit positions?
Set stop-loss below recent lows to limit downside risk, and place take-profit above recent highs to lock in gains. This strategy helps manage risk and secure profits effectively.
What are the differences in identifying highs and lows across different timeframes (daily, weekly, monthly)?
Different timeframes reveal different price levels. Daily charts show short-term fluctuations, while weekly and monthly charts display long-term trends. A high or low on a daily chart may not align with weekly or monthly levels, creating varied analysis perspectives. Longer timeframes filter noise and identify more significant support and resistance levels.
What are relative highs and absolute highs? How do their meanings differ in trading?
Relative highs are peaks higher than previous highs, signaling uptrends. Absolute highs are the historical maximum price points. In trading, relative highs indicate bullish momentum and entry opportunities, while absolute highs mark market ceilings and help traders assess current valuation levels and potential resistance zones.
How to avoid trading on false highs and lows?
Use technical indicators like moving averages and RSI to confirm trends. Look for higher highs and higher lows in uptrends, lower lows and lower highs in downtrends. Verify signals with trading volume and price action patterns. Combine multiple indicators for better accuracy before entering trades.
* The information is not intended to be and does not constitute financial advice or any other recommendation of any sort offered or endorsed by Gate.