Mastering Cumulative Volume Delta (CVD) is essential for crypto traders seeking to understand market pressure beyond price action alone. CVD measures the cumulative difference between buying and selling volume, revealing whether buyers or sellers dominate order flow on exchanges like Gate. This comprehensive guide covers CVD fundamentals, including how rising CVD signals bullish momentum while falling CVD indicates bearish pressure, and explains the psychology behind volume divergences that precede price reversals. You'll learn practical trading techniques—trend confirmation, entry signals, divergence trading, and position management—enabling you to identify breakouts and anticipate turning points before they become obvious. The article also addresses critical limitations, including data quality issues and lagging during rapid movements, emphasizing CVD's role as a confirmation tool rather than standalone indicator. By combining CVD with technical analysis and risk management strategies, cryptocurrency trader
Introduction
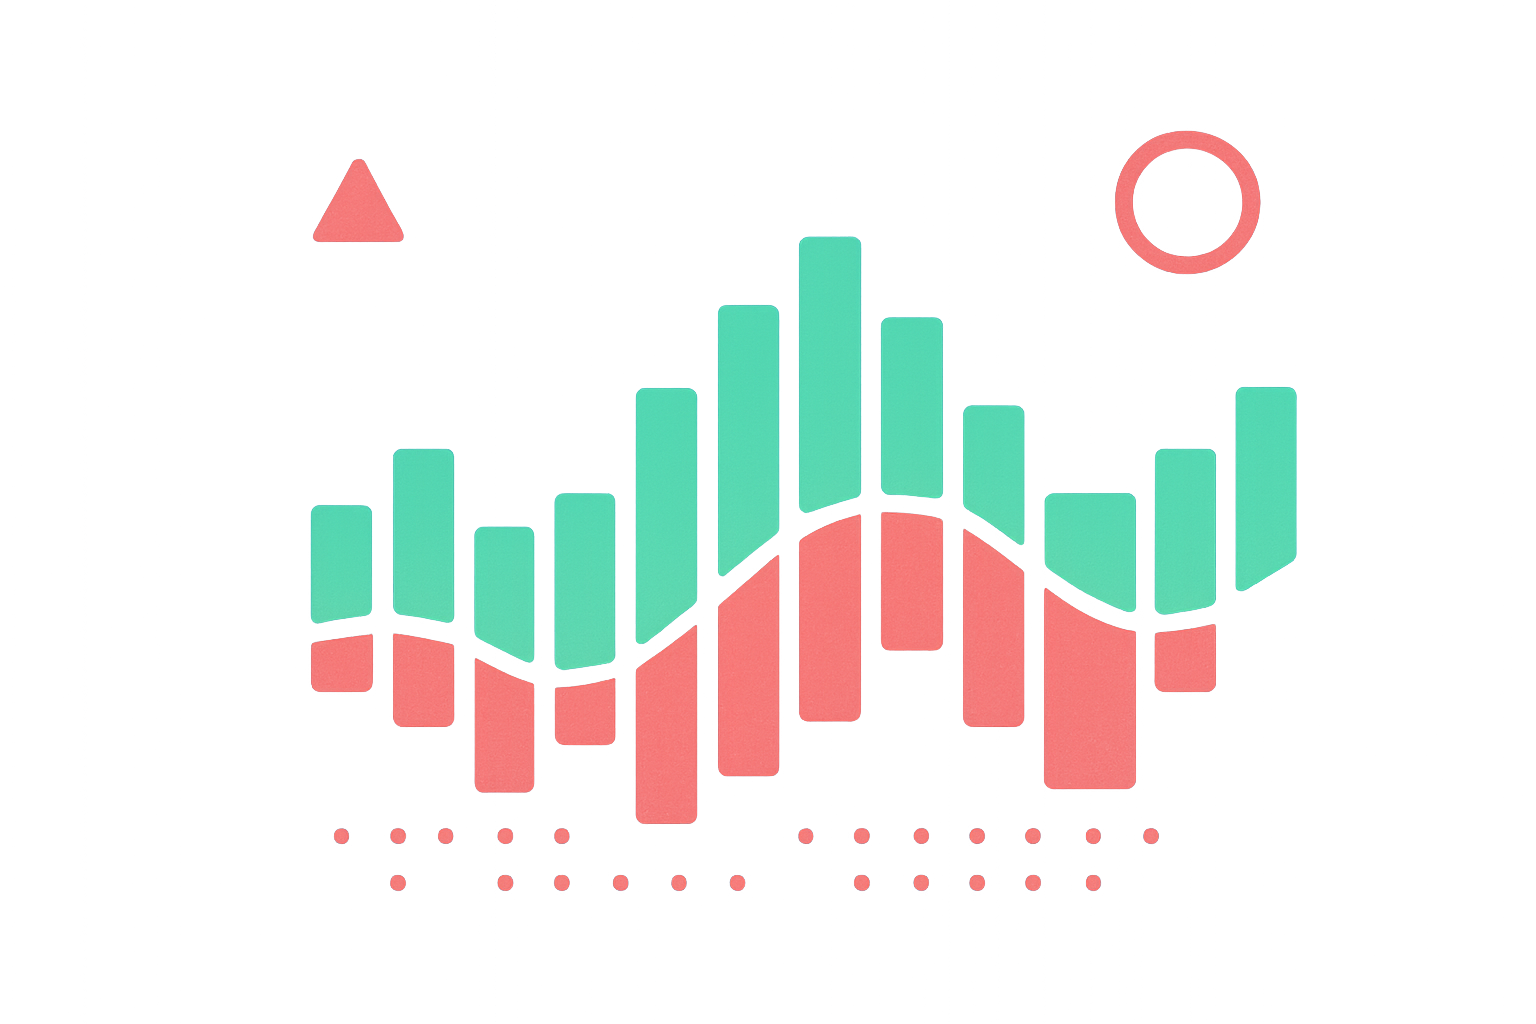
When Bitcoin's price fluctuates, it ultimately reflects the balance of buying and selling activity in the market. The Cumulative Volume Delta (CVD) measures this imbalance with precision. It begins each bar at zero and adds the volume of every buying trade while subtracting the volume of every selling trade. The resulting figure is plotted beneath the price chart, providing traders with a visual representation of market pressure.
When CVD is rising, it indicates that net buying pressure is dominant, suggesting that prices may continue to rise as more traders enter long positions. Conversely, if CVD is falling, it signifies that net selling pressure is prevailing, potentially signaling an impending price drop as market participants exit their positions or initiate short trades.
Traders utilize CVD to confirm price movements or identify divergences that may not be immediately apparent from price action alone. For instance, if Bitcoin reaches a new high while CVD does not rise correspondingly—instead leveling off or declining—this bearish divergence can signal underlying weakness in the rally. The price may be making higher highs, but the volume support is diminishing, suggesting that fewer buyers are willing to push prices further.
On the other hand, if the price hits a low but CVD remains flat or increases (bullish divergence), it may indicate hidden demand from institutional buyers or smart money accumulating positions. In the volatile crypto markets, these volume clues can be invaluable for timing entries and exits, helping traders avoid false breakouts and identify genuine trend reversals before they become obvious to the broader market.
What Is Cumulative Volume Delta?
Cumulative Volume Delta is essentially the accumulating total of "delta" volume—the difference between buying and selling volume—over a set period or across various price bars. It is also referred to as Market Delta in professional trading circles. Unlike regular volume indicators, which simply show total trades regardless of their direction, CVD reveals which side—buyers or sellers—has been more aggressive in executing their orders.
To understand the calculation: if 100 coins are bought at the ask price and 80 coins are sold at the bid price within a single bar, the delta is +20, indicating net buying activity. Over time, these individual deltas are added together cumulatively, allowing CVD to rise into the hundreds of thousands if buying continues to dominate across multiple periods.
The mechanics work as follows: in any given minute of trading, if the volume of buys (trades executed at the ask price, indicating aggressive buying) exceeds that of sells (trades at the bid price, indicating aggressive selling), CVD increases by that difference. Conversely, if sells outnumber buys, CVD decreases proportionally. Therefore, a green upward-sloping CVD line indicates that buyers are consistently stronger and more aggressive, while a red downward slope signifies sustained selling pressure dominating the market.
Many advanced trading platforms display CVD as either a line chart or a histogram beneath the main price chart, making it easy to spot trends and divergences at a glance. It is essential not to confuse CVD with regular volume indicators; CVD provides a more nuanced perspective by indicating whether the volume is primarily derived from buying or selling activity. This directional component makes it particularly valuable among order flow traders, futures traders, and increasingly among cryptocurrency traders, where similar principles of supply and demand dynamics apply.
Psychology Behind the CVD Indicator
CVD reflects trader psychology and overall market sentiment in ways that price alone cannot capture. When CVD is steadily rising, it indicates sustained buying interest, potentially driven by optimism, positive news flow, or the psychological "fear of missing out" (FOMO) that often characterizes bull markets. Traders recognize this trend and may feel more confident adding long positions, leading to a self-perpetuating cycle of buying that pushes prices higher.
On the contrary, a declining CVD suggests that sellers, profit-takers, or pessimistic traders are more aggressive in their execution, which can signal fear, uncertainty, or a shift in market sentiment. Observing CVD also reveals subtle mood shifts that may precede significant price movements: for example, if the price rises but CVD barely budges, it suggests that the upward movement lacks genuine buying conviction—perhaps driven by a few large orders rather than broad market participation.
According to professional trading resources, positive CVD reflects aggressive buying behavior, indicating upward momentum and bullish sentiment. Negative CVD, conversely, indicates that sellers are dominating order flow, suggesting downward momentum and bearish sentiment. These insights allow traders to gauge the emotional state of the market beyond what price action reveals.
In practice, an experienced trader might express concerns like: "Even though Bitcoin is testing resistance at $50,000, I'm worried because CVD has stalled—sellers aren't panicking and buyers aren't showing the same enthusiasm they did during the last rally. This could indicate exhaustion."
Divergences between CVD and price action provide particularly valuable insights into hidden market psychology. If the price reaches a new high but CVD does not confirm this increase—remaining flat or even declining—it indicates that the high was achieved with minimal buying support. This serves as a classic warning that bullish enthusiasm may be waning, and the rally could be vulnerable to reversal.
Conversely, if the price drops to new lows but CVD does not decrease correspondingly—or even rises slightly—it suggests that sellers might be running out of steam. This hidden strength indicates that buyers are stepping in at lower prices, potentially setting up for a reversal. In summary, CVD offers emotional and behavioral context that helps traders distinguish between genuine bullish momentum backed by strong buying and a "fake" rally where sellers are quietly distributing to late buyers. Astute crypto traders use CVD divergences as early warning signals to adjust their positions before price movements catch up to the underlying volume dynamics.
How to Identify CVD on Charts
Cumulative Volume Delta is typically displayed as a single line or histogram in a separate panel beneath the main price chart on most advanced charting platforms. It might be labeled as "Cumulative Delta," "Market Delta," or "Bid/Ask Volume" depending on the platform you're using. Understanding how to read CVD correctly is crucial for effective implementation.
Rising CVD: A green upward-sloping line or increasing histogram bars indicate net buying pressure accumulating over time. This pattern typically aligns with upward price action during healthy uptrends. When CVD rises alongside price, it confirms that the rally has genuine volume support and buying conviction behind it, making the move more likely to continue.
Falling CVD: A red downward-sloping line or decreasing histogram bars signify net selling pressure dominating the market. If the price is falling while CVD is also declining, it confirms market weakness and validates the downtrend. This alignment between price and CVD gives traders confidence that the selling pressure is real and sustained.
Zero Line: CVD typically starts at 0 at the beginning of the selected timeframe and then fluctuates above or below this baseline. Unlike oscillators with fixed overbought or oversold levels, CVD has no predetermined extreme values. Instead, traders focus on the shape, slope, and direction of the CVD line relative to price action to identify meaningful patterns.
Charts and Timeframes: CVD can be analyzed on any timeframe—from tick charts and 1-minute bars to hourly, 4-hour, or daily charts. Shorter timeframes may present more noise and false signals due to random order flow fluctuations, while longer timeframes tend to filter out this noise and reveal more meaningful trends. For cryptocurrency trading, daily or 4-hour CVD charts often reveal significant trends and divergences, while 1-minute CVD can be quite volatile and better suited for scalping strategies.
Divergence Signals: The most powerful CVD signals occur when price and CVD move in opposite directions. For example, if the price rises to a new high but CVD remains flat or declines (bearish divergence), it indicates weakening buying support. Conversely, if the price drops to a new low while CVD is flat or rising (bullish divergence), it suggests hidden buying interest and potential reversal. These divergence patterns often precede significant price reversals and provide early entry opportunities for contrarian traders.
How to Trade With CVD
Incorporating Cumulative Volume Delta into your trading strategy can significantly enhance your timing and decision-making process. Here are several practical approaches:
Trend Confirmation: When Bitcoin is rising and CVD is also increasing substantially, it confirms the rally has strong volume support. In such scenarios, traders might consider adding to long positions during minor price dips that maintain positive CVD momentum. If the price approaches a resistance level while CVD continues to rise strongly, it increases the probability of a breakout through that resistance. Conversely, if the price increases but CVD's growth is weak or flat, it's wise to exercise caution and consider taking profits rather than adding to positions.
Entry Signals: One effective strategy is to enter trades based on CVD breakouts. For instance, if Ethereum has been trading within a consolidation range and then CVD suddenly rises above previous highs while price breaks the range, it indicates that aggressive buyers are entering the market—potentially signaling an excellent opportunity to buy the breakout with confirmation. Similarly, if CVD drops sharply during a price breakdown below support, it supports the case for initiating a short trade or exiting long positions.
Divergence Trades: Trading based on divergences is a common and powerful technique. If Bitcoin reaches a new high but CVD fails to exceed its previous peak (bearish divergence), a trader might tighten stop-loss orders, reduce position size, or even consider initiating a short position, expecting a pullback or reversal. Conversely, if the price declines to a new low while CVD remains higher than previous lows (bullish divergence), it may signal an opportunity to start accumulating long positions in anticipation of a reversal. These divergence signals allow traders to act ahead of obvious price movements based on underlying volume sentiment.
Position Management: While holding an open position, continuously monitoring CVD helps confirm whether the trend remains healthy. For example, if you are long and the price reaches new highs while CVD stalls or trends downward, it serves as a warning that momentum may be fading. In such cases, you might decide to take partial profits, move stop-loss orders closer to current price, or close the position entirely. If CVD continues to rise strongly, it supports maintaining or even adding to your position in the trend.
Algorithmic Strategies: Some quantitative traders have programmed automated trading bots to monitor CVD patterns systematically. For instance, an algorithm might execute a buy order when CVD crosses above its moving average or trigger a sell order if CVD declines by a certain percentage threshold. While this approach requires programming knowledge and backtesting, it demonstrates CVD's suitability for systematic and algorithmic trading strategies in the cryptocurrency market.
Concrete Example: Imagine BTC struggling against resistance at $45,000, with sellers pushing CVD into negative territory as the price tests this level multiple times. However, the price holds firmly above support at $43,000. Suddenly, CVD spikes sharply upward (indicating aggressive buyers are entering), and the price breaks out above $45,000 with strong volume. This "CVD spike confirming volume breakout" provides added confidence to enter a long position with a stop-loss below $44,000. The alignment of price breakout and CVD surge significantly increases the probability of a sustained move higher.
In summary, use CVD as a confirmation and validation tool rather than a standalone signal. Let volume pressure—whether positive or negative—validate what the price chart is indicating. When CVD aligns with your trade idea and technical analysis, it substantially enhances the probability of success and helps you avoid false signals.
When Not to Use CVD
While Cumulative Volume Delta provides valuable insights into market dynamics, it has important limitations that traders should understand to avoid misinterpretation.
Data Quality Issues: CVD calculations rely heavily on accurate labeling of buy and sell transactions in tick-level or exchange data. Some exchanges or aggregated data feeds might have inaccuracies in tick direction classification, which can distort CVD readings. Additionally, during very low-volume periods—such as holidays, weekends, or overnight sessions—the CVD may produce noisy, erratic results that are difficult to interpret reliably. In these conditions, a few large orders can disproportionately affect the indicator.
Lagging During Rapid Movements: In extremely rapid market movements, such as flash crashes, news-driven spikes, or liquidation cascades, CVD may lag slightly behind price changes because it is a cumulative measure that processes each trade sequentially. It is not a leading indicator by nature. During such events, a single massive trade or a series of large orders can skew the delta significantly, causing CVD to shift sharply in one direction. This movement may not be sustained once the immediate volatility subsides, potentially giving false signals.
Liquidity Considerations: CVD is most effective and reliable in markets with good liquidity and consistent order flow, such as major cryptocurrency pairs like BTC/USD or ETH/USD on large exchanges. In illiquid altcoins or low-volume trading pairs, swings in CVD can be erratic, unpredictable, and less reliable for decision-making. The indicator tends to be more stable and meaningful with major pairs that have deep order books and continuous trading activity.
Not a Standalone Tool: No single analytical tool is infallible or should be used in isolation. CVD should be used to complement other forms of analysis rather than replace them. For instance, if Bitcoin is in a strong established uptrend confirmed by moving averages and CVD is rising, this serves as powerful confirmation. However, if CVD diverges from the trend, it acts as a warning signal—not an automatic guarantee of reversal. Traders should always consider the broader context, including fundamental factors, news events, market sentiment, overall trend structure, and other technical indicators.
False Signals in Choppy Markets: During sideways, range-bound markets with no clear trend, CVD can generate conflicting signals and whipsaws. The cumulative nature means it may drift in one direction even during consolidation, potentially misleading traders about the true balance of power.
Understanding these limitations helps traders use CVD more effectively by recognizing when its signals are most reliable and when additional confirmation is needed.
Bonus Tips and Historical Notes
Relation to Volume Delta: Think of CVD as the integral or running total of the Volume Delta indicator. While Volume Delta displays the immediate buy-sell imbalance for each individual bar or candle, CVD provides a cumulative running total of these imbalances. This cumulative perspective helps smooth out minor fluctuations and makes it easier to identify significant sustained buying or selling pressure over time, revealing trends that might be obscured in bar-by-bar delta readings.
Trading Ranges: In choppy, sideways trading ranges, CVD can appear noisy and difficult to interpret. To address this challenge, some experienced traders look for volume-based exits from the range. For example, a sudden substantial increase in CVD accompanied by a rise in overall volume can indicate that the range-bound consolidation is coming to an end, with one side (buyers or sellers) finally gaining control. This volume breakout often precedes a significant directional move.
Divergence Confirmation: If you notice a CVD divergence—for example, when prices rise to new highs while CVD remains flat or declines—it's best to pair that observation with additional confirming signals before acting. Often, a bullish price pattern combined with a bearish CVD divergence suggests waiting for a pullback or consolidation before making a purchase, rather than chasing the high. Combining CVD divergences with support/resistance levels, candlestick patterns, or momentum indicators increases reliability.
Aligning Timeframes: Use higher timeframe CVD to determine the overall market bias and direction. For instance, if the daily CVD chart for Bitcoin indicates a strong sustained upward trend, you can then examine the 1-hour or 4-hour CVD trends to identify optimal entry points for long positions. This multi-timeframe approach helps align your trades with the dominant trend while optimizing entry timing on shorter timeframes.
Historical Context: The concept of volume delta and order flow analysis originated in futures markets, particularly in equity index futures and commodities trading, where understanding the aggressor side (buyer or seller) provides crucial insights. As cryptocurrency markets have matured and institutional participation has increased, these professional tools have become increasingly relevant and effective in crypto trading.
Cumulative Volume Delta transforms raw volume data into actionable insights about market structure and participant behavior. By monitoring whether buyers or sellers dominate order flow, traders can confirm trends with greater confidence and anticipate potential turning points before they become obvious. When used alongside price action, support and resistance levels, and other technical indicators, CVD gives crypto traders a significant advantage in identifying both trend continuations and reversals.
Conclusion
CVD transforms volume data into actionable insights that go beyond what price charts alone can reveal. By continuously monitoring whether buyers or sellers dominate order flow, traders can confirm trends with greater confidence and anticipate potential turning points before they become obvious to the broader market.
It's essential to observe carefully how CVD behaves at critical support and resistance levels: divergences—such as when prices rise while CVD remains flat or declines, or when prices fall while CVD stays flat or rises—often indicate impending reversals or trend exhaustion. These divergence patterns provide early warning signals that allow traders to adjust positions before the crowd recognizes the shift.
Additionally, volume-backed breakouts, where CVD spikes sharply upward alongside price increases through resistance, are particularly strong signals to follow the movement with confidence. The combination of price breakout and CVD confirmation significantly increases the probability of a sustained directional move.
To apply this knowledge effectively, open your charting platform and overlay CVD indicators on your favorite cryptocurrency pairs. Use it to verify your analysis before entering a trade, to manage your current positions by monitoring ongoing volume support, and to identify early reversal signals through divergences. Practice observing CVD behavior during different market conditions—trending, ranging, and volatile—to develop intuition for how it reflects market psychology.
As you navigate the fast-moving crypto markets in the coming years, incorporating CVD into your analytical toolkit will allow you to stay attuned to the underlying "heartbeat" of the market—the actual flow of buying and selling pressure that ultimately drives price movements. This deeper understanding enables you to trade more wisely, with increased confidence, and with better timing for both entries and exits.
FAQ
What is CVD (Cumulative Volume Delta) and its role in cryptocurrency trading?
CVD measures the cumulative difference between buying and selling volume over time. In crypto trading, it identifies market strength and trend direction. Rising CVD signals bullish pressure, while declining CVD indicates bearish momentum, helping traders anticipate price movements and confirm trend reversals effectively.
How to use CVD indicator to identify buy and sell signals and market trends?
CVD measures cumulative volume delta by tracking buying versus selling pressure. When CVD rises sharply, it signals strong buying momentum and potential uptrend. Divergences between price and CVD reveal hidden strength or weakness. Rising CVD with price breakouts confirms bullish moves, while falling CVD during rallies warns of reversals.
How effective is trading when combining CVD with other technical indicators such as MACD and RSI?
Combining CVD with MACD and RSI significantly enhances trading effectiveness. CVD identifies volume trends while MACD confirms momentum and RSI validates overbought/oversold conditions. This multi-indicator approach improves entry/exit signals accuracy and reduces false breakouts, leading to higher profitability and better risk management in crypto trading.
What are the common risks when trading crypto using CVD and how to mitigate them?
Common CVD trading risks include lagging signals in volatile markets, false breakouts, and over-reliance on single indicators. Mitigate by combining CVD with price action, using proper position sizing, setting stop-losses, and avoiding trading during low liquidity periods. Backtest strategies thoroughly before live trading.
How should CVD trading strategies be adjusted across different market cycles (bull/bear markets)?
In bull markets, use CVD to confirm uptrends and identify breakouts with strong volume confirmation. In bear markets, apply CVD to spot reversal signals and support bounces. Adjust sensitivity levels based on volatility; tighten stops in bear markets and trail gains in bull markets using CVD divergences as exit signals.
How should beginners start learning and practicing CVD-based trading strategies?
Start by understanding CVD fundamentals through educational resources. Practice on demo accounts to analyze cumulative volume delta patterns without real risk. Study historical price action combined with CVD indicators. Begin with small positions, track your trades, and gradually refine your strategy based on market analysis and performance.
* The information is not intended to be and does not constitute financial advice or any other recommendation of any sort offered or endorsed by Gate.