This comprehensive analysis compares VINE and SNX, two distinct assets in the crypto market with divergent characteristics. VINE, launched January 2025 as a cultural tribute token, demonstrates higher volatility but newer market presence with a $26.1M market cap. SNX, established since March 2018, functions as a decentralized synthetic asset protocol with $150.3M market cap and longer operational history. The article examines historical price trends, tokenomics, market adoption, technological ecosystems, and 2026-2031 price predictions. SNX projects stronger growth potential with estimated 100% increase by 2031, while VINE shows 72% growth potential. Investment strategies vary by risk tolerance: conservative investors favor SNX (20-25% allocation), while aggressive investors may increase VINE exposure (25-30%). Both tokens carry distinct technical, market, and regulatory risks requiring thorough due diligence before investment decisions on Gate.
Introduction: Investment Comparison Between VINE and SNX
In the cryptocurrency market, the comparison between VINE and SNX has become a topic of continuous interest among investors. The two assets exhibit distinct differences in market capitalization ranking, application scenarios, and price performance, representing divergent positioning within the crypto asset landscape.
VINE (VINE): Launched in January 2025, this token emerged as a commemorative project celebrating community togetherness and creative expression. With its initial price of $0.248, VINE positions itself as a cultural tribute token, launched with a commitment that developer tokens would not be sold and profits would be donated to support free speech platforms.
SNX (SNX): Since its launch in March 2018, Synthetix has established itself as a decentralized synthetic asset protocol, enabling the creation of various on-chain synthetic assets including fiat-pegged currencies, precious metals, indices, and other cryptocurrencies. Originally known as Havven, SNX serves as the collateral backbone for the Synthetix network.
This article will provide a comprehensive analysis of the investment value comparison between VINE and SNX, examining aspects including historical price trends, supply mechanisms, institutional adoption, technological ecosystems, and future projections. We aim to address the question that concerns investors:
"Which presents more interesting characteristics for portfolio consideration?"
As of January 22, 2026, VINE ranks 762nd with a market cap of approximately $26.1 million, while SNX holds the 272nd position with a market cap of around $150.3 million. Both tokens have experienced notable price movements in recent periods, with VINE showing a 24-hour increase of 5.56% and SNX rising 6.31% in the same timeframe. The following sections will explore the fundamental differences and similarities between these two assets to provide investors with data-driven insights.
I. Historical Price Comparison and Current Market Status
VINE (Coin A) and SNX (Coin B) Historical Price Trends
- 2025: VINE launched in January 2025, reaching a historical high of $0.48185 on January 26, 2025, shortly after its debut.
- 2021: SNX experienced significant price movement, reaching its all-time high of $28.53 on February 14, 2021, during a period of heightened interest in decentralized finance protocols.
- 2025: VINE subsequently declined from its high of $0.48185 to a low of $0.01167 recorded on October 10, 2025.
- Comparative Analysis: During the 2025 market cycle, VINE demonstrated substantial volatility, declining approximately 97.58% from its peak to trough within months, while SNX has shown a longer-term decline of approximately 73% over the past year from its previous price levels.
Current Market Status (January 22, 2026)
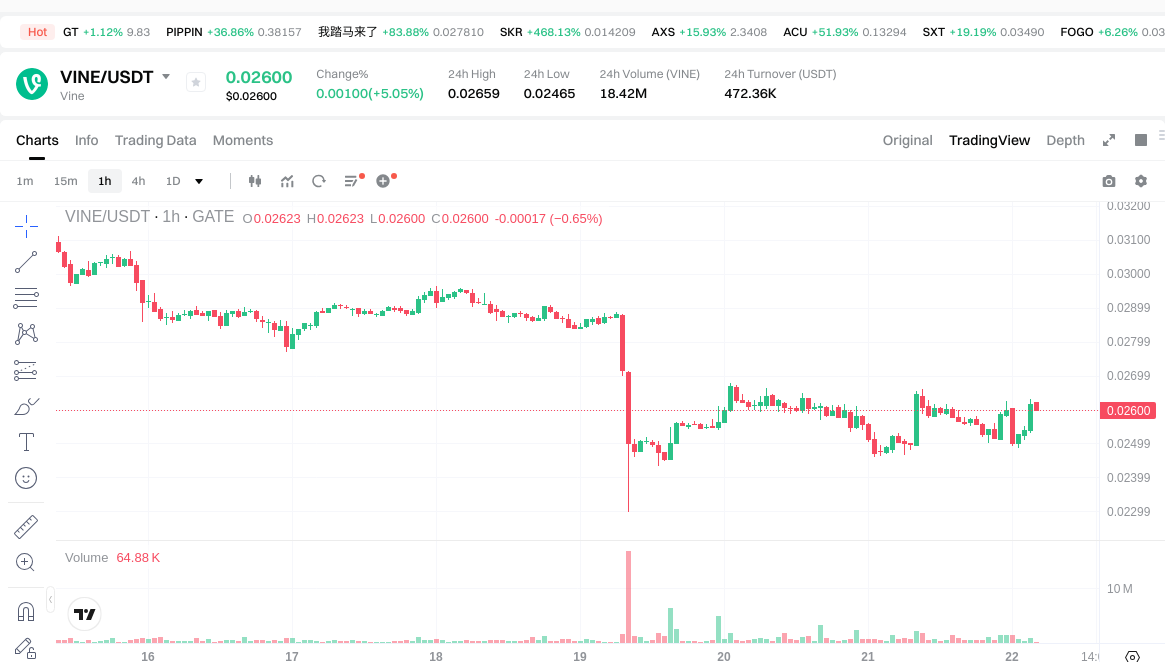
- VINE Current Price: $0.0261
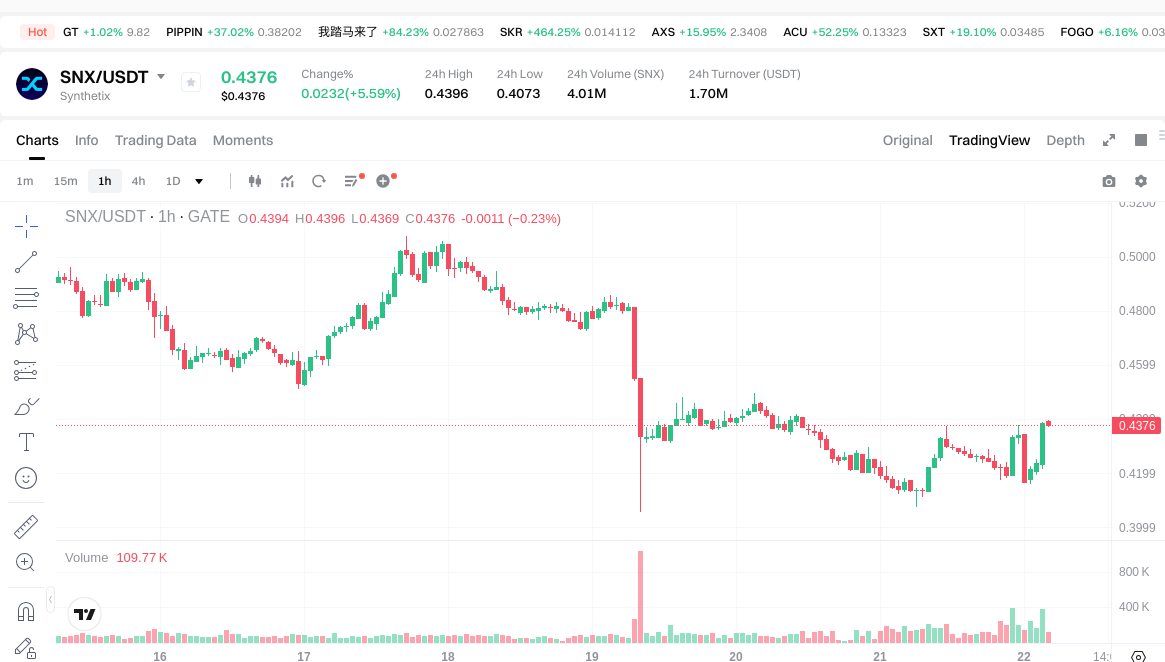
- SNX Current Price: $0.4376
- 24-Hour Trading Volume: VINE recorded $470,877.74 compared to SNX's $1,675,773.33
- Market Sentiment Index (Fear & Greed Index): 24 (Extreme Fear)
View real-time prices:
II. Core Factors Influencing VINE vs SNX Investment Value
Due to the absence of reference materials and available data in the knowledge base, a comprehensive comparative analysis of the core factors affecting VINE and SNX investment value cannot be provided at this time. The following framework outlines the key areas that would typically inform such an analysis:
Supply Mechanism Comparison (Tokenomics)
Insufficient data is available to detail the supply mechanisms of VINE and SNX. A thorough tokenomics analysis would typically examine factors such as total supply, emission schedules, and deflationary or inflationary characteristics.
Institutional Adoption and Market Application
Without access to relevant data regarding institutional holdings, enterprise adoption patterns, or regulatory frameworks across different jurisdictions, a meaningful comparison of institutional engagement with VINE and SNX cannot be established.
Technology Development and Ecosystem Building
Specific information regarding technical upgrades, development roadmaps, and ecosystem applications for either VINE or SNX is not available in the provided materials. Such analysis would normally cover areas including DeFi integration, smart contract functionality, and practical use cases.
Macroeconomic Environment and Market Cycles
The relationship between broader economic conditions and the performance characteristics of VINE and SNX requires data that is not present in the reference materials. Relevant considerations would include inflation dynamics, monetary policy impacts, and geopolitical factors affecting cross-border transactions.
III. 2026-2031 Price Prediction: VINE vs SNX
Short-term Prediction (2026)
- VINE: Conservative $0.0237-$0.0260 | Optimistic $0.0260-$0.0383
- SNX: Conservative $0.425-$0.438 | Optimistic $0.438-$0.622
Medium-term Prediction (2028-2029)
- VINE may enter a consolidation phase, with estimated price range of $0.0283-$0.0399
- SNX may enter an expansion phase, with estimated price range of $0.495-$0.932
- Key drivers: institutional capital inflows, ETF developments, ecosystem growth
Long-term Prediction (2030-2031)
- VINE: Base scenario $0.0314-$0.0449 | Optimistic scenario $0.0480-$0.0502
- SNX: Base scenario $0.535-$0.878 | Optimistic scenario $0.907-$0.983
View detailed price predictions for VINE and SNX
Disclaimer: Price predictions are based on historical data analysis and market trends. Cryptocurrency markets are highly volatile and subject to various risks. These predictions should not be considered as investment advice. Users should conduct their own research and consult with financial professionals before making investment decisions.
VINE:
| Year |
Predicted High Price |
Predicted Average Price |
Predicted Low Price |
Price Change |
| 2026 |
0.0382641 |
0.02603 |
0.0236873 |
0 |
| 2027 |
0.042434106 |
0.03214705 |
0.0241102875 |
23 |
| 2028 |
0.03990091846 |
0.037290578 |
0.02834083928 |
42 |
| 2029 |
0.0405255356415 |
0.03859574823 |
0.0304906411017 |
47 |
| 2030 |
0.050242015258402 |
0.03956064193575 |
0.0316485135486 |
51 |
| 2031 |
0.048044421598871 |
0.044901328597076 |
0.031430930017953 |
72 |
SNX:
| Year |
Predicted High Price |
Predicted Average Price |
Predicted Low Price |
Price Change |
| 2026 |
0.621676 |
0.4378 |
0.424666 |
0 |
| 2027 |
0.74693058 |
0.529738 |
0.45557468 |
21 |
| 2028 |
0.9319680634 |
0.63833429 |
0.574500861 |
45 |
| 2029 |
0.910775364972 |
0.7851511767 |
0.494645241321 |
79 |
| 2030 |
0.90732069979452 |
0.847963270836 |
0.75468731104404 |
93 |
| 2031 |
0.982959023553091 |
0.87764198531526 |
0.535361611042308 |
100 |
IV. Investment Strategy Comparison: VINE vs SNX
Long-term vs Short-term Investment Strategies
- VINE: May appeal to investors interested in community-driven projects and cultural tokens with speculative growth potential, though characterized by higher volatility and newer market presence
- SNX: May attract investors seeking exposure to decentralized finance infrastructure and synthetic asset protocols with established market history
Risk Management and Asset Allocation
- Conservative Investors: VINE 10-15% vs SNX 20-25% (within crypto portfolio allocation)
- Aggressive Investors: VINE 25-30% vs SNX 35-40% (within crypto portfolio allocation)
- Hedging Tools: Stablecoin allocation, options strategies, cross-asset diversification
V. Potential Risk Comparison
Market Risk
- VINE: Demonstrates substantial price volatility with historical drawdowns, limited trading volume ($470,877.74 in 24-hour period), and relatively lower market capitalization ranking (762nd)
- SNX: Shows extended price decline patterns over multi-year periods, moderate trading volume ($1,675,773.33 in 24-hour period), and established but fluctuating market position (272nd ranking)
Technical Risk
- VINE: Limited track record since January 2025 launch, scalability considerations for emerging projects, network stability assessment requires longer operational history
- SNX: Infrastructure dependencies inherent to synthetic asset protocols, smart contract complexity associated with collateralization mechanisms, oracle reliability considerations
Regulatory Risk
- Global regulatory frameworks continue evolving for both community tokens and DeFi protocols, with potential differential impacts on commemorative tokens versus synthetic asset platforms across various jurisdictions
VI. Conclusion: Which Is the Better Buy?
📌 Investment Value Summary:
- VINE Characteristics: Newer market entrant with community-focused positioning, demonstrates higher volatility patterns, lower market capitalization ($26.1 million), recent 24-hour price increase of 5.56%
- SNX Characteristics: Established DeFi protocol infrastructure since March 2018, larger market capitalization ($150.3 million), longer operational history in synthetic asset creation, recent 24-hour price increase of 6.31%
✅ Investment Considerations:
- New Investors: Consider starting with established protocols showing longer track records, maintain diversified portfolios across multiple asset classes, implement strict position sizing relative to overall capital
- Experienced Investors: Evaluate both projects within broader portfolio strategy, assess risk tolerance alignment with volatility profiles, consider technical and fundamental analysis frameworks
- Institutional Investors: Conduct comprehensive due diligence on protocol mechanics, evaluate liquidity depth and market structure, assess regulatory compliance frameworks
⚠️ Risk Disclosure: Cryptocurrency markets exhibit extreme volatility characteristics. This analysis does not constitute investment advice. Users should conduct independent research and consult qualified financial professionals before making investment decisions.
VII. FAQ
Q1: What are the main differences between VINE and SNX in terms of market maturity?
SNX has significantly greater market maturity, having launched in March 2018 compared to VINE's January 2025 debut. SNX has established itself as a decentralized synthetic asset protocol with a market cap of $150.3 million (ranked 272nd), while VINE is a newer community-driven commemorative token with a market cap of $26.1 million (ranked 762nd). SNX's longer operational history provides more historical data for analysis, whereas VINE's recent launch means it has a limited track record spanning less than two years.
Q2: How do the volatility profiles of VINE and SNX compare?
VINE demonstrates substantially higher volatility with a dramatic 97.58% decline from its peak of $0.48185 to its low of $0.01167 within months during 2025. In contrast, SNX shows more moderate but still significant volatility, with approximately 73% decline over the past year from previous price levels. VINE's 24-hour trading volume of $470,877.74 is considerably lower than SNX's $1,675,773.33, which may contribute to VINE's increased price sensitivity to market movements.
Q3: What are the primary use cases differentiating VINE from SNX?
SNX serves as the collateral backbone for the Synthetix network, enabling the creation of various on-chain synthetic assets including fiat-pegged currencies, precious metals, indices, and other cryptocurrencies. This positions SNX as DeFi infrastructure with practical applications in synthetic asset trading. VINE, conversely, positions itself as a cultural tribute token celebrating community togetherness and creative expression, with a commitment that developer tokens would not be sold and profits would support free speech platforms. These fundamentally different purposes appeal to distinct investor segments.
Q4: How do the price predictions for 2026-2031 compare between VINE and SNX?
SNX shows stronger projected growth potential across all timeframes. For 2026, SNX's optimistic range reaches $0.622 compared to VINE's $0.0383. By 2031, SNX's predicted high reaches $0.983 with an estimated 100% price change from current levels, while VINE's predicted high reaches $0.0502 with a 72% price change. The predictions suggest SNX may benefit more from institutional capital inflows, ETF developments, and ecosystem expansion, though both projections carry significant uncertainty inherent to cryptocurrency markets.
Q5: What allocation strategies are suggested for conservative versus aggressive investors?
Conservative investors might consider allocating 10-15% to VINE and 20-25% to SNX within their cryptocurrency portfolio, reflecting SNX's more established position and lower relative risk profile. Aggressive investors could increase exposure to 25-30% for VINE and 35-40% for SNX, accepting higher volatility in exchange for potential growth. Both strategies assume these allocations represent portions of a broader crypto portfolio, which itself should be sized appropriately relative to overall investment capital and risk tolerance.
Q6: What are the primary technical risks associated with each token?
VINE faces technical risks related to its limited operational history since January 2025, including unproven scalability and network stability over extended periods. SNX confronts different technical challenges inherent to its synthetic asset protocol, including infrastructure dependencies, smart contract complexity associated with collateralization mechanisms, and oracle reliability considerations for maintaining accurate price feeds. Both projects face evolving regulatory frameworks, though potentially with differential impacts given their distinct positioning as a community token versus a DeFi protocol.
* The information is not intended to be and does not constitute financial advice or any other recommendation of any sort offered or endorsed by Gate.