This comprehensive analysis compares VTHO and XLM, two distinct altcoins serving different market segments. VTHO functions as VeChain's transaction utility token with automatic generation mechanics, while XLM operates as a cross-border payment bridge currency. The article examines historical price trajectories, revealing VTHO's decline from $0.047 to $0.0008713 versus XLM's relative stability at $0.23603. Key differentiators include tokenomics structures, institutional adoption patterns (XLM through MoneyGram partnerships; VTHO through Walmart China), and trading liquidity ($742,949 XLM versus $26,477 VTHO daily volume). Five-year projections suggest varied growth potential based on ecosystem adoption. The comparison addresses critical investment questions through risk analysis, allocation strategies for conservative and aggressive investors, and specific recommendations for novice, experienced, and institutional investors. Both assets present distinct value propositions requiring careful portfolio considerat
Introduction: VTHO vs XLM Investment Comparison
In the cryptocurrency market, the comparison between VTHO vs XLM remains a recurring topic for investors. Both assets differ significantly in market cap ranking, use cases, and price performance, representing distinct positioning within the crypto ecosystem.
VeThor Token (VTHO): Launched in 2018, it serves as the utility token powering transaction execution and smart contract operations on the VeChainThor blockchain, gaining recognition for its role in enterprise blockchain adoption.
Stellar (XLM): Since its launch in 2014, XLM has been positioned as a decentralized gateway facilitating rapid, stable, and low-cost transfers of digital assets between banks, payment institutions, and individuals, attracting multiple projects to issue assets on its network.
This article will comprehensively analyze the VTHO vs XLM investment value comparison through historical price trends, supply mechanisms, institutional adoption, technical ecosystems, and future projections, attempting to address investors' most pressing question:
"Which is the better buy right now?"
I. Historical Price Comparison and Current Market Landscape
Historical Price Trajectory of VTHO (Coin A) and XLM (Coin B)
-
2018: VTHO reached its all-time high of $0.04671227 on August 29, 2018, reflecting early market enthusiasm for the VeChainThor ecosystem. XLM similarly achieved its peak of $0.875563 on January 3, 2018, during the broader cryptocurrency market rally.
-
2020: VTHO experienced significant downward pressure, recording its all-time low of $0.00015238 on March 16, 2020, coinciding with global market volatility. XLM also faced challenges, reaching its historical low of $0.00047612 on March 5, 2015, demonstrating resilience through subsequent recovery phases.
-
Comparative Analysis: Throughout market cycles, VTHO declined from its peak of $0.047 to current levels around $0.00087, representing a substantial contraction. In contrast, XLM, despite falling from its high of $0.88, maintains a relatively higher current valuation at approximately $0.236, indicating different market positioning and adoption trajectories.
Current Market Status (2026-01-18)
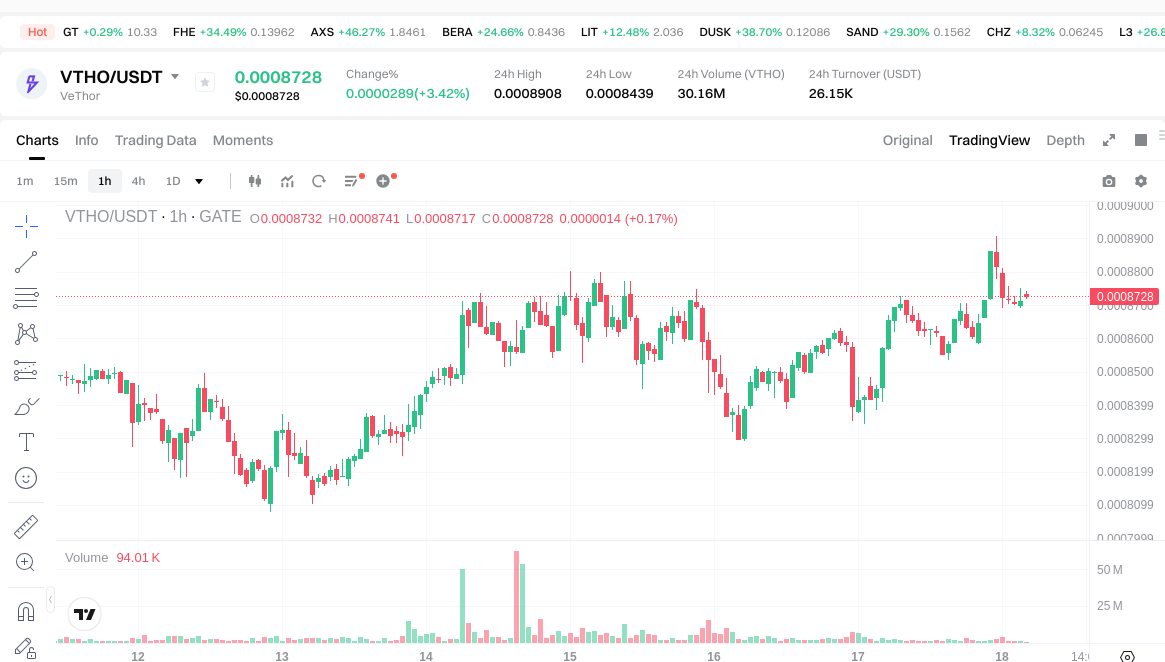
- VTHO Current Price: $0.0008713
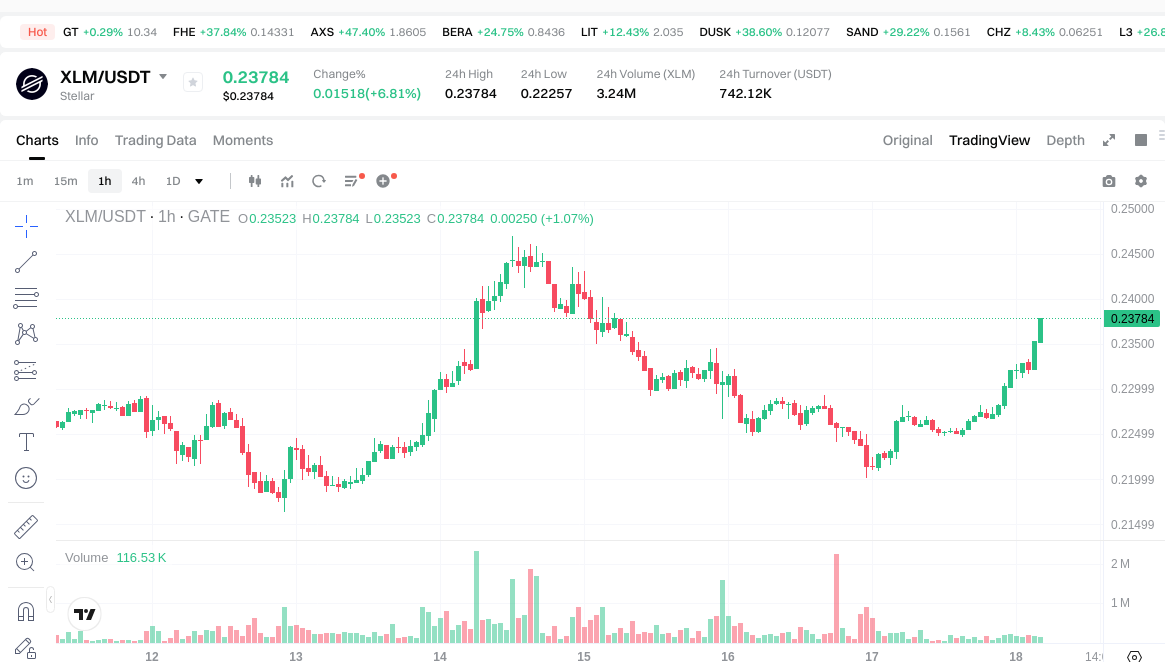
- XLM Current Price: $0.23603
- 24-Hour Trading Volume: VTHO recorded $26,477.06 compared to XLM's significantly higher $742,949.38
- Market Sentiment Index (Fear & Greed Index): 50 (Neutral)
View real-time prices:
II. Core Factors Influencing VTHO vs XLM Investment Value
Tokenomics Comparison
- VTHO: Operates within VeChain's dual-token system where VTHO is automatically generated by holding VET tokens. Each VET token generates 0.000432 VTHO daily, providing holders with continuous passive income. This generation mechanism forms the core of VeChain's economic model.
- XLM: Features a supply mechanism designed to support global payment infrastructure and cross-border transactions.
- 📌 Historical Pattern: The automatic generation mechanism of VTHO creates a continuous supply model that affects price dynamics through passive income opportunities for VET holders.
Institutional Adoption and Market Application
- Enterprise Adoption: XLM demonstrates adoption in global payment networks through partnerships with financial technology platforms including MoneyGram and PayPal for real-time transaction processing. VeChain (VET/VTHO ecosystem) shows implementation in supply chain management with enterprise clients including Walmart China and PwC, processing substantial industrial transactions.
- Market Application: XLM focuses on cross-border payment solutions and financial settlement systems. The VeChain ecosystem, which includes VTHO, targets supply chain verification and enterprise blockchain applications.
Technology Development and Ecosystem Building
- VTHO Technology Framework: Functions as the transaction cost token within VeChain's dual-token architecture, where VTHO consumption occurs during network operations while VET serves as the value storage component.
- XLM Technology Focus: Designed to facilitate global payment infrastructure and enable efficient cross-border financial transactions.
- Ecosystem Comparison: XLM operates primarily within payment and financial technology sectors. The VeChain ecosystem demonstrates utility in supply chain management and enterprise blockchain solutions.
Macroeconomic Environment and Market Cycles
- Market Sentiment Impact: Price movements for both VTHO and XLM are influenced by investor sentiment, macroeconomic trends, policy developments, and technological innovation cycles.
- Economic Policy Factors: Broader cryptocurrency market dynamics, regulatory frameworks, and global economic conditions affect both assets' market performance.
- Application-Driven Demand: VTHO's value correlates with VeChain network usage and enterprise adoption. XLM's market position relates to payment infrastructure development and cross-border transaction volumes.
III. 2026-2031 Price Prediction: VTHO vs XLM
Short-term Forecast (2026)
- VTHO: Conservative $0.000672 - $0.000872 | Optimistic $0.000872 - $0.001003
- XLM: Conservative $0.154 - $0.237 | Optimistic $0.237 - $0.264
Mid-term Forecast (2028-2029)
- VTHO may enter a gradual accumulation phase, with projected price range of $0.000719 - $0.001308
- XLM may enter a moderate growth phase, with projected price range of $0.234 - $0.417
- Key drivers: institutional capital inflows, ETF developments, ecosystem expansion
Long-term Forecast (2030-2031)
- VTHO: Baseline scenario $0.000987 - $0.001203 | Optimistic scenario $0.001203 - $0.001752
- XLM: Baseline scenario $0.298 - $0.364 | Optimistic scenario $0.364 - $0.554
View detailed price predictions for VTHO and XLM
Disclaimer
VTHO:
| Year |
Predicted High Price |
Predicted Average Price |
Predicted Low Price |
Price Change |
| 2026 |
0.00100326 |
0.0008724 |
0.000671748 |
0 |
| 2027 |
0.0011160177 |
0.00093783 |
0.0004782933 |
7 |
| 2028 |
0.001170693189 |
0.00102692385 |
0.000718846695 |
17 |
| 2029 |
0.001307582138205 |
0.0010988085195 |
0.00057138043014 |
26 |
| 2030 |
0.00129945095516 |
0.001203195328852 |
0.000986620169659 |
38 |
| 2031 |
0.001751852398809 |
0.001251323142006 |
0.001051111439285 |
43 |
XLM:
| Year |
Predicted High Price |
Predicted Average Price |
Predicted Low Price |
Price Change |
| 2026 |
0.2636028 |
0.23748 |
0.154362 |
0 |
| 2027 |
0.328209234 |
0.2505414 |
0.202938534 |
6 |
| 2028 |
0.33278161455 |
0.289375317 |
0.23439400677 |
22 |
| 2029 |
0.4168451441385 |
0.311078465775 |
0.28308140385525 |
31 |
| 2030 |
0.400357985452425 |
0.36396180495675 |
0.32028638836194 |
54 |
| 2031 |
0.554131848046651 |
0.382159895204587 |
0.298084718259578 |
61 |
IV. Investment Strategy Comparison: VTHO vs XLM
Long-term vs Short-term Investment Strategies
-
VTHO: Suitable for investors focused on enterprise blockchain adoption and dual-token economic models. The automatic generation mechanism through VET holdings creates passive income opportunities, making it appropriate for those seeking utility-driven assets within supply chain and industrial blockchain applications.
-
XLM: Suitable for investors interested in cross-border payment infrastructure and financial technology ecosystems. The focus on global payment networks and partnerships with established financial institutions positions it for those evaluating payment settlement solutions.
Risk Management and Asset Allocation
-
Conservative Investors: VTHO 20-30% vs XLM 70-80%. This allocation prioritizes the more established market position and higher liquidity profile while maintaining exposure to emerging utility token models.
-
Aggressive Investors: VTHO 40-50% vs XLM 50-60%. This approach balances exposure between payment infrastructure development and enterprise blockchain utility with higher risk tolerance.
-
Hedging Tools: Stablecoin allocation for liquidity management, options strategies for downside protection, and cross-asset portfolio diversification to mitigate concentration risk.
V. Potential Risk Comparison
Market Risk
-
VTHO: Price volatility influenced by VeChain network adoption rates, enterprise partnership developments, and the dual-token economic model dynamics. Trading volume concentration and liquidity constraints may amplify price movements during market stress.
-
XLM: Market performance correlates with payment sector adoption trends, competitive positioning against alternative payment solutions, and broader cryptocurrency market cycles. Regulatory developments affecting payment tokens create additional uncertainty.
Technology Risk
-
VTHO: Network scalability dependent on VeChainThor blockchain performance, smart contract execution stability, and the balance between VTHO generation and consumption rates affecting token economics.
-
XLM: Protocol upgrade requirements, consensus mechanism reliability, and network capacity to handle increasing transaction volumes as adoption scales.
Regulatory Risk
- Global regulatory frameworks affecting payment tokens and utility tokens differ significantly. XLM faces scrutiny as a payment-focused asset under evolving financial regulations, while VTHO operates within enterprise blockchain contexts subject to different compliance requirements. Both assets remain subject to broader cryptocurrency regulatory developments across jurisdictions.
VI. Conclusion: Which Is the Better Buy?
📌 Investment Value Summary:
-
VTHO Advantages: Dual-token economic model providing passive generation mechanics, positioning within enterprise blockchain adoption, and utility-driven demand from supply chain applications. Lower entry price point for accumulation strategies.
-
XLM Advantages: Established presence in cross-border payment infrastructure, partnerships with recognized financial technology platforms, higher trading liquidity, and broader market recognition supporting price stability.
✅ Investment Recommendations:
-
Novice Investors: Consider XLM for initial exposure given higher liquidity, established market position, and clearer use case understanding. Start with smaller allocations and prioritize risk management through portfolio diversification.
-
Experienced Investors: Evaluate both assets based on portfolio objectives. XLM offers payment infrastructure exposure, while VTHO provides access to enterprise blockchain utility with unique generation mechanics. Consider balanced allocation with regular rebalancing.
-
Institutional Investors: Assess both assets within broader blockchain investment frameworks. XLM aligns with payment technology mandates, while VTHO fits enterprise blockchain and supply chain digitalization themes. Conduct thorough due diligence on ecosystem development and adoption metrics.
⚠️ Risk Disclosure: Cryptocurrency markets exhibit high volatility. This analysis does not constitute investment advice. Conduct independent research and consult financial professionals before making investment decisions.
VII. FAQ
Q1: What is the fundamental difference between VTHO and XLM's utility models?
VTHO serves as a transaction cost token within VeChain's dual-token system, automatically generated by holding VET tokens at a rate of 0.000432 VTHO per VET daily, creating a continuous passive income mechanism. XLM functions as a bridge currency for cross-border payments and financial settlements, designed to facilitate rapid, low-cost transfers between banks, payment institutions, and individuals across global payment networks.
Q2: Which asset demonstrates stronger institutional adoption?
XLM shows stronger adoption in the payment sector through partnerships with MoneyGram and PayPal for real-time transaction processing. VTHO, as part of the VeChain ecosystem, demonstrates implementation in supply chain management with enterprise clients including Walmart China and PwC. The adoption profiles differ by sector—XLM focuses on financial technology infrastructure, while VTHO targets enterprise blockchain and supply chain verification applications.
Q3: How does VTHO's automatic generation mechanism affect its price dynamics?
The automatic generation mechanism creates continuous supply pressure as each VET token produces 0.000432 VTHO daily. This passive income feature attracts VET holders seeking yield, but the constant generation must be balanced by network consumption through transaction activities and smart contract executions. Price appreciation depends on demand growth from VeChain network usage outpacing the predictable supply increase from generation mechanics.
Q4: What are the liquidity differences between VTHO and XLM for active trading?
XLM demonstrates significantly higher trading liquidity with 24-hour volume of $742,949.38 compared to VTHO's $26,477.06 as of January 18, 2026. This substantial difference affects order execution, spread costs, and slippage risks. Active traders and institutional investors typically require higher liquidity profiles, positioning XLM as more suitable for frequent trading strategies and larger position sizes.
Q5: What are the key risk factors specific to each asset?
VTHO faces concentration risk tied to VeChain ecosystem adoption, dual-token economic balance between generation and consumption rates, and enterprise blockchain implementation timelines. XLM encounters regulatory uncertainty as a payment-focused token under evolving financial regulations, competitive pressure from alternative payment solutions, and dependency on cross-border transaction volume growth for sustained demand.
Q6: How do the 2031 price projections compare in percentage terms?
Based on current prices ($0.0008713 for VTHO and $0.23603 for XLM), the optimistic 2031 projections suggest VTHO could reach $0.001752 (approximately 101% increase) while XLM could reach $0.554 (approximately 135% increase). However, these projections carry significant uncertainty and depend on ecosystem development, adoption rates, regulatory frameworks, and broader market conditions materializing favorably over the five-year period.
* The information is not intended to be and does not constitute financial advice or any other recommendation of any sort offered or endorsed by Gate.