This comprehensive analysis compares VVV and ARB, two prominent Arbitrum-based tokens in the DeFi ecosystem. VVV, launched in 2025, positions itself as a privacy-focused AI platform, while ARB, established in 2023, serves as an Ethereum scaling solution. The article evaluates both assets through multiple dimensions including historical price trends, market status, tokenomics, institutional adoption, and technical ecosystem development. With current prices at $3.0853 (VVV) and $0.2089 (ARB), the analysis provides price forecasts for 2026-2031, investment strategies tailored to different investor profiles, and detailed risk assessments. Whether you're a novice seeking emerging AI technology exposure or an experienced investor favoring established scaling solutions, this guide offers evidence-based insights to inform your investment decisions through comprehensive risk-return analysis and market positioning strategies.
Introduction: VVV and ARB Investment Comparison
In the cryptocurrency market, the comparison between VVV vs ARB has consistently been a topic that investors cannot overlook. The two differ significantly in market cap ranking, application scenarios, and price performance, representing distinct crypto asset positioning.
VVV (Venice Token): Launched in 2025, it has gained market recognition with its positioning as a privacy-focused AI platform that offers generated conversations and image creation services without storing user data.
ARB (Arbitrum): Since its launch in 2023, it has been recognized as an Ethereum scaling solution, being one of the crypto assets with substantial trading volume and market presence.
This article will comprehensively analyze the investment value comparison between VVV vs ARB through historical price trends, supply mechanisms, institutional adoption, technical ecosystem, and future predictions, attempting to answer the question that investors care about most:
"Which is the better buy right now?"
I. Price History Comparison and Market Status
VVV and ARB Historical Price Trends
- 2025: VVV launched in January 2025 at $16.08, experiencing significant volatility in its first year of trading.
- 2024: ARB reached its all-time high of $2.39 in January 2024, followed by a sustained downward trend throughout the subsequent period.
- Comparative Analysis: During the recent market cycle, VVV declined from its all-time high of $20.825 (recorded in January 2025) to a low of $0.915 (recorded in November 2025), while ARB decreased from $2.39 to its all-time low of $0.172637 (recorded in December 2025).
Current Market Status (2026-01-16)
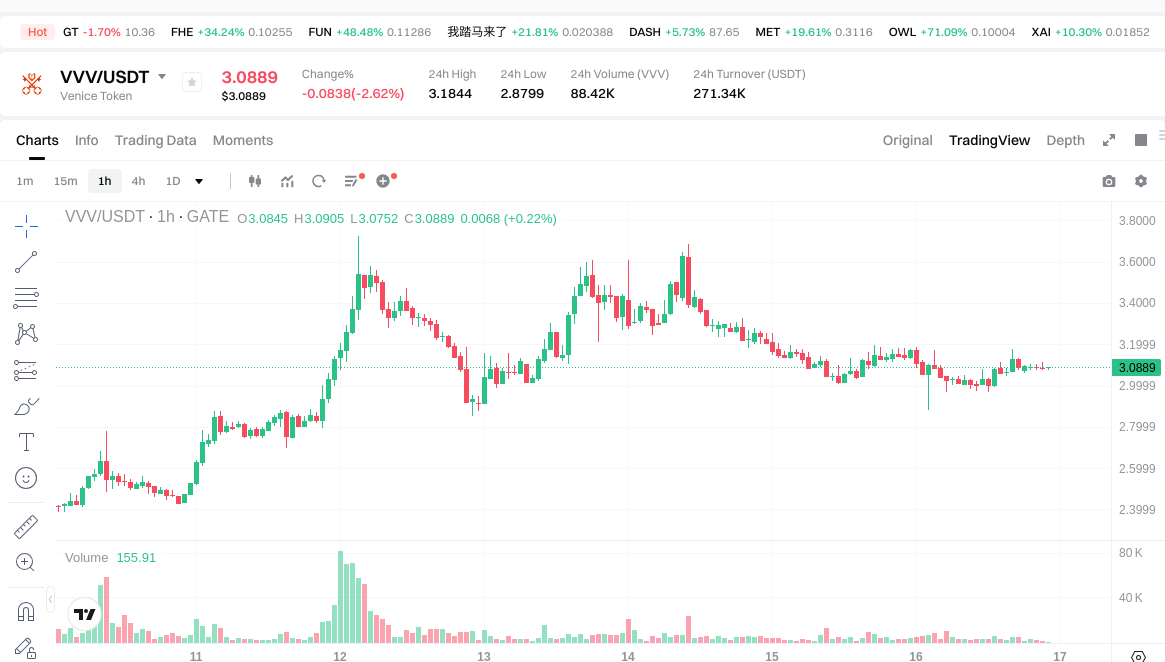
- VVV Current Price: $3.0853
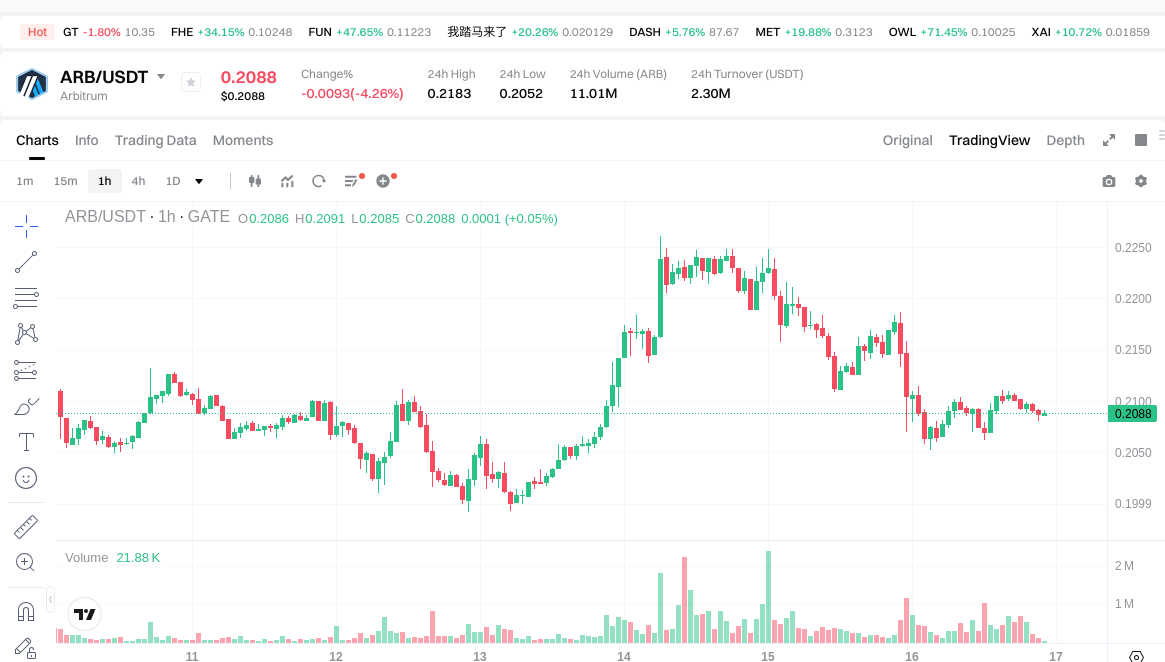
- ARB Current Price: $0.2089
- 24-Hour Trading Volume: VVV $272,541.68 vs ARB $2,310,755.31
- Market Sentiment Index (Fear & Greed Index): 49 (Neutral)
Click to view real-time prices:
II. Core Factors Influencing VVV vs ARB Investment Value
Supply Mechanism Comparison (Tokenomics)
- VVV: Supply mechanism details are not available in the reference materials.
- ARB: Supply mechanism details are not available in the reference materials.
- 📌 Historical Pattern: Supply mechanisms can drive price cycle changes through scarcity dynamics and emission schedules, though specific historical data for these assets is not provided.
Institutional Adoption and Market Application
- Institutional Holdings: Reference materials indicate that certain wallets hold approximately $100,000 worth of VVV, though comprehensive institutional positioning data for comparison is not available.
- Enterprise Adoption: Specific applications in cross-border payments, settlements, or investment portfolios for VVV and ARB are not documented in the provided materials.
- National Policies: Regulatory attitudes toward these specific assets across different jurisdictions are not detailed in the reference materials.
Technology Development and Ecosystem Building
- VVV Technology Upgrades: Specific technical developments and their potential impacts are not documented in the available materials.
- ARB Technology Development: Technical evolution details and implications are not available in the reference materials.
- Ecosystem Comparison: DeFi, NFT, payment systems, and smart contract implementation status for both assets are not comprehensively covered in the provided sources.
Macroeconomic Environment and Market Cycles
- Performance in Inflationary Environments: The reference materials mention expectations around fiscal policy, monetary policy direction, and core investment themes providing clarity for market positioning, though specific anti-inflation characteristics of either asset are not detailed.
- Macroeconomic Monetary Policy: The materials reference monetary policy trends affecting market conditions, though direct impacts on VVV and ARB specifically are not documented.
- Geopolitical Factors: Cross-border transaction demand and international developments may influence market dynamics, though specific effects on these assets are not elaborated in the available materials.
III. 2026-2031 Price Forecast: VVV vs ARB
Short-term Forecast (2026)
- VVV: Conservative $2.59-$3.09 | Optimistic $3.09-$4.05
- ARB: Conservative $0.13-$0.21 | Optimistic $0.21-$0.29
Mid-term Forecast (2028-2029)
- VVV may enter a growth phase with projected price range of $3.27-$6.26
- ARB may enter an expansion phase with projected price range of $0.19-$0.46
- Key drivers: institutional capital inflows, ETF developments, ecosystem expansion
Long-term Forecast (2030-2031)
- VVV: Baseline scenario $4.14-$5.45 | Optimistic scenario $5.77-$7.01
- ARB: Baseline scenario $0.30-$0.39 | Optimistic scenario $0.44-$0.60
View detailed price predictions for VVV and ARB
Disclaimer
VVV:
| Year |
Predicted High Price |
Predicted Average Price |
Predicted Low Price |
Price Change |
| 2026 |
4.046459 |
3.0889 |
2.594676 |
0 |
| 2027 |
4.49527617 |
3.5676795 |
1.99790052 |
15 |
| 2028 |
5.2409211855 |
4.031477835 |
3.26549704635 |
30 |
| 2029 |
6.2588693388375 |
4.63619951025 |
4.45075152984 |
50 |
| 2030 |
5.774386490016375 |
5.44753442454375 |
4.14012616265325 |
76 |
| 2031 |
7.013700571600078 |
5.610960457280062 |
4.993754806979255 |
81 |
ARB:
| Year |
Predicted High Price |
Predicted Average Price |
Predicted Low Price |
Price Change |
| 2026 |
0.294408 |
0.2088 |
0.129456 |
0 |
| 2027 |
0.28179648 |
0.251604 |
0.21134736 |
20 |
| 2028 |
0.386715348 |
0.26670024 |
0.1893571704 |
27 |
| 2029 |
0.46065798954 |
0.326707794 |
0.22542837786 |
56 |
| 2030 |
0.4409248387824 |
0.39368289177 |
0.3621882604284 |
88 |
| 2031 |
0.600917565997728 |
0.4173038652762 |
0.300458782998864 |
99 |
IV. Investment Strategy Comparison: VVV vs ARB
Long-term vs Short-term Investment Strategies
- VVV: May suit investors interested in emerging privacy-focused AI platform applications and willing to accept higher volatility in exchange for potential growth opportunities in nascent technology sectors.
- ARB: May suit investors seeking exposure to established Ethereum scaling solutions with demonstrated market presence and trading liquidity across multiple exchanges.
Risk Management and Asset Allocation
- Conservative Investors: VVV 30% vs ARB 70% - Allocation favoring the more established asset with greater trading volume and market history.
- Aggressive Investors: VVV 60% vs ARB 40% - Higher allocation to the newer asset with potential growth trajectory, balanced by exposure to the scaling solution market.
- Hedging Tools: Stablecoin reserves for volatility management, diversification across multiple crypto assets, systematic rebalancing protocols.
V. Potential Risk Comparison
Market Risks
- VVV: Exhibits substantial price volatility, having experienced fluctuations from $20.825 to $0.915 within its first year of trading. Limited trading volume of $272,541.68 may contribute to price instability and liquidity constraints.
- ARB: Demonstrated significant price movement from $2.39 to $0.172637, reflecting broader market cycle impacts. Higher trading volume of $2,310,755.31 provides relatively improved liquidity compared to VVV.
Technical Risks
- VVV: Specific technical infrastructure details, scalability characteristics, and network stability metrics are not documented in available materials, presenting information uncertainty for technical assessment.
- ARB: Technical implementation details, network performance parameters, and potential vulnerability assessments are not comprehensively covered in the reference materials.
Regulatory Risks
- Evolving global regulatory frameworks may impact both assets differently based on their respective use cases - privacy-focused AI platforms versus blockchain scaling solutions. Specific jurisdictional policies and compliance requirements remain subject to ongoing regulatory developments across different markets.
VI. Conclusion: Which Is the Better Buy?
📌 Investment Value Summary:
- VVV Characteristics: Represents exposure to privacy-focused AI platform sector, launched in 2025 with current price of $3.0853. Price projections suggest potential ranges of $2.59-$4.05 (2026) extending to $4.14-$7.01 (2030-2031) under various scenarios.
- ARB Characteristics: Represents exposure to Ethereum scaling solution market, established in 2023 with current price of $0.2089. Price projections indicate potential ranges of $0.13-$0.29 (2026) extending to $0.30-$0.60 (2030-2031) under different conditions.
✅ Investment Considerations:
- Novice Investors: Consider beginning with smaller position sizes in either asset, prioritizing comprehensive understanding of underlying technology and market dynamics before increasing exposure. Dollar-cost averaging approaches may help manage volatility risks.
- Experienced Investors: May evaluate portfolio allocation based on risk tolerance, existing crypto holdings, and market cycle positioning. Diversification across multiple assets and regular portfolio rebalancing could be incorporated into strategy frameworks.
- Institutional Investors: Require comprehensive due diligence on technical infrastructure, regulatory compliance status, liquidity profiles, and custody solutions before establishing positions in either asset.
⚠️ Risk Disclosure: Cryptocurrency markets demonstrate extreme volatility characteristics. Price movements can be substantial and rapid in both directions. This content does not constitute investment advice, financial guidance, or recommendations to buy or sell any specific assets. Individuals should conduct independent research and consult qualified financial professionals before making investment decisions.
VII. FAQ
Q1: What is the fundamental difference between VVV and ARB?
VVV is a privacy-focused AI platform token launched in 2025 that provides conversation generation and image creation services without storing user data, while ARB is an Ethereum scaling solution token launched in 2023 designed to improve transaction speed and reduce costs on the Ethereum network. The key distinction lies in their core use cases: VVV operates in the AI privacy technology sector, whereas ARB functions as blockchain infrastructure for scaling decentralized applications. This fundamental difference in application scenarios directly influences their market positioning, adoption patterns, and potential growth trajectories.
Q2: Which asset demonstrates higher liquidity for trading?
ARB exhibits significantly higher liquidity with a 24-hour trading volume of $2,310,755.31 compared to VVV's $272,541.68 as of January 16, 2026. This approximately 8.5x difference in trading volume means ARB provides better order execution, reduced slippage, and easier entry/exit positions for investors. Higher liquidity also typically indicates broader market acceptance and accessibility across multiple exchanges, making ARB potentially more suitable for investors who prioritize trading flexibility and position management capabilities.
Q3: How have these assets performed since their respective launches?
VVV launched in January 2025 at $16.08 and experienced extreme volatility in its first year, reaching an all-time high of $20.825 before declining to a low of $0.915 by November 2025, currently trading at $3.0853. ARB peaked at $2.39 in January 2024 following its 2023 launch, then declined to an all-time low of $0.172637 in December 2025, currently priced at $0.2089. Both assets have demonstrated substantial price corrections from their peaks, reflecting broader cryptocurrency market cycles and sector-specific dynamics affecting newer tokens and scaling solutions.
Q4: What are the projected price ranges for 2026?
For 2026, price forecasts suggest VVV may trade within a conservative range of $2.59-$3.09 or an optimistic range of $3.09-$4.05, while ARB projections indicate a conservative range of $0.13-$0.21 or an optimistic range of $0.21-$0.29. These predictions reflect different growth potential based on varying adoption scenarios, market conditions, and sector-specific developments. VVV's projections suggest higher absolute price targets relative to its current value, though investors should note that price predictions carry inherent uncertainty and depend on multiple market variables including institutional adoption, technological advancement, and macroeconomic conditions.
Q5: What portfolio allocation approach should investors consider?
Conservative investors might consider a 30% VVV and 70% ARB allocation, favoring the more established asset with greater trading volume and market history. Aggressive investors could explore a 60% VVV and 40% ARB split, accepting higher exposure to the newer AI platform sector in exchange for potential growth opportunities. These allocation suggestions should be adjusted based on individual risk tolerance, existing portfolio composition, investment timeframe, and market cycle positioning. Regardless of allocation strategy, implementing hedging tools such as stablecoin reserves, diversification across multiple crypto assets, and systematic rebalancing protocols can help manage volatility risks inherent in cryptocurrency investments.
Q6: What are the primary risks associated with each asset?
VVV's primary risks include substantial price volatility (having fluctuated from $20.825 to $0.915 in its first year), limited trading volume contributing to liquidity constraints, and uncertainty regarding technical infrastructure details. ARB faces risks from significant price movements reflecting broader market cycles, potential technical implementation challenges associated with scaling solutions, and competitive pressures from alternative Layer 2 technologies. Both assets are subject to evolving regulatory frameworks that may impact operations differently based on their respective use cases—privacy-focused AI platforms versus blockchain scaling solutions—with compliance requirements varying across different jurisdictions.
Q7: How do macroeconomic factors influence these assets?
Macroeconomic factors such as monetary policy direction, inflationary environments, and geopolitical developments can significantly impact both VVV and ARB through multiple channels. Fiscal and monetary policy clarity provides framework for market positioning and institutional capital allocation decisions. Market cycles influenced by broader economic conditions affect investor risk appetite, which directly impacts cryptocurrency valuations and trading activity. Cross-border transaction demand and international developments may create varying adoption pressures for different cryptocurrency use cases. However, specific anti-inflation characteristics and macroeconomic correlations for these particular assets require further analysis as their market histories develop over time.
Q8: Is technical analysis sufficient for making investment decisions?
Technical analysis alone is insufficient for comprehensive investment decisions regarding VVV and ARB. Effective evaluation requires integrating multiple analytical dimensions: fundamental analysis of underlying technology and use cases, supply mechanism assessment (tokenomics), institutional adoption trends, ecosystem development progress, regulatory landscape evolution, and macroeconomic context. Price history and trading patterns provide valuable insights into market sentiment and potential support/resistance levels, but should be combined with thorough due diligence on technical infrastructure, competitive positioning, and long-term viability. Investors should conduct independent research, consider consulting qualified financial professionals, and recognize that cryptocurrency markets demonstrate extreme volatility characteristics with substantial risks in both directions.
* The information is not intended to be and does not constitute financial advice or any other recommendation of any sort offered or endorsed by Gate.