Master the Bearish Harami candlestick pattern, a powerful technical analysis tool for identifying potential downtrend reversals in cryptocurrency markets. This comprehensive guide explains how this two-candle formation—featuring a large bullish candle followed by a smaller bearish candle—signals weakening buying pressure and emerging selling momentum. Learn to confirm reversals through subsequent candlestick analysis, distinguish between Bearish Harami and Harami Cross variations, and integrate this pattern with volume analysis and risk management strategies. Whether trading on Gate or analyzing price action, understand how Bearish Harami patterns help traders time market exits, enter short positions, and protect capital. Discover why combining technical patterns with fundamental analysis and macroeconomic awareness creates a robust trading framework that maximizes profitability while minimizing false signals and market risks.
Summary
The Harami candlestick pattern serves as a powerful technical analysis tool for identifying potential trend reversals in financial markets. This pattern consists of two distinct candlesticks that signal a shift in market momentum. A Bullish Harami Candlestick forms when a large bearish candlestick is followed by a smaller bullish candlestick contained within the first candle's range, suggesting a potential upward reversal. Conversely, a Bearish Harami Candlestick appears when a large bullish candlestick is followed by a smaller bearish candlestick within its range, indicating a possible downward trend reversal. Understanding these patterns enables traders to make more informed decisions about market entry and exit points.
What Is a Harami Candlestick?
Harami candlesticks represent a significant candlestick pattern in technical analysis, derived from the Japanese word "harami" meaning "pregnant," which aptly describes the visual appearance of this formation. This pattern has been utilized by traders for centuries, originating from Japanese rice traders in the 18th century who developed candlestick charting techniques.
The Harami candlestick pattern functions as a reversal indicator, providing valuable insights into potential changes in market direction. Traders and investors rely on this pattern when making critical decisions about cryptocurrency buying or selling positions, as it can signal the exhaustion of the current trend and the beginning of a new one.
The formation of a Harami candlestick pattern occurs when the real body of one candlestick is completely engulfed by the real body of the previous candlestick. This unique configuration can manifest in either an uptrend or a downtrend, making it a versatile tool for various market conditions. The pattern's effectiveness lies in its ability to capture the shift in market sentiment from one direction to another.
To accurately identify a Harami candlestick pattern, traders must observe two critical characteristics. First, the second candlestick must be noticeably smaller than the first candlestick, indicating a reduction in market momentum. Second, the second candlestick's real body must be entirely contained within the first candlestick's real body, creating the distinctive "pregnant" appearance. These criteria ensure that the pattern represents a genuine pause or potential reversal in the prevailing trend rather than normal market fluctuation.
How to Confirm Trend Reversal With Harami Candlesticks
Identifying a potential Harami candlestick pattern is only the first step in the trading process. To increase the probability of a successful trade, confirmation of the trend reversal becomes essential. This confirmation process helps traders avoid false signals and reduces the risk of entering positions prematurely.
The most reliable method for confirming a Harami pattern involves waiting for the subsequent candlestick to close. This additional candlestick provides crucial information about whether the market has truly reversed direction or if the Harami pattern was merely a temporary pause in the existing trend. Patience during this confirmation phase can significantly improve trading outcomes.
When the candlestick following a Bullish Harami pattern closes as a bullish candlestick, it confirms that the market has reversed from a downtrend to an uptrend. This confirmation suggests that buying pressure has overcome selling pressure, and the market is likely to continue moving higher. Traders often interpret this as a strong signal to enter long positions or add to existing bullish positions.
Alternatively, if the candlestick following a Bearish Harami pattern closes as a bearish candlestick, it confirms that the market has reversed from an uptrend to a downtrend. This confirmation indicates that selling pressure has overtaken buying pressure, and the market may continue declining. In such cases, traders might consider entering short positions or exiting long positions to protect their capital.
It is worth noting that volume analysis can provide additional confirmation for Harami patterns. Higher volume during the formation of the second candlestick and the confirmation candlestick suggests stronger conviction in the reversal, making the signal more reliable.
Bullish Harami Candlestick Pattern
The Bullish Harami Candlestick pattern represents a potential shift from bearish to bullish momentum, offering traders an opportunity to capitalize on upward price movements. This pattern typically emerges after a sustained downtrend, when selling pressure begins to weaken and buyers start entering the market.
The formation of a Bullish Harami begins with a large bearish candlestick that reflects strong selling pressure and continued downward momentum. This first candlestick demonstrates that bears remain in control of the market. However, the subsequent smaller bullish candlestick, with an opening price within the range of the previous candle's body, signals that the selling pressure is diminishing and buyers are beginning to assert themselves.
Bullish Harami patterns can exhibit either short or long tails (shadows), with each variation providing additional information about market dynamics. Patterns with longer lower shadows suggest that sellers attempted to push prices lower but were ultimately rejected by buyers, indicating strong support at those levels. The reliability of Bullish Harami patterns increases significantly when they appear in oversold market conditions, as identified by technical indicators such as the Relative Strength Index (RSI) or Stochastic Oscillator.
While not every Bullish Harami pattern results in substantial price movements, traders frequently use this pattern as a signal to enter long positions. When combined with other technical analysis tools, such as support levels, moving averages, or momentum indicators, the Bullish Harami pattern can provide a robust framework for identifying profitable trading opportunities. Risk management remains crucial, and traders should always implement stop-loss orders below the low of the Harami pattern to protect against false breakouts.
Bearish Harami Candlestick Pattern
The Bearish Harami Candlestick pattern signals a potential reversal from bullish to bearish momentum, alerting traders to possible downward price movements. This pattern typically appears after an extended uptrend, when buying pressure begins to fade and sellers start entering the market.
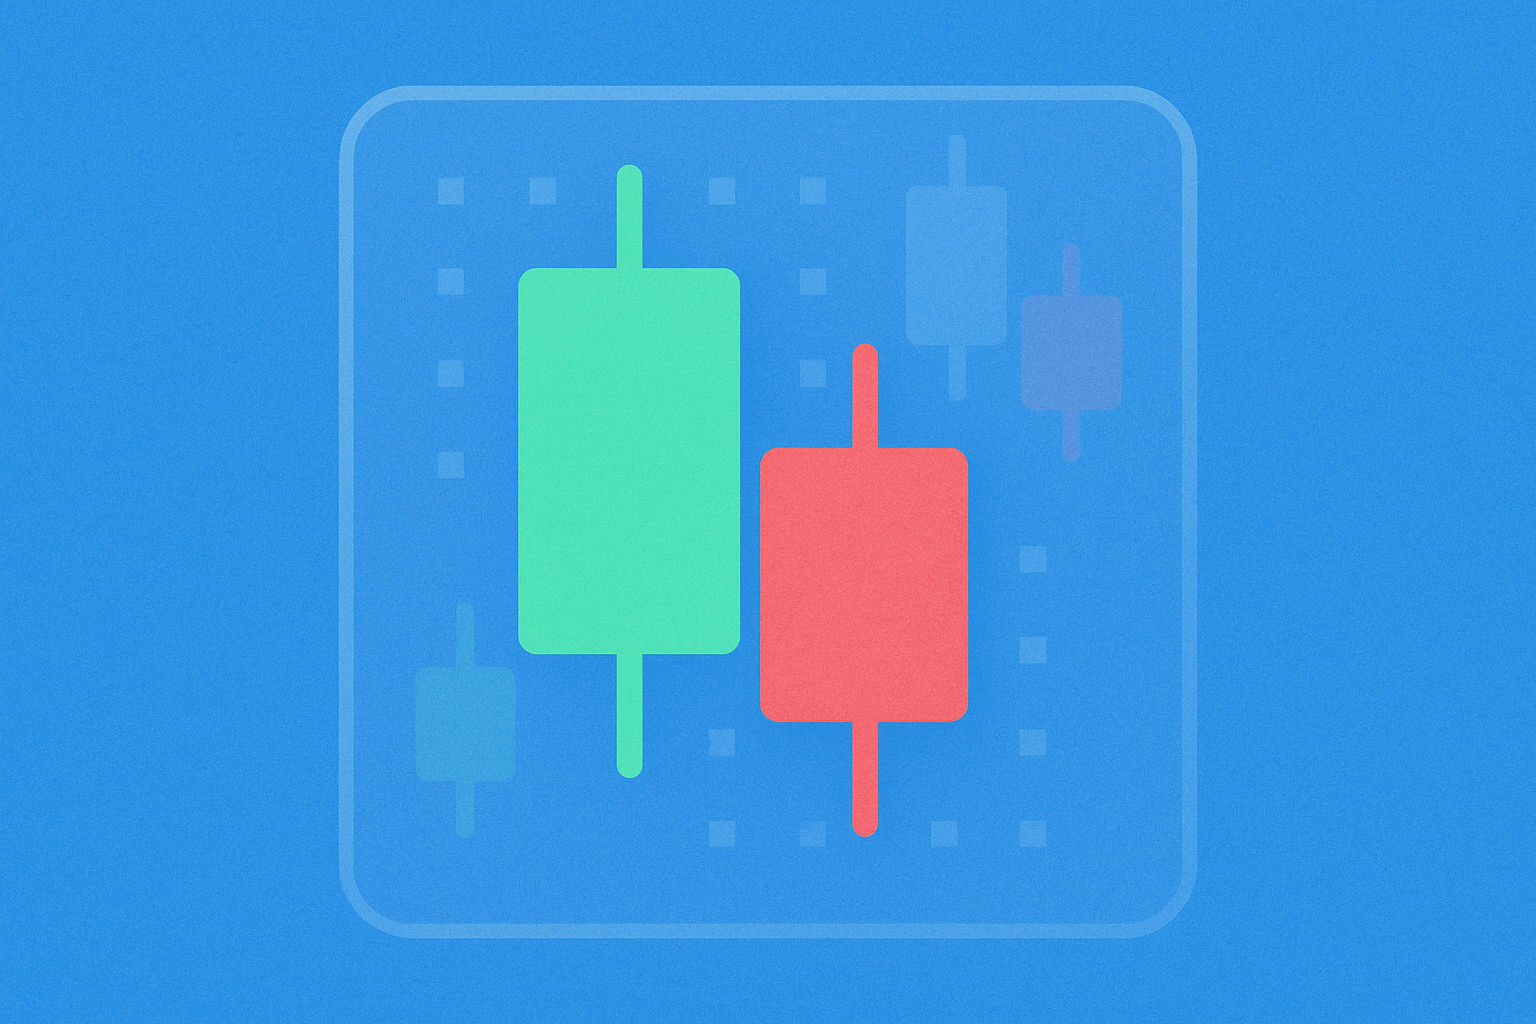
A Bearish Harami forms when the first candlestick is a long bullish candle, demonstrating strong buying pressure and continued upward momentum. This initial candlestick shows that bulls maintain control of the market. However, the second candlestick—a small bearish candle that forms within the body of the first candle—indicates that buying pressure is weakening and sellers are beginning to challenge the prevailing trend.
This pattern is considered bearish because it demonstrates that bulls have lost their dominance and bears are starting to take control of the market. The smaller size of the second candlestick reflects indecision and a potential exhaustion of the upward momentum. While the Bearish Harami may not be as immediately reliable as some other candlestick patterns, such as the Engulfing pattern or the Evening Star, it still serves as a valuable tool for identifying potential reversals in uptrends.
Similar to the Bullish Harami pattern, confirmation is essential when trading Bearish Harami patterns. After identifying this formation, traders should wait for the next candlestick to close. Ideally, this confirmation candlestick will be bearish, appearing immediately after the Bearish Harami pattern. When this confirmation occurs, it generates a sell signal that may prompt investors to exit long positions or consider entering short positions. Prudent traders will also consider placing stop-loss orders above the high of the Harami pattern to manage risk effectively.
What Is a Harami Cross Candlestick?
The Harami Cross represents a specialized variation of the standard Harami pattern, characterized by a very small real body in the second candlestick that resembles a Doji. This distinctive feature is crucial for qualifying as a Harami Cross—the smaller the real body, the more significant the pattern becomes. The minimal size of the second candlestick's body indicates extreme indecision in the market and suggests that the balance between buyers and sellers has reached a critical equilibrium point.
The absence of a substantial real body following a strong directional move serves as a powerful signal that the previous trend is approaching exhaustion and a reversal may be imminent. This indecision reflects a moment when neither buyers nor sellers can establish clear dominance, often marking a turning point in market sentiment.
The Harami Cross pattern, like the regular Harami pattern, functions as a candlestick formation that can signal either a Bullish or Bearish trend reversal depending on its position within the broader chart context. The key difference between the Harami Cross and the standard Harami pattern lies in the second candlestick's appearance—while a regular Harami features a small but visible real body, the Harami Cross displays an almost non-existent real body, similar to a Doji candlestick.
Many experienced traders assign greater importance to the Harami Cross candlestick pattern compared to the regular Harami pattern due to its stronger indication of market indecision and potential reversal. The Doji-like appearance of the second candlestick suggests that the market has reached a critical juncture where the previous trend's momentum has completely stalled. Just as with normal Harami patterns, there are two distinct types of Harami Cross patterns—Bullish and Bearish—each with specific characteristics and implications for trading decisions.
Four Bullish Harami Cross Signs
The Bullish Harami Cross typically appears during a downward trend, serving as an early warning signal that the bearish momentum may be weakening. This pattern indicates that the market trend is transitioning from a downward trajectory to either a neutral consolidation phase or an upward trend, presenting potential buying opportunities for traders.
The first candlestick in a Bullish Harami Cross is characterized by a strong red body, meaning the bearish candle is distinctively large and demonstrates significant selling pressure. This large red candlestick confirms that bears were firmly in control during that trading period, pushing prices substantially lower.
The second candlestick resembles a green Bullish Doji, shaped like a cross due to the opening and closing prices occurring at nearly the same level. This cross-shaped formation is entirely contained within the red candle that precedes it and does not extend beyond its range. The Doji appearance signals that sellers have exhausted their momentum and buyers are beginning to enter the market, creating a balance that could shift in favor of bulls.
The significance of the Bullish Harami Cross lies in its ability to capture the precise moment when market sentiment shifts from bearish to potentially bullish, making it a valuable pattern for timing market entries.
Four Bearish Harami Cross Signs
The Bearish Harami Cross typically appears during an upward trend, functioning as a warning signal that bullish momentum may be diminishing. This pattern suggests that the market trend is shifting from an upward trajectory to either a neutral consolidation phase or a downward trend, alerting traders to potential selling opportunities or the need to protect existing long positions.
The first candlestick in a Bearish Harami Cross features a strong green body, indicating that the bullish candle is distinctively large and reflects substantial buying pressure. This large green candlestick confirms that bulls maintained firm control during that trading period, driving prices significantly higher.
The second candlestick resembles a red Bearish Doji, characterized by its cross-like shape resulting from the opening and closing prices occurring at approximately the same level. This cross-shaped formation is completely contained within the green candle that precedes it and remains within its range. The Doji formation indicates that buyers have lost their momentum and sellers are entering the market, creating a balance that could shift in favor of bears.
The Bearish Harami Cross is particularly significant because it captures the exact moment when market sentiment transitions from bullish to potentially bearish, providing traders with valuable timing information for exits or short entries.
Conclusion
While Harami candlestick patterns provide valuable insights into potential market reversals, traders must exercise caution and avoid making buying or selling decisions based solely on these patterns. Successful trading requires a comprehensive approach that incorporates multiple analytical perspectives and information sources.
Traders should carefully examine previous trends to understand the broader market context in which the Harami pattern appears. A Harami pattern emerging after an extended trend carries more significance than one appearing during a consolidation phase. Additionally, analyzing price action surrounding the pattern, including support and resistance levels, can provide crucial confirmation or contradiction of the reversal signal.
Project-specific developments and news play a vital role in cryptocurrency markets, where fundamental factors can quickly override technical signals. Major announcements, partnerships, regulatory changes, or technological upgrades can significantly impact price movements regardless of candlestick patterns. Therefore, staying informed about project developments is essential for making well-rounded trading decisions.
Understanding the larger macroeconomic environment is equally important, as broader market conditions influence individual asset performance. Factors such as overall market sentiment, regulatory developments, institutional adoption, and global economic conditions can all affect the reliability of technical patterns like the Harami candlestick.
Without integrating these additional layers of analysis—historical trends, price action, fundamental developments, and macroeconomic factors—relying solely on Harami patterns to establish trading positions becomes excessively risky. Successful traders combine technical analysis with fundamental research and risk management strategies to create a robust trading framework. This comprehensive approach helps minimize false signals and increases the probability of profitable trades while protecting capital during unfavorable market conditions.
FAQ
What are Bullish Harami and Bearish Harami candlesticks?
Bullish Harami is a two-candle pattern signaling uptrend reversal after downtrend, with a larger first candle followed by a smaller second candle inside it. Bearish Harami mirrors this in uptrends, suggesting potential downward reversal, also forming two candles with contrasting sizes.
How to identify and distinguish between bullish and bearish harami candlestick patterns?
Bullish harami features a small body candlestick following a larger down candle, suggesting upward reversal. Bearish harami shows a small body after a larger up candle, indicating downward reversal. Key difference: bullish appears at support levels, bearish at resistance levels.
How to use Harami candlestick patterns for buy and sell decisions in trading?
Harami patterns signal potential reversals when a smaller candle forms within a larger one, indicating market indecision. Use bullish Harami for buy signals and bearish Harami for sell signals, but combine with volume, RSI, and moving averages for confirmation.
What is the difference between Harami patterns and other candlestick patterns such as Engulfing and Doji?
Harami has a smaller real body contained within the previous candle's range, showing indecision. Engulfing completely surrounds the prior candle, signaling reversal strength. Doji has minimal or no real body, indicating market equilibrium. Harami suggests potential reversal but requires confirmation.
What is the reliability and success rate of Harami candlestick patterns?
Harami patterns show moderate reliability with success rates dependent on market conditions and confirmation signals. They work best combined with additional technical analysis tools and volume confirmation. Success rate typically ranges from 50-60%, requiring careful risk management.
* The information is not intended to be and does not constitute financial advice or any other recommendation of any sort offered or endorsed by Gate.