This comprehensive guide explores Fibonacci retracement as a powerful technical analysis tool for cryptocurrency traders. Learn how to identify key Fibonacci levels (23.6%, 38.2%, 61.8%, 78.6%) to pinpoint potential support and resistance zones where Bitcoin and altcoins may reverse or consolidate. The article covers essential strategies including buying at support levels during uptrends and selling at resistance during downtrends, with practical examples using real price data. Discover how to set effective stop-loss and take-profit orders using the golden ratio (1.618) for optimal risk-reward ratios. Master the setup process on charting platforms like Gate, understand the advantages of mathematical precision, and learn the limitations of relying solely on Fibonacci levels. Enhance your trading accuracy by combining Fibonacci analysis with moving averages, RSI, and candlestick patterns for high-probability entry and exit opportunities.
Understanding Fibonacci Levels in Crypto Trading
Does cryptocurrency trading sometimes feel like guesswork? Given the notorious volatility of various coins and tokens, predicting future price movements can be quite challenging. This is where technical analysis (TA) comes to the rescue. It's a convenient approach because TA uses historical price data and various indicators to identify potential trading opportunities.
Fibonacci levels are a technical indicator that helps crypto traders assess situations where prices might continue rising or become stable after significant movements. In this comprehensive guide, we'll explore what makes Fibonacci levels attractive to traders and how they are effectively used in cryptocurrency trading strategies.
What Are Fibonacci Levels
Fibonacci levels represent a popular technical analysis tool widely used in cryptocurrency trading. They involve identifying key price levels based on the Fibonacci sequence, which can serve as potential support and resistance zones. These zones can indicate areas where the price might rise or encounter selling pressure, helping traders make informed decisions before executing trades.
The beauty of Fibonacci levels lies in their mathematical foundation and widespread recognition among traders. When many market participants watch the same levels, they can become self-fulfilling prophecies, as traders collectively react to price movements near these key zones. This makes Fibonacci retracement a valuable addition to any trader's technical analysis toolkit.
How Fibonacci Levels Work
The Fibonacci Sequence
The fundamental concept behind Fibonacci levels is the Fibonacci sequence itself. This is a mathematical sequence where each number represents the sum of the two preceding numbers. It starts with 0 and 1 and continues as follows:
0, 1, 1, 2, 3, 5, 8, 13, 21, 34, 55, 89...
The Fibonacci sequence is fascinating because it appears throughout nature, from the arrangement of leaves on a stem to spiral patterns in seashells. While some remain skeptical about how this sequence influences cryptocurrency trading, a careful examination of the ratios derived from the Fibonacci sequence reveals interesting patterns. When analyzing the ratio of two adjacent numbers in the sequence, certain values emerge consistently. For example:
- If you divide 13 by 8, you get 1.625 (approximately)
- The ratio 1.618 (often rounded to 1.62) is called the golden ratio or golden section
It is believed that Fibonacci number ratios (such as 0.236, 0.382, 0.5, and 1.618) significantly influence market behavior, including cryptocurrency prices. This mathematical relationship has been observed across various financial markets for decades, making it a time-tested tool for technical analysis.
The theory underlying Fibonacci levels suggests that after a strong price movement, there is a high probability that the price will retrace to a level corresponding to a key Fibonacci ratio before continuing its trend. This retracement behavior reflects natural market psychology, where traders take profits and new participants enter positions.
Key Fibonacci Ratios
The most commonly used Fibonacci levels in trading include:
- 0.236: This represents a 23.6% price retracement from the previous value. It's often the first level where minor pullbacks might find support or resistance.
- 0.382: A 38.2% price retracement level, considered a moderate correction zone where many traders look for entry opportunities.
- 0.500: The midpoint of the price movement, though not technically a Fibonacci ratio, it's widely watched as a psychological level.
- 0.618: A 61.8% price retracement level, often mentioned alongside the golden ratio (1.618) due to its potential significance. This is considered one of the strongest retracement levels.
- 0.786: A 78.6% price retracement level, representing a deep correction that often precedes trend reversals.
Additionally, traders sometimes use extension levels like 1.272, 1.618, and 2.618 to project potential price targets beyond the original price swing.
Setting Up Fibonacci Levels
After familiarizing yourself with the Fibonacci sequence and basic retracement levels, you can understand their application in your trading strategy. Most charting platforms offer a Fibonacci retracement tool. Here's a detailed description of the process:
1. Identify the Trend
First and foremost, you need to determine whether the overall trend of the coins or tokens you're interested in is upward or downward. This is crucial because Fibonacci levels are drawn differently depending on the trend direction. Look at higher timeframes to confirm the dominant trend, as this provides context for your analysis.
For uptrends, you'll be looking for potential buying opportunities on pullbacks. For downtrends, you'll be identifying potential selling opportunities on rallies. Understanding the broader market context helps you align your Fibonacci analysis with the prevailing momentum.
2. Select the Swing High and Swing Low Points
For an uptrend, the swing high (or peak) is the highest point before a price correction, and the swing low is the lowest point before the current upward trend began. These points should represent significant price extremes that are clearly visible on your chart.
For a downtrend, it's the opposite: the swing high (or peak) is the highest point before the price decline, and the swing low is the lowest point of the current downward trend. Selecting appropriate swing points is critical for accurate Fibonacci level placement.
When choosing these points, look for obvious peaks and troughs that represent meaningful price reversals. Avoid minor fluctuations and focus on significant price swings that capture the main trend movement.
Most charting platforms allow you to manually draw Fibonacci levels. To automatically plot Fibonacci levels on your chart, simply mark the swing high and swing low points using the tool. The platform will then automatically draw horizontal lines at the key Fibonacci ratios.
For an uptrend, you typically draw from the swing low to the swing high. For a downtrend, you draw from the swing high to the swing low. Different platforms may have slightly different procedures, so familiarize yourself with your specific charting software.
4. Identify Support and Resistance Levels
After setting up the Fibonacci retracement tool, horizontal lines will appear on your chart corresponding to the key Fibonacci ratios. These lines represent potential support zones in an uptrend and resistance zones in a downtrend.
Pay special attention to where multiple Fibonacci levels from different timeframes converge, as these confluence zones often provide stronger support or resistance. Also watch for areas where Fibonacci levels align with other technical indicators like moving averages or previous price action levels.
Trading Strategies with Fibonacci Levels
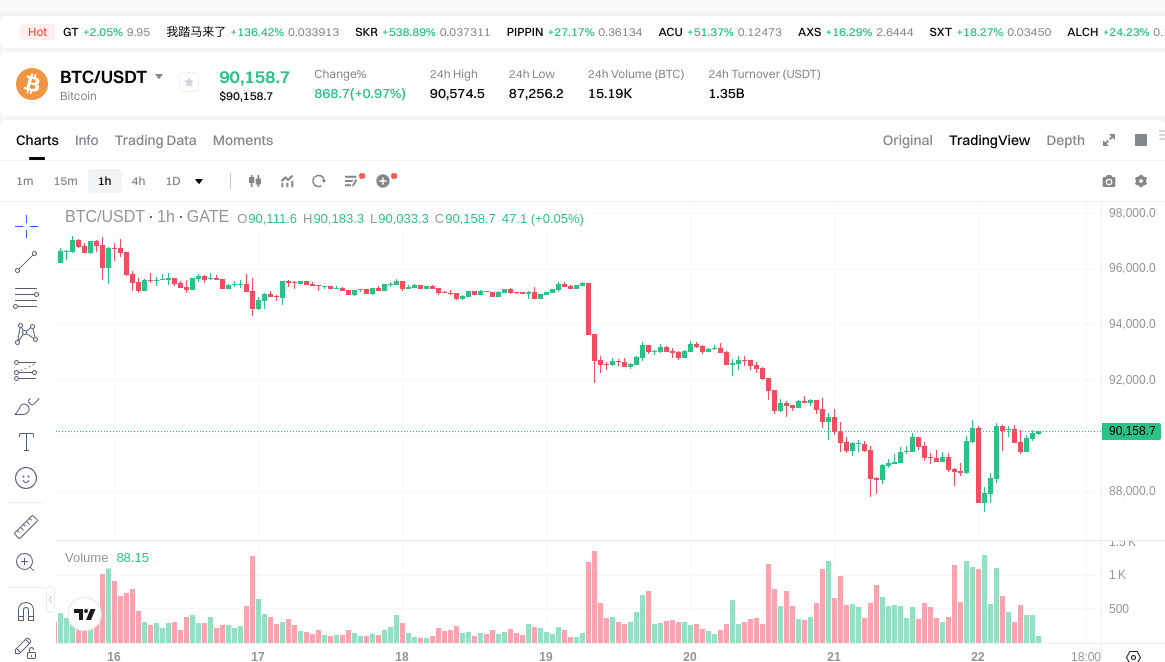
Below are several fundamental trading strategies that utilize Fibonacci levels. Let's consider an example of plotting Fibonacci levels on a Bitcoin price chart. First, we need to find the recent swing high and swing low points of Bitcoin's price. We'll use $73,787.10 and $56,555 as the maximum and minimum values. This provides multiple Bitcoin retracement levels that can be traded.
Buying at Support Levels
During an uptrend, if the price retraces to a key Fibonacci level (such as 0.382 or 0.618) and finds support, this can become a potential entry point for buying and opening a long position in anticipation of the uptrend continuing.
In this case, Bitcoin's key Fibonacci levels are at $63,137.70 and $67,204.40, corresponding to the 0.382 and 0.618 ratios respectively. These can serve as support zones where traders might consider opening long positions if the price bounces from these levels.
When buying at support levels, look for additional confirmation signals such as bullish candlestick patterns, increasing volume, or bullish divergence on momentum indicators. This multi-factor approach increases the probability of successful trades.
Selling at Resistance Levels
Conversely, during a downtrend, if the price rises but encounters resistance at a key Fibonacci level, this can signal an opportunity to sell the cryptocurrency, expecting the downtrend to continue.
In the example above, the 0.786 ratio could be a strong resistance zone for Bitcoin, as prices tend to bounce off this level. Traders with long positions might consider closing their positions at the Fibonacci level of $70,099.40 in anticipation of selling pressure.
Resistance level trading requires patience and discipline. Wait for price confirmation at these levels rather than anticipating the reversal too early. Look for bearish candlestick patterns or declining volume as the price approaches resistance.
Setting Take-Profit and Stop-Loss Orders
Like all types of technical analysis, these tools identify only probable, not certain outcomes. This is why it's essential to set stop-loss orders to limit potential losses when price movements don't align with your trading plan. Additionally, crypto traders can consider taking profits at predetermined levels based on their risk-reward ratio.
In our example, risk-tolerant traders should set a stop-loss order at $56,555, as this is Bitcoin's previous swing low. If volatility causes Bitcoin's price to break below the established minimum, the Fibonacci levels will no longer be relevant, and a new analysis will be needed.
Regarding take-profit levels, the 1.618 level is ideal for taking BTC profits. This golden ratio represents Bitcoin prices exceeding previous historical highs. Therefore, traders can set a take-profit limit order at $84,436.50.
A good risk-reward ratio to aim for is at least 1:2, meaning your potential profit should be at least twice your potential loss. This ensures that even with a lower win rate, your overall trading can remain profitable.
It's important to remember that Fibonacci levels are just one tool in a trader's arsenal. They should be used in combination with other technical indicators and fundamental analysis to create a more comprehensive trading strategy.
Advantages of Fibonacci Levels
Fibonacci levels are a popular technical analysis tool for identifying potential support and resistance levels in the market. Here's a brief overview of their advantages that make them so widely adopted.
Identifying Potential Support and Resistance Levels
Every trader knows about the difficulties of finding the right entry and exit points. This is doubly challenging due to price volatility. Fibonacci levels help traders clearly identify areas where the price might pause or reverse direction.
These levels provide objective reference points that remove some of the guesswork from trading. Instead of randomly choosing entry points, traders can focus on specific price zones that have mathematical and psychological significance.
Suitable for Different Timeframes and Markets
Fibonacci levels can be plotted according to trading requirements for both day traders and long-term investors. Swing high and swing low points can be applied to any market and timeframe, making this tool universally versatile.
Whether you're scalping on 5-minute charts or swing trading on daily charts, Fibonacci retracement works equally well. This adaptability makes it valuable for traders with different styles and time horizons. The principles remain consistent across all markets, from stocks to forex to cryptocurrencies.
Simplicity and Ease of Use
The concept of Fibonacci levels is quite straightforward. Even beginning crypto traders can understand it. Due to its accessibility, Fibonacci levels are popular among newcomers who are just learning technical analysis.
Most modern charting platforms have built-in Fibonacci tools that automatically calculate and draw the levels, requiring minimal manual effort. This user-friendly nature means traders can quickly incorporate Fibonacci analysis into their trading routine without extensive training.
Limitations of Fibonacci Levels
While Fibonacci levels are a useful tool, it's important to also be aware of their limitations and potential pitfalls.
Fibonacci Levels Are Not Infallible
If the price is near a Fibonacci level, this doesn't guarantee a reversal. Markets are complex mechanisms influenced by various factors including news events, regulatory changes, and macroeconomic conditions. For this reason, traders should use additional indicators to confirm the reversals suggested by Fibonacci levels.
Market sentiment, fundamental news, and unexpected events can easily override technical patterns. Always maintain realistic expectations and understand that no indicator provides certainty in trading.
Can Be Confusing with Multiple Levels
Beginning crypto traders don't always accurately navigate the abundance of Fibonacci levels. Prices can reach intermediate support or resistance lines at any of these levels, so it can be challenging for novices to determine the exact reversal point.
With five or more levels on a single chart, plus potential extension levels, the analysis can become cluttered and overwhelming. This is why experienced traders often focus on the most significant levels (0.382, 0.5, and 0.618) rather than trying to trade every single level.
Levels Are Subjective
The placement of Fibonacci levels can be subjective, as it depends on the chosen swing high and swing low points. Different traders have different calculation timeframes and trading plans, so they might miss potential entry and exit points or identify different levels altogether.
What one trader sees as a significant swing high might not be the same point another trader chooses. This subjectivity means that Fibonacci analysis should be combined with other objective indicators and price action analysis for better accuracy.
Combining Fibonacci Levels with Other Trading Indicators
To overcome these limitations, it's recommended to use Fibonacci levels in conjunction with other technical indicators. Let's discuss some effective combinations:
-
Moving Averages: Using 50-day and 200-day moving averages can help determine the overall trend. They not only show asset prices over a specific period but also form golden crosses and death crosses, which are powerful trend signals. When Fibonacci levels align with moving averages, the support or resistance becomes stronger.
-
Relative Strength Index (RSI): RSI helps assess whether a cryptocurrency is overbought (potential for correction) or oversold (potential for price increase). When RSI shows oversold conditions at a Fibonacci support level, it provides strong confirmation for a potential buying opportunity.
-
Support and Resistance Levels: Areas where Fibonacci levels converge with established support and resistance zones confirm that the asset is trading in accordance with the selected Fibonacci levels. These confluence zones often provide the highest probability trading setups.
-
Volume Analysis: Increasing volume at Fibonacci levels can confirm the significance of those levels. High volume at a Fibonacci support level suggests strong buying interest, while high volume at resistance indicates strong selling pressure.
-
Candlestick Patterns: Reversal candlestick patterns like hammer, shooting star, or engulfing patterns at Fibonacci levels provide additional confirmation for potential trades.
Use Fibonacci levels with other indicators and analyze price movements to create robust strategies and make informed decisions. The key is to look for confluence – multiple indicators pointing in the same direction – before executing trades.
Conclusion and Future Outlook
Fibonacci levels are a valuable tool for identifying potential support and resistance levels in cryptocurrency trading. By understanding the Fibonacci sequence, applying the retracement tool, and interpreting price changes, traders can gain useful insights into potential price movements.
However, it's crucial to remember that Fibonacci levels identify only probable, not certain outcomes. They should be used in combination with other technical indicators and fundamental analysis to create a comprehensive trading strategy. Mastering this and any other trading tool requires practice and experience.
As cryptocurrency markets continue to evolve and mature, the principles underlying Fibonacci analysis remain relevant. The mathematical relationships and psychological aspects that make Fibonacci levels effective are timeless. Whether you're a beginner or an experienced trader, incorporating Fibonacci retracement into your technical analysis toolkit can enhance your ability to identify high-probability trading opportunities.
Start by practicing on historical charts to see how prices have reacted to Fibonacci levels in the past. Then gradually incorporate this tool into your live trading with proper risk management. Over time, you'll develop an intuitive sense of how Fibonacci levels interact with price action in the crypto markets, making you a more confident and successful trader.
FAQ
What are Fibonacci sequences and golden ratios? How are they applied to trading?
Fibonacci sequences are mathematical patterns where each number equals the sum of two preceding ones. The golden ratio(1.618)derived from this sequence identifies key price levels in markets. Traders use Fibonacci retracements and extensions to predict support/resistance levels, determining optimal entry and exit points for maximizing trading returns.
How to use Fibonacci retracement levels in stock or cryptocurrency trading?
Identify key price swings, then apply Fibonacci ratios (23.6%, 38.2%, 50%, 61.8%, 78.6%) to find potential support and resistance levels. Enter long positions near 61.8% retracement during uptrends, or short near 38.2% during downtrends for optimal risk-reward entries.
What is the difference between Fibonacci extensions and Fibonacci retracements?
Fibonacci retracements identify support and resistance levels within a price pullback, typically between 0% and 100%. Fibonacci extensions project price targets beyond the recent swing high, extending past 100% to forecast potential future price levels where the trend may continue or face resistance.
Fibonacci levels are highly reliable for identifying key support and resistance zones. With accuracy rates between 70-80%, they effectively guide entry and exit points. Their reliability stems from widespread market adoption, making them an essential tool for technical traders seeking consistent profit opportunities.
How to calculate and plot Fibonacci support and resistance levels?
Identify swing high and low points on your chart. Measure the distance between them. Apply Fibonacci ratios (23.6%, 38.2%, 50%, 61.8%, 78.6%) to this distance from the swing point. These levels act as key support and resistance zones for price action trading.
What is the most important golden ratio in the Fibonacci sequence (0.618, 0.382, etc.)?
The 0.618 ratio, known as the golden ratio, is the most important Fibonacci level in trading. It represents the primary retracement level where price often finds support or resistance. The 0.382 level serves as a secondary retracement, while 1.618 extends beyond initial moves, helping traders identify key price targets and reversal zones.
What are the risks of trading with Fibonacci levels?
Fibonacci levels rely on historical price data and may not accurately predict future movements. Market volatility, unexpected news events, and false breakouts can invalidate signals. Overreliance on technical analysis without risk management increases losses. Support and resistance levels aren't guaranteed.
Combine Fibonacci levels with moving averages to confirm trend direction and support/resistance zones. Use RSI alongside Fibonacci to identify overbought/oversold conditions at key levels. When price bounces off Fibonacci levels during RSI extremes, it signals stronger trading opportunities. Layer these tools for enhanced entry and exit signals.
* The information is not intended to be and does not constitute financial advice or any other recommendation of any sort offered or endorsed by Gate.