A comprehensive analysis of the key features and trading strategies of the bull flag pattern in cryptocurrencies. Discover how to precisely identify flag formations, time your entries, and strengthen risk management approaches, leveraging technical analysis skills for steady profits on trading platforms like Gate.
Cryptocurrency K-Line Chart Patterns: What Is a Bull Flag? Key Features and Interpretation
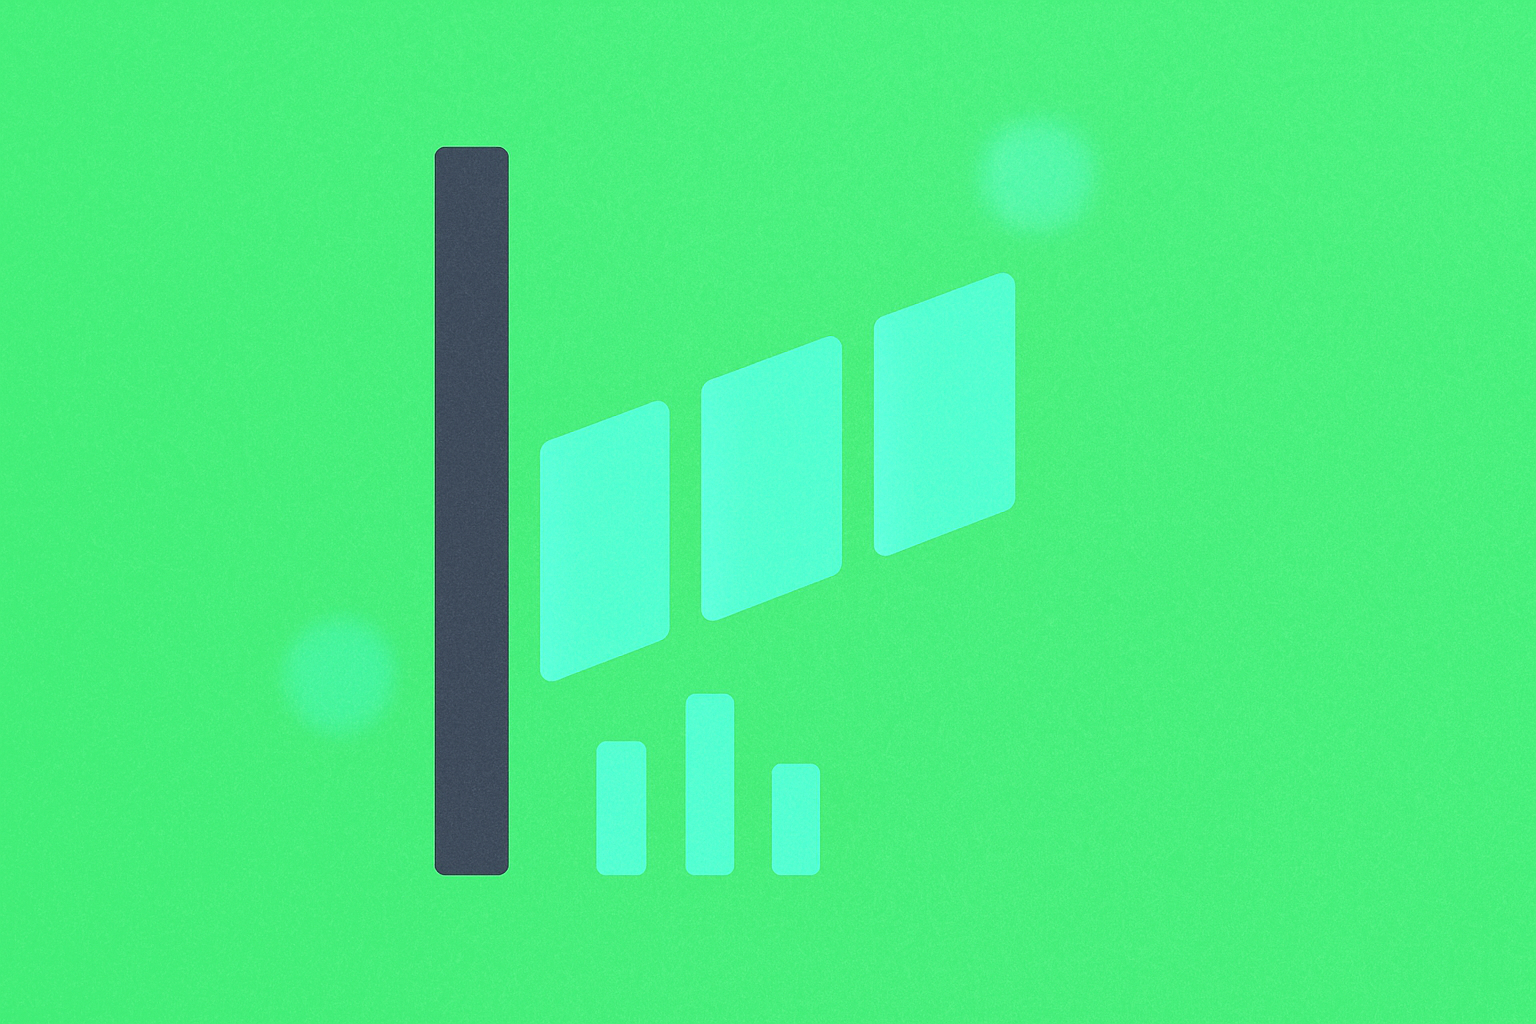
The bull flag pattern is a widely used technical chart formation, recognized as a continuation pattern that signals a temporary pause in an asset's upward trend before it resumes. This pattern's signature trait is a strong, rapid price surge (“flagpole”) followed by a consolidation period, forming a rectangular or flag-shaped price range.
During consolidation, prices typically drift lower or move sideways before the uptrend resumes. The bull flag is a clear bullish indicator, suggesting the asset is likely to sustain its upward momentum. As a result, traders prioritize this classic chart pattern when making investment decisions.
Grasping the bull flag pattern is essential for traders. It offers deep insights into market trends and helps identify potential trading opportunities. Accurately recognizing and reading bull flags gives traders a competitive edge and helps them make smarter decisions. Here are the core reasons why mastering the bull flag is crucial in live trading:
Spotting Bullish Continuation Signals
The bull flag strongly indicates that an asset may continue rising. Identifying this pattern enables traders to anticipate further bullish moves and adjust their strategies accordingly. This skill is particularly important for swing traders and trend followers, whose profits depend on capturing major market moves. In crypto markets, a bull flag often marks the beginning of a new upward run.
Refining Entry and Exit Timing
The bull flag pattern provides clear reference points for trade timing. Ending consolidation and resuming the uptrend signals an ideal entry; signs of weakening momentum or reaching a target price signal a potential exit. Shape-driven timing helps traders maximize profit while managing risk. Compared with chasing price swings, this systematic approach greatly improves trading success rates.
Enhancing Risk Management
Mastering the bull flag also helps traders manage risk more logically. Spotting this pattern allows traders to place stop-losses just below consolidation lows, so if the uptrend unexpectedly reverses, losses stay contained. This technical approach to stop-loss placement is more market-driven than arbitrary methods, safeguarding capital while avoiding premature exits caused by normal volatility.
Three Core Features of the Bull Flag Pattern on K-Line Charts
The bull flag is a classic technical chart pattern with several distinct, easy-to-recognize features. Investors aiming to use bull flags successfully must understand these traits in depth. The pattern consists of three main elements:
Flagpole: The Sharp Upward Move
The flagpole is the first crucial part of the bull flag, shown by a sharp, fast price increase—often completed in a short period. The flagpole can be triggered by major positive news, key resistance breakouts, a strong market-wide rally, or concentrated institutional buying. In crypto markets, this phase typically comes with a clear jump in trading volume, signaling strong bullish interest. The steeper and faster the flagpole, the greater the momentum for the next breakout.
Consolidation: Gathering Strength
Once the flagpole forms, the asset usually enters a consolidation phase—the second key trait of the bull flag. Here, prices may slope downward or move sideways, creating a rectangle or flag shape. A major feature of this stage is shrinking trading volume, showing the market is uncertain and waiting. This period is actually bulls preparing for the next move. Consolidation generally lasts less than a third of the flagpole’s duration; if it lasts longer, the pattern’s reliability can weaken.
Volume: The Key Confirmation Signal
Volume is essential for spotting and confirming a bull flag. The flagpole phase usually comes with high volume, showing strong buying and participation. In consolidation, volume drops sharply, indicating a temporary balance between buyers and sellers. This “high volume, then low volume” sequence is key for judging pattern validity. When price breaks out upward and volume spikes again, it confirms the bullish continuation—often the ideal entry point.
How to Use the Bull Flag Pattern in Cryptocurrency Trading: Three Practical Essentials
Bull Flag Trading Essential #1: Pinpointing Entry Timing
Trading bull flags requires careful timing to fully capture bullish continuation opportunities. Traders can choose from several entry strategies, each with its own strengths and use cases. Here are three mainstream entry methods:
Breakout Entry
Breakout entry is the most common and direct strategy for bull flags. Traders wait for price to break above the consolidation high (the flagpole’s top) before entering. This approach lets traders catch the start of the bullish move and ride the full trend. For higher accuracy, traders confirm breakouts with volume—if volume jumps as price breaks out, the move is more likely valid. Watch out for “false breakouts”—setting a solid stop-loss is essential.
Pullback Entry
Pullback entry is more conservative but offers better risk/reward. After a breakout, traders hold off, waiting for price to pull back to the breakout level or the top of consolidation before entering. This lets traders buy at better prices and keeps stop-losses tighter. In crypto, where volatility is high, post-breakout retests are common. This strategy demands patience, but usually delivers a better risk-adjusted return.
Trendline Entry
Seasoned traders may use trendlines to time entries. By connecting multiple lows during consolidation, they draw an upward or downward trendline, entering when price breaks above it. This method can signal a trend reversal earlier than waiting for a breakout above consolidation highs, yielding greater profit. Earlier entry means stricter risk control is needed. This approach suits traders with advanced technical skills and higher risk tolerance.
Your choice of entry strategy depends on trading style, risk preference, and market conditions. Aggressive traders may favor breakouts, while conservative traders stick with pullbacks. Always combine technical signals and market analysis for well-rounded decisions.
Bull Flag Trading Essential #2: Comprehensive Risk Management
Effective risk management is vital for long-term profitability when trading bull flags or any technical pattern. Here are the core principles for managing risk in bull flag trades:
Smart Position Sizing
Position size refers to how much capital you commit to a single trade. Managing size is the first line of risk defense. Never overexpose your account to one trade. A standard rule is to risk no more than 1–2% of your account per trade. For example, with a $10,000 account, cap each trade’s maximum loss at $100–$200. This way, even a string of losses won’t wipe out your account, ensuring you can keep trading.
Strategic Stop-Loss Placement
Setting a stop-loss is the key to limiting potential losses and protecting against failed bull flag trades. Always define your stop-loss before entering—usually just below the consolidation low. The stop distance should cover normal volatility but still allow for timely exit if the pattern fails. Too-tight stops can get triggered by routine movement; too-wide stops risk large losses. In crypto, use ATR (Average True Range) or similar measures for dynamic stop-loss placement.
Clear Take-Profit Targets
Setting a realistic take-profit is as important as a stop-loss, directly impacting your risk/reward ratio. Plan your take-profit at entry—use the flagpole’s height projected upward from the breakout, key resistance as a reference, or a fixed risk/reward ratio like 1:2 or 1:3. A solid risk/reward ratio ensures you can profit over time, even if your win rate isn’t high. For instance, with a 1:2 ratio, only a 40% win rate is needed to break even.
Using Trailing Stops Effectively
Trailing stops are dynamic tools that lock in profits as the trend continues. As price moves in your favor, raise your stop-loss—never lower it. This lets you capture maximum gains while protecting what you’ve earned. For bull flag trades, move stops up to the breakout level or midway through consolidation as price rises, balancing profit protection with trend following.
Bull Flag Trading Essential #3: Avoiding Common Mistakes
Bull flag traders must avoid common errors that cause unnecessary losses. Key mistakes to watch out for include:
Poor Pattern Recognition
Misidentifying the bull flag is a frequent pitfall. Traders may confuse other patterns for bull flags or enter before the pattern is complete. Accurate recognition means: spotting a clear flagpole (sharp rise), shrinking volume during consolidation, and a consolidation period no longer than one-third the flagpole. Don’t mix up bull flags with similar formations like ascending triangles or rectangles. Only trade when all features line up.
Bad Entry Timing
Entry timing is critical. Entering too early risks volatility and losses if the pattern fails; entering too late could mean missing ideal prices or the trade itself. Only enter when the pattern is fully confirmed. For breakouts, wait for a clear move above the consolidation high with higher volume; for pullbacks, wait for a confirmed retest. Don’t chase price out of fear of missing out.
Weak Risk Management
Even good pattern recognition and timing won’t help if risk management fails. Common problems include: no stop-loss or poor stop placement, oversized positions, unclear take-profit targets leading to lost profits, and emotional trading that derails your plan. To avoid these, always set your entry, stop-loss, take-profit, and position size in advance—and stick to the plan. Keep records, review trades, and continually refine your risk management system.
Conclusion
The bull flag pattern is a powerful tool for traders to spot potential bullish continuation. By mastering its defining traits, traders can time entries and exits, set sensible stop-loss and take-profit levels, and manage risk effectively.
To use bull flags successfully, traders must stay vigilant, avoid common mistakes like misidentification or poor timing, and apply sound risk management. Avoid overtrading and always factor in market fundamentals to improve win rates.
Systematic study, error avoidance, and integrating bull flags into an overall trading plan can dramatically boost market performance. Remember: success demands discipline, patience, and ongoing learning. Only by faithfully executing a robust trading plan can traders achieve lasting, stable profits.
FAQ
What is a bull flag pattern? What does it look like on a K-line chart?
The bull flag is a short-term consolidation pattern within an uptrend. It features a rapid price rise (flagpole), followed by a horizontal consolidation area (flag). Trading volume is moderate, the pattern is typically rectangular, and a breakout usually extends the uptrend.
How does a bull flag differ from a bear flag?
A bull flag forms during price increases and signals further gains; a bear flag forms during declines and signals continued losses. They are opposite trend continuation patterns.
How do you spot bull flags on crypto charts? Which technical indicators matter?
Look for a fast price surge with rising volume, forming a narrow upward channel. Key signals include price spikes, volume expansion, and high RSI readings. Confirmation comes when price breaks above the channel’s upper bound.
What usually happens after a bull flag forms? How do you confirm breakout direction?
Bull flags typically signal short-term upward momentum; a breakout above the flag’s top points to further gains. Volume fades during formation, then surges on breakout, confirming the direction. The target price is the flagpole’s height added to the breakout level.
Where should stop-loss and take-profit levels be placed in a bull flag?
Set stop-losses a set distance below the flag’s lower edge; set take-profits at the target price after breaking above the flag. Use the flag’s height as your reference—post-breakout moves typically mirror the earlier rise.
Bull flag breakouts succeed about 35% of the time; bear flag breakdowns about 32%. Key risks include pattern failure, unclear breakout points, and false breakouts. Strict stop-losses, careful position sizing, and volume management are critical for improving success rates.
What other common K-line chart patterns should traders watch besides the bull flag?
Other notable patterns include doji, hammer, spinning top, head and shoulders, and double top/bottom. These reveal trend shifts; when combined with volume and support/resistance analysis, they help spot market turning points.
How do bull flags in crypto differ from those in stock markets?
Bull flags in crypto are structurally similar to those in stocks—both feature a flagpole and flag and signal trend continuation. The main differences: crypto sees higher volume, greater volatility, shorter cycles, stronger breakouts, and typically bigger price moves.
* The information is not intended to be and does not constitute financial advice or any other recommendation of any sort offered or endorsed by Gate.