This comprehensive guide explores Doji candle patterns as essential technical analysis tools for cryptocurrency trading on Gate. Covering five Doji types—Neutral, Long-Legged, Four-Price, Dragonfly, and Gravestone—the article reveals how these formations signal market indecision and potential trend reversals. Traders learn seven proven strategies including confirmation techniques, support/resistance zone positioning, volume analysis integration, and proper risk management with stop-loss orders. The guide examines the psychology behind Doji formations and their limitations in low-liquidity environments. By combining Doji patterns with technical indicators like RSI and MACD, traders can significantly improve decision-making and enhance profitability in cryptocurrency markets.
What is a Doji Candle?
A Doji candle is a candlestick chart formation that indicates market neutrality and indecision. Market neutrality refers to a period where buyers and sellers balance each other out, resulting in minimal price movement during that trading session.
Candlestick chart formations provide crucial information about price movements during a specific trading period. Each candle contains four fundamental pieces of data:
- Opening price of the period
- Closing price of the period
- Highest price reached during the period
- Lowest price reached during the period
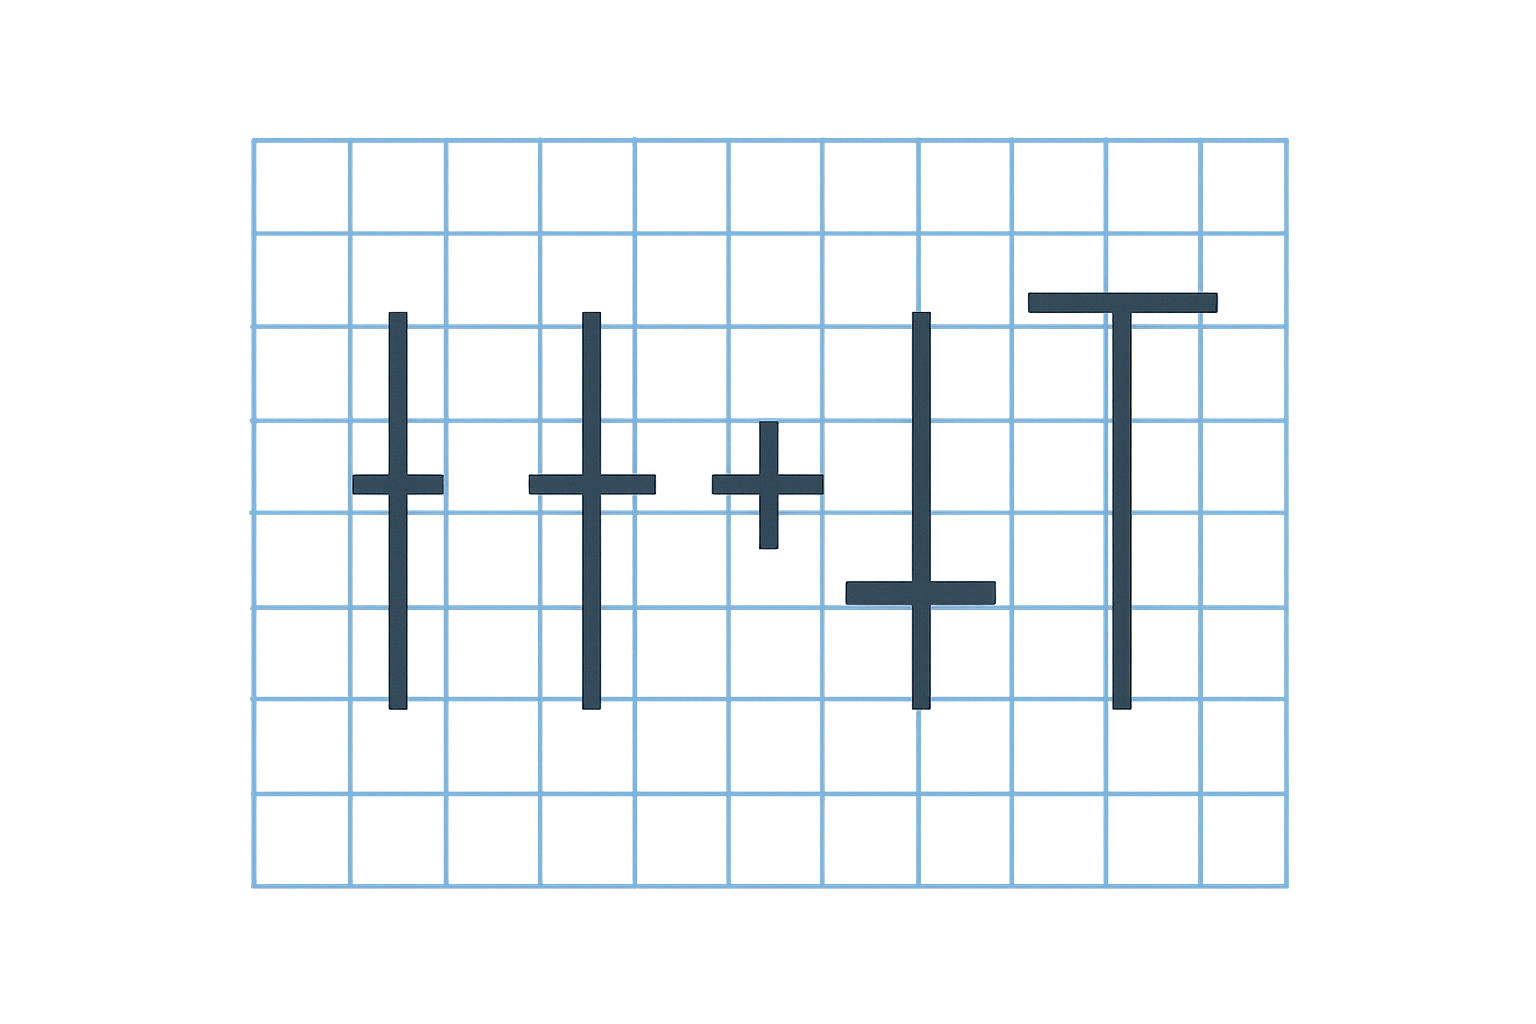
When the opening and closing prices are very close to each other or identical, the candle is represented by wicks but has only a thin line indicating the open/close levels, with essentially no body. This formation is called a Doji candle. The Doji pattern is a powerful visual representation of equilibrium in the market, where neither bulls nor bears have gained control. Traders often view this as a critical signal to pause and reassess market conditions before making trading decisions.
History of Doji Candles
The origins of candlestick chart formations are widely accepted to trace back to Japan, with their introduction to the Western world credited to Steve Nison through his influential publications on Japanese candlestick charting techniques.
In Japanese, the word "doji" translates to "mistake" or "error." This name was given to represent a specific candle formation that symbolizes a mistake traders might inadvertently make when interpreting market signals. The historical significance of Doji candles in Japanese rice trading markets demonstrates their long-standing value in technical analysis. Over centuries, traders have recognized that these formations often appear at critical market junctures, making them essential tools for identifying potential trend reversals or continuation patterns.
Doji Candle Types and Their Meanings
Neutral Doji
The Neutral Doji, also known as the Star Doji, displays opening and closing prices that are identical, with wicks of equal length extending both above and below. Neither bulls nor bears have gained an advantage, as most trading activity cancels itself out. This represents a clear signal of market indecision and uncertainty. When a Neutral Doji appears after a strong trend, it often suggests that the prevailing momentum is weakening and a potential reversal may be imminent. Traders should pay particular attention to the context in which this pattern emerges, as its significance increases when it forms at key support or resistance levels.
Long-Legged Doji
The Long-Legged Doji resembles the Neutral Doji but features significantly longer wicks on both sides of the opening/closing price line. This indicates that considerably more volatility occurred during that trading session compared to a standard Neutral Doji. The extended wicks demonstrate that prices moved dramatically in both directions before ultimately closing near the opening level. This pattern suggests intense battle between buyers and sellers, with neither side able to maintain control. The Long-Legged Doji is particularly meaningful when it appears after extended trends, as it signals growing uncertainty and potential exhaustion of the current market direction.
Four-Price Doji
The Four-Price Doji has no wicks at all, displaying only the opening and closing price as a single horizontal line. This indicates that virtually no price movement occurred during the entire period. Such formations are relatively rare and typically appear in extremely low-liquidity conditions or during market holidays. While this pattern confirms absolute equilibrium, its practical trading value is limited due to the lack of price action. Traders should be cautious when encountering Four-Price Doji patterns, as they may indicate insufficient market participation to generate reliable trading signals.
Dragonfly Doji
In the Dragonfly Doji pattern, the opening and closing prices are identical to the highest price of the period. Most or all of the wick extends downward below the opening/closing line. This formation is frequently observed when a market direction change is approaching, especially when it appears after a downtrend. The Dragonfly Doji suggests that sellers pushed prices significantly lower during the session, but buyers rallied strongly to close at or near the session high. This demonstrates a potential shift in market sentiment from bearish to bullish. When confirmed by subsequent price action, the Dragonfly Doji can serve as a reliable reversal signal for entering long positions.
Gravestone Doji
The Gravestone Doji is the inverse of the Dragonfly Doji, with opening and closing prices near the lowest price level while featuring a long upper wick. This pattern typically appears at the end of an uptrend and can signal a bearish market reversal. The formation indicates that buyers initially drove prices higher during the session, but sellers overwhelmed them, forcing prices back down to close at or near the session low. This shift in control from bulls to bears suggests weakening buying pressure and increasing selling interest. Traders often interpret the Gravestone Doji as a warning sign to exit long positions or consider short-selling opportunities, particularly when it forms at resistance levels or after extended rallies.
How to Trade with Doji Candles
1. Wait for Confirmation
Doji patterns indicate indecision and uncertainty, so avoid making immediate buy or sell decisions based solely on the Doji formation. Instead, wait for the direction of the subsequent candle to provide confirmation of the potential market move. A bullish candle following a Doji suggests upward momentum, while a bearish candle indicates downward pressure. This confirmation approach significantly reduces false signals and improves trading accuracy. Professional traders often require not just one but multiple confirming candles before committing capital to a position.
2. Use at Support and Resistance Zones
Doji patterns carry greater significance and reliability when they form at key price levels such as major support or resistance zones. These critical areas represent psychological price points where market participants have historically made important decisions. When a Doji appears at these levels, it suggests that the market is struggling to break through, increasing the probability of a reversal or consolidation. Traders should combine Doji analysis with horizontal support/resistance lines, trendlines, and Fibonacci retracement levels to identify the most meaningful trading opportunities.
3. Combine with Volume and Other Indicators
Using Doji patterns alongside volume analysis and other technical indicators significantly increases trading confidence and success rates. High volume accompanying a Doji formation adds credibility to the signal, indicating strong market participation during the indecision phase. Additionally, incorporating momentum indicators like RSI (Relative Strength Index), MACD (Moving Average Convergence Divergence), or moving averages provides multiple layers of confirmation. For example, a Doji forming with RSI in overbought territory after an uptrend creates a more compelling case for a potential reversal than a Doji appearing in isolation.
Doji patterns play a central role in powerful reversal formations such as the Morning Star and Evening Star patterns. In these three-candle formations, the Doji appears in the middle, sandwiched between a large bearish candle and a large bullish candle (Morning Star) or between a large bullish candle and a large bearish candle (Evening Star). These patterns provide some of the most reliable trading signals in technical analysis. The Morning Star suggests a bullish reversal at the bottom of a downtrend, while the Evening Star indicates a bearish reversal at the top of an uptrend. Traders should enter positions after the third confirming candle closes, with stop-loss orders placed beyond the pattern's extreme points.
5. Intraday Trading Applications
In scalping or short-term trading strategies, Doji patterns can facilitate quick entry and exit decisions. Day traders often use Doji formations on lower timeframes (5-minute, 15-minute, or 1-hour charts) to identify temporary pauses in intraday trends. These brief moments of indecision can present opportunities for rapid trades with tight stop-losses. However, traders must be aware that Doji patterns on lower timeframes generate more noise and false signals compared to daily or weekly charts. Therefore, combining intraday Doji analysis with real-time volume data and Level 2 order book information becomes essential for successful short-term trading.
6. Implement Stop-Loss Orders
Risk management is crucial when trading Doji patterns. Always place stop-loss orders slightly beyond the extreme points of the Doji candle to limit potential losses. For a bullish trade following a Dragonfly Doji, position the stop-loss just below the Doji's low. For a bearish trade after a Gravestone Doji, place the stop-loss just above the Doji's high. This approach ensures that if the market moves against your position, your losses remain controlled and predetermined. Professional traders typically risk no more than 1-2% of their trading capital on any single trade, regardless of how compelling the Doji signal appears.
7. Consider Partial Positions and Trend Continuation
It is important to recognize that Doji patterns within strong trends often represent temporary pauses rather than complete reversals. In such cases, the prevailing trend typically resumes after the brief consolidation period. Traders can adapt their strategies by taking partial positions when Doji patterns appear mid-trend, rather than committing full capital. This approach allows for flexibility—if the trend continues, you maintain exposure to profit from the move; if a reversal occurs, your reduced position size limits potential losses. Additionally, using trailing stop-loss orders can help lock in profits while allowing winning trades to run if the trend resumes after the Doji formation.
The Psychology Behind Doji Candles
The power of Doji candles lies in their ability to reveal the psychological balance between traders in the market. During Doji formation, buyers attempt to push prices higher while sellers simultaneously pull them lower, ultimately resulting in a closing price at or very near the opening level. This demonstrates that neither bulls nor bears have gained control, creating a state of uncertainty and equilibrium.
When a Doji appears after a sustained trend, it frequently signals a shift in market sentiment. The trend that previously seemed unstoppable encounters resistance or support, causing participants to question whether the move can continue. This moment of collective doubt creates the indecision reflected in the Doji pattern. Experienced traders understand that Doji formations alone do not dictate market direction; instead, they wait for the subsequent candle to reveal which side—bulls or bears—has gained strength and is likely to dominate the next phase of price movement.
The psychological interpretation of specific Doji types adds another layer of understanding. A Dragonfly Doji after a downtrend suggests that sellers exhausted their momentum, allowing buyers to stage a comeback. Conversely, a Gravestone Doji after an uptrend indicates that buyers lost control despite initial strength, with sellers overpowering them by the close. Recognizing these psychological dynamics helps traders anticipate potential market reactions and position themselves accordingly.
Limitations of Doji Candles
Not a Standalone Guarantee
Doji patterns do not guarantee trend reversals or significant market movements. While they indicate indecision and potential turning points, many Doji formations are followed by trend continuation rather than reversal. Traders who rely exclusively on Doji signals without considering broader market context risk making premature or incorrect trading decisions. The pattern should always be viewed as one piece of evidence within a comprehensive analysis framework.
Misleading Signals in Low Liquidity
In assets with low trading volume or during off-peak market hours, Doji patterns can generate false signals due to market noise and insufficient participation. These formations may appear simply because few traders are active, rather than reflecting genuine market indecision. Therefore, Doji patterns carry more weight in liquid markets with consistent trading activity. Traders should verify that adequate volume accompanies the Doji formation before assigning significance to the pattern.
Abundance in Sideways Markets
During range-bound or consolidating market conditions, Doji candles appear frequently as indecision becomes the norm rather than the exception. In such environments, the predictive value of Doji patterns diminishes significantly because the market lacks directional bias. Traders should be cautious about over-interpreting Doji signals in sideways markets, as they may simply reflect ongoing consolidation rather than impending breakouts or reversals.
Timing Challenges
Waiting for confirmation after a Doji pattern can sometimes result in entering trades at less favorable prices. By the time the confirming candle completes, a significant portion of the anticipated move may have already occurred. This timing dilemma forces traders to balance the need for confirmation against the risk of missing optimal entry points. Some experienced traders develop strategies that allow for partial position entries on the Doji itself, with additional positions added upon confirmation.
Pattern Misidentification
Distinguishing Doji candles from similar formations such as spinning tops or small-bodied candles requires practice and attention to detail. Misidentifying patterns can lead to incorrect trading decisions and losses. Traders should establish clear criteria for what constitutes a valid Doji in their trading system—for example, requiring that the body be no more than 5-10% of the total candle range.
Importance of Complete Market Context
Doji patterns must be evaluated within the complete picture of market conditions, including prevailing trends, momentum indicators, volume analysis, and relevant news flow. A Doji appearing in isolation provides limited actionable information. However, when combined with other technical factors—such as forming at a major Fibonacci level during oversold RSI conditions—the pattern's significance increases substantially. Successful traders develop the skill to synthesize multiple data points rather than relying on single pattern recognition.
Emotional Bias Risk
Traders sometimes project their own expectations and biases onto Doji patterns, seeing what they want to see rather than what the market actually presents. This emotional interference can lead to selective interpretation and poor trading decisions. Maintaining objectivity and emotional discipline is essential when analyzing Doji formations. Establishing predefined trading rules and criteria helps minimize the influence of personal biases on pattern interpretation.
Conclusion
Doji candles, while not the most powerful standalone indicator for predicting price movements, serve as valuable tools when evaluated within broader market conditions. These formations excel at highlighting moments of equilibrium and indecision, providing traders with early warnings of potential trend changes or continuation patterns.
The Doji pattern's significance lies in its ability to reflect the delicate balance and hesitation present in the market. Despite being a small formation on a price chart, it carries substantial meaning for those who understand its psychological implications. Rather than serving as a definitive buy or sell signal, the Doji functions as an alert—a call for traders to pay closer attention, gather additional evidence, and prepare for potential market shifts.
Successful trading with Doji patterns requires patience, discipline, and a comprehensive approach to market analysis. By combining Doji recognition with confirmation techniques, volume analysis, support and resistance identification, and proper risk management, traders can significantly improve their decision-making process. Understanding the various Doji types—from Neutral and Long-Legged to Dragonfly and Gravestone formations—enables traders to interpret market psychology more accurately and position themselves advantageously.
Ultimately, mastering Doji candle analysis represents one component of a well-rounded trading education. As with all technical analysis tools, continuous learning, practice, and adaptation to evolving market conditions remain essential for long-term trading success.
FAQ
What is a Doji candle and how do you identify it in price charts?
A Doji candle is a price pattern with equal or nearly equal opening and closing prices, forming a cross-like shape. It features a small body with long upper and lower wicks, indicating market indecision. Identify it by the minimal distance between open and close prices on your chart, signaling potential trend reversals or consolidation zones.
What are the different types of Doji patterns and their trading implications?
Doji patterns include dragonfly doji, gravestone doji, and long-legged doji. Dragonfly doji signals potential upward reversals with strong support. Gravestone doji indicates downward reversals near resistance. Long-legged doji suggests indecision with future breakout potential. These patterns are reliable reversal indicators in trading.
How do you use Doji candles to develop a profitable trading strategy?
Identify Doji candles at support and resistance levels to signal potential trend reversals or continuations. Combine with additional technical indicators or price action confirmation to enhance strategy profitability.
What is the difference between a Doji candle and other reversal patterns like Hammer or Shooting Star?
A Doji has balanced open and close prices with long wicks on both sides, indicating indecision. A Hammer features a small body with a long lower wick at downtrend bottoms, signaling potential upward reversals. A Shooting Star has a small body with a long upper wick at uptrend tops, suggesting potential downward reversals.
What are the limitations and false signals associated with Doji candle patterns?
Doji patterns often produce false signals in volatile markets and lack reliable reversal predictions. They work best with additional confirmation indicators and should not be used in isolation for trading decisions.
How reliable are Doji candles as indicators for trend reversal in different market conditions?
Doji candles indicate potential trend reversals with moderate reliability, performing best in low volatility environments. Their effectiveness varies by market conditions and should be combined with volume analysis and other technical indicators for confirmation.
* The information is not intended to be and does not constitute financial advice or any other recommendation of any sort offered or endorsed by Gate.