This comprehensive guide explores Doji candlestick patterns, a fundamental technical analysis tool that reveals market indecision and potential reversal points. The article examines five distinct Doji types—Neutral, Long-Legged, Four-Price, Dragonfly, and Gravestone—each conveying unique market psychology. Traders learn practical trading strategies including confirmation techniques, support/resistance integration, and risk management through stop-loss placement on platforms like Gate. The guide addresses Doji psychology, psychological battles between buyers and sellers, and critical limitations including false signals in low-liquidity markets. Perfect for traders seeking to identify high-probability reversals and consolidation zones, this resource emphasizes that Doji candles work best when combined with volume analysis, technical indicators like RSI and MACD, and proper market context rather than as standalone signals.
What is a Doji Candle?
A Doji candle is a distinctive candlestick pattern that signals market neutrality and indecision. This formation occurs when the opening and closing prices of an asset are virtually identical or extremely close during a specific trading period, resulting in a candle with little to no body. The term "market neutrality" refers to a state where buying and selling pressures are balanced, leading to minimal net price movement despite trading activity.
Candlestick chart formations provide comprehensive information about price movements within a defined trading period. Each candle conveys four essential data points that traders analyze:
- Opening Price: The initial price at the start of the period
- Closing Price: The final price at the end of the period
- High Price: The highest price reached during the period
- Low Price: The lowest price touched during the period
When the opening and closing prices are nearly equal or identical, the candle appears as a thin line with upper and/or lower shadows (wicks) but lacks a substantial body. This unique formation is known as a Doji candle. The presence of a Doji indicates that despite potential volatility during the trading session, neither buyers nor sellers gained control, and the price returned to approximately where it started. This pattern is particularly significant in technical analysis as it often precedes important market movements or trend reversals.
History of Doji Candles
The origins of candlestick charting, including Doji patterns, are widely attributed to Japan, with roots dating back to the 18th century. Japanese rice traders developed this visual method to track market psychology and price movements in the Osaka rice exchanges. The term "Doji" in Japanese translates to "mistake" or "error," which carries symbolic meaning in trading context.
The name reflects the concept that when a Doji appears, it represents a moment of uncertainty or indecision—a "mistake" in the sense that the market attempted movement but failed to establish direction. This nomenclature emphasizes the pattern's significance as a warning signal rather than a definitive trading instruction. Over centuries, this Japanese technical analysis method spread globally and became a fundamental tool in modern technical analysis across all financial markets, including stocks, forex, commodities, and cryptocurrencies.
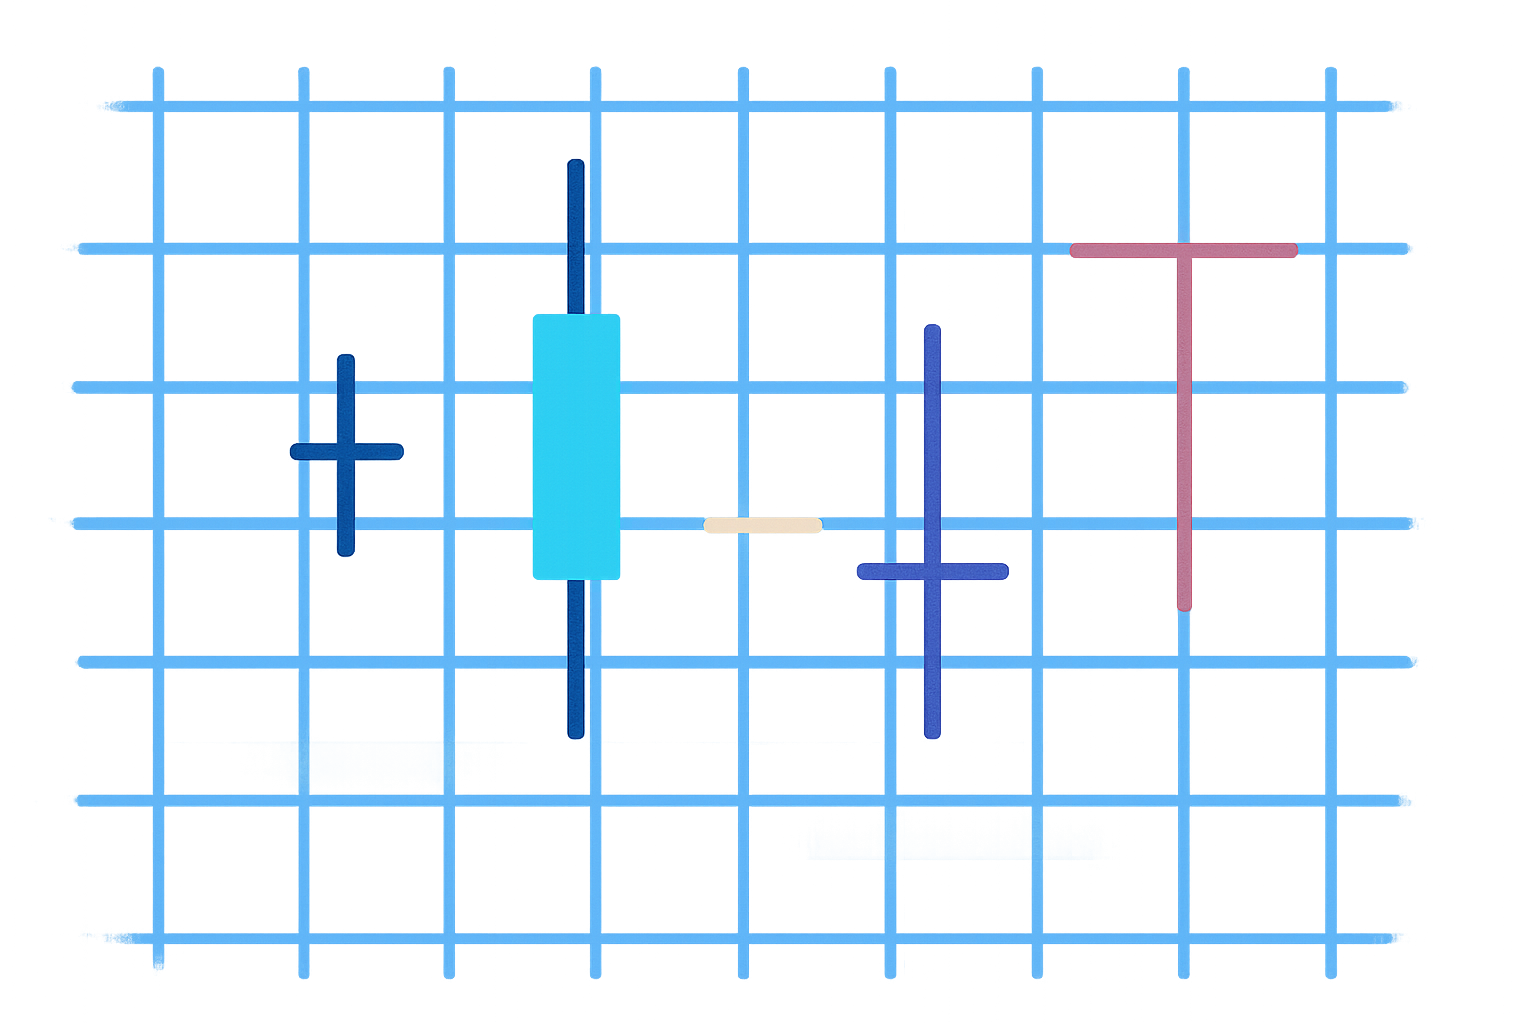
Types of Doji Candles and Their Meanings
Neutral Doji (Star Doji)
The Neutral Doji, also known as the Star Doji, features opening and closing prices that are identical, with upper and lower shadows of approximately equal length. This formation creates a cross or plus-sign appearance on the chart. The symmetry indicates that neither bulls nor bears dominated during the trading session—buyers pushed prices higher at some point, while sellers drove them lower, but ultimately the forces balanced out perfectly.
This pattern represents pure indecision and is most significant when it appears after a strong trend. In an uptrend, a Neutral Doji suggests that buying momentum may be weakening. In a downtrend, it indicates that selling pressure might be diminishing. Traders typically wait for confirmation from the next candle before taking action, as the Neutral Doji alone doesn't indicate which direction the market will break.
Long-Legged Doji
The Long-Legged Doji closely resembles the Neutral Doji but features significantly longer upper and lower shadows extending far from the opening/closing price line. This extended range indicates that the trading session experienced substantial volatility and price swings in both directions. Buyers and sellers engaged in aggressive battle, pushing prices to extremes before ultimately settling back near the opening level.
This pattern is particularly powerful because it demonstrates intense market conflict and uncertainty. The longer shadows represent greater price rejection at both higher and lower levels, suggesting strong disagreement about fair value. When a Long-Legged Doji appears at key support or resistance levels, it often precedes significant trend reversals. The heightened volatility captured in this pattern makes it more reliable than standard Doji formations, though confirmation remains essential.
Four-Price Doji
The Four-Price Doji is an extremely rare formation where the opening, closing, high, and low prices are all identical. This pattern appears as a single horizontal line with no shadows whatsoever. It indicates that throughout the entire trading period, no price movement occurred—the asset traded at exactly one price level.
This formation is exceptionally uncommon in high-volume, liquid markets because it requires absolute absence of price fluctuation. When it does occur, it typically happens in very thin markets, during trading halts, or in extremely short timeframes. In cryptocurrency markets or 24-hour trading environments, a true Four-Price Doji is virtually impossible. If encountered, it signals complete market stagnation and should be treated with caution, as it may indicate technical issues or extremely low liquidity rather than meaningful price action.
Dragonfly Doji
The Dragonfly Doji is characterized by opening and closing prices that align with the period's high, with a long lower shadow and little to no upper shadow. The pattern resembles a "T" shape and carries significant bullish implications, especially when appearing after a downtrend.
This formation tells a compelling story: sellers initially drove prices sharply lower during the session, but buyers aggressively stepped in, rejecting the lower prices and pushing the market back up to close at or near the session high. This strong rejection of lower prices demonstrates that selling pressure has been absorbed and buying interest is emerging. When a Dragonfly Doji forms at a key support level or after an extended decline, it often signals a potential trend reversal from bearish to bullish. The longer the lower shadow, the more significant the bullish implication, as it represents a stronger rejection of lower prices.
Gravestone Doji
The Gravestone Doji is the inverse of the Dragonfly Doji, featuring opening and closing prices near the period's low with a long upper shadow and minimal lower shadow. This pattern resembles an inverted "T" or tombstone shape, hence its name, and typically carries bearish implications.
The Gravestone Doji indicates that buyers initially pushed prices significantly higher during the session, but sellers aggressively rejected those higher levels, driving the market back down to close near the session low. This strong rejection of higher prices suggests that buying momentum is exhausted and selling pressure is building. When this pattern appears after an uptrend or at resistance levels, it often signals a potential bearish reversal. The longer the upper shadow, the more bearish the signal, as it represents a more decisive rejection of higher prices. Traders often view the Gravestone Doji as a warning that the current uptrend may be losing steam.
How to Trade with Doji Candles
1. Wait for Confirmation
Doji candles represent indecision, not immediate action signals. The most critical rule in Doji trading is patience—never enter a position based solely on a Doji formation. Instead, wait for the next candle to confirm the direction. A bullish confirmation candle (closing higher than the Doji) suggests upward movement, while a bearish confirmation candle (closing lower) indicates downward pressure. This confirmation approach significantly reduces false signals and improves trading accuracy.
2. Use at Support and Resistance Levels
Doji patterns carry much greater significance when they form at key technical levels. A Doji appearing at a well-established support level after a downtrend has higher probability of signaling a reversal than one occurring in the middle of a trend. Similarly, a Doji at resistance during an uptrend warrants closer attention. Combine Doji analysis with horizontal support/resistance, trendlines, Fibonacci retracement levels, and moving averages to identify high-probability setups.
3. Combine with Volume and Other Indicators
Enhance Doji signal reliability by incorporating volume analysis and technical indicators. A Doji accompanied by unusually high volume suggests genuine market indecision with significant participation, making subsequent moves more reliable. Integrate indicators like RSI (to identify overbought/oversold conditions), MACD (for momentum confirmation), and Bollinger Bands (for volatility context). For example, a Dragonfly Doji with oversold RSI and increasing volume at support creates a powerful bullish setup.
Doji candles often form the middle component of powerful three-candle reversal patterns. The Morning Star pattern (bearish candle, Doji, bullish candle) signals bullish reversal at downtrend bottoms. The Evening Star pattern (bullish candle, Doji, bearish candle) indicates bearish reversal at uptrend tops. These formations are among the most reliable candlestick patterns because they show clear momentum shift from one side to the other, with the Doji representing the transition point.
5. Intraday Trading Applications
For scalpers and day traders, Doji patterns on shorter timeframes (5-minute, 15-minute, 1-hour charts) can provide quick entry and exit opportunities. In high-frequency trading, Doji formations at intraday support/resistance levels offer rapid profit-taking setups. However, be aware that shorter timeframes generate more false signals, so tighter stop-losses and smaller position sizes are essential. Combine with intraday volume patterns and level 2 order book data for optimal results.
6. Implement Stop-Loss Protection
Risk management is crucial when trading Doji patterns. Place stop-loss orders just beyond the extreme point of the Doji candle—below the low for long positions or above the high for short positions. This placement protects against the pattern failing while giving the trade room to develop. For Long-Legged Doji with extended shadows, consider slightly wider stops to account for volatility. Always risk only a small percentage of capital (typically 1-2%) per trade.
7. Recognize Continuation vs. Reversal Context
Not every Doji signals reversal. In strong trending markets, Doji patterns often represent temporary pauses or consolidation before trend continuation. Distinguish between reversal and continuation scenarios by analyzing the broader trend context. A Doji in the middle of a strong uptrend with no nearby resistance may simply be a brief rest before further gains. Partial position sizing allows you to capture continuation moves while protecting against reversals—consider taking partial profits at Doji formations while trailing stops on remaining positions.
Psychology Behind Doji Candles
The power of Doji candles lies in their ability to reveal the psychological balance between market participants. During Doji formation, a intense battle unfolds between bulls and bears, with each side attempting to establish control. Buyers actively push prices higher, demonstrating confidence and willingness to purchase at elevated levels. Simultaneously, sellers aggressively drive prices lower, showing conviction that current valuations are excessive.
The resulting equilibrium—where closing price returns to opening level—indicates that neither side achieved dominance. This stalemate reflects genuine uncertainty about the asset's fair value and future direction. Market participants are essentially asking: "Should we continue in the current direction, or is a reversal imminent?"
When a Doji appears after an extended trend, it signals that the prevailing market sentiment may be shifting. In an uptrend, a Doji suggests that buyers are becoming exhausted or hesitant, while sellers are gaining courage. In a downtrend, it indicates that sellers are losing conviction while buyers are testing the waters. This psychological transition point is why Doji patterns often precede significant moves.
Experienced traders understand that the Doji itself doesn't answer the directional question—it simply highlights the question's existence. Professional traders don't act on the Doji alone; instead, they watch the next candle to see which side wins the psychological battle. A strong bullish candle following a Doji confirms that buyers have seized control, while a strong bearish candle shows sellers have won. This confirmation process is essential because it reveals which psychological force ultimately prevailed in the market's moment of indecision.
Limitations of Doji Candles
Not a Guarantee
Doji candles do not guarantee trend reversals or significant price movements. They are indicators of potential change, not certainties. Many Doji formations result in trend continuation rather than reversal, especially in strong trending markets. Traders who act on every Doji without proper context and confirmation will experience numerous false signals and losing trades.
Misleading Signals in Low Liquidity
In assets or timeframes with low trading volume, Doji patterns lose reliability. Thin markets naturally produce erratic price action where small orders can create Doji-like formations without representing genuine market indecision. Cryptocurrency pairs with low volume, penny stocks, or extremely short timeframes (1-minute charts) often generate meaningless Doji patterns that don't reflect true supply-demand dynamics.
Doji Abundance in Ranging Markets
During sideways or consolidating markets, Doji candles appear frequently because indecision is the norm. In these conditions, Doji patterns provide little actionable information since the market is already demonstrating lack of directional conviction. Trading every Doji in a range-bound market leads to overtrading and poor results. Focus on Doji formations that appear at range boundaries or after clear trends.
Confirmation Delay Issues
Waiting for confirmation candles—while prudent for risk management—often means entering trades at less favorable prices. By the time a strong confirmation candle completes, the move may already be substantially underway, reducing profit potential. This creates a trade-off between signal reliability and entry quality that traders must navigate based on their risk tolerance and trading style.
Misidentification Risks
Distinguishing true Doji candles from similar patterns requires practice and precision. Small-bodied candles (spinning tops) are often confused with Doji, leading to misinterpretation. The difference matters because spinning tops indicate indecision with slight directional bias, while Doji represent pure equilibrium. Additionally, what appears as a Doji on one timeframe may not qualify on another, creating inconsistency in analysis.
Context is Everything
Doji candles cannot be analyzed in isolation. Their significance depends entirely on surrounding context including prevailing trend, proximity to support/resistance, overall market momentum, volume patterns, and broader market conditions. A Doji that appears highly significant on the price chart alone may be irrelevant when considering fundamental news, macroeconomic factors, or sector-wide movements. Successful Doji trading requires comprehensive market analysis.
Emotional Bias Trap
Traders often project their own expectations and biases onto Doji patterns, seeing what they want to see rather than what the market is actually showing. A trader holding a long position may interpret a Doji as a bullish continuation signal, while a trader seeking short entry may view the same pattern as bearish reversal. This confirmation bias leads to selective perception and poor decision-making. Objective, systematic analysis is essential to avoid emotional interpretation of Doji patterns.
Conclusion
Doji candles, when viewed in isolation, are not the most powerful indicators for predicting price movements. Their true value emerges when integrated into comprehensive technical analysis that considers broader market context, trend dynamics, volume patterns, and confluence with other technical factors. A Doji candle serves as a warning signal rather than a definitive trading instruction—it alerts traders to pay closer attention and prepare for potential directional change.
The various Doji types—Neutral, Long-Legged, Four-Price, Dragonfly, and Gravestone—each tell a unique story about market psychology and the balance of power between buyers and sellers. Understanding these nuances enables traders to anticipate trend reversals, identify consolidation periods, and time entries with greater precision. However, successful Doji trading requires patience, discipline, and systematic confirmation processes.
While small in appearance, Doji formations carry substantial meaning by revealing the delicate equilibrium and hesitation present in markets at critical junctures. They represent moments when the market pauses to reassess direction, creating opportunities for prepared traders. The key to profiting from Doji patterns lies not in treating them as buy or sell signals, but rather as alerts to watch closely, gather additional evidence, and wait for confirmation before committing capital. When combined with sound risk management, proper context analysis, and confirmation techniques, Doji candles become valuable tools in a trader's technical analysis arsenal.
FAQ
What is a Doji Candle? What is its significance in technical analysis?
A Doji candle forms when opening and closing prices are nearly identical, indicating market indecision. It signals potential trend reversals or consolidation zones, making it valuable for identifying inflection points in price movements.
What are the different types of Doji and how to distinguish Dragonfly Doji, Gravestone Doji, and Long-legged Doji?
Dragonfly Doji has long lower wicks with small upper bodies, indicating buying pressure. Gravestone Doji has long upper wicks with small lower bodies, showing selling pressure. Long-legged Doji has long wicks on both sides, reflecting indecision between buyers and sellers.
How to use Doji patterns in actual trading to identify trading opportunities and reversal signals?
Doji signals potential reversals when open and close prices are nearly equal, indicating market uncertainty. Combine Doji with other indicators like RSI or moving averages for confirmation. Use it at trend bottoms for buy signals, but avoid relying solely on Doji; always confirm with additional technical analysis tools.
What are the differences between Doji patterns and other candlestick patterns such as Hammer and Engulfing?
Doji has equal open and close prices, indicating indecision. Hammer features a long lower wick with small body, suggesting potential reversal after downtrends. Engulfing involves one candle completely covering the previous candle's body, signaling stronger momentum shifts. Each pattern reveals different market psychology.
How reliable is the Doji pattern? What risks should be noted when trading with Doji?
Doji patterns indicate market indecision but cannot reliably predict future price movements. Trading risks include market volatility, potential losses from leverage, and false signals. Always use stop-loss orders and trade only with capital you can afford to lose.
How to combine other technical indicators to confirm the validity of Doji signals?
Combine Doji with RSI for bullish divergence and moving averages for trend confirmation. Use MACD crossovers and volume analysis to validate reversal signals and enhance trading accuracy.
* The information is not intended to be and does not constitute financial advice or any other recommendation of any sort offered or endorsed by Gate.