This comprehensive guide equips traders with essential knowledge of Doji candle patterns—a critical technical analysis tool for identifying market indecision and potential trend reversals. Doji candles form when opening and closing prices are nearly identical, revealing equilibrium between buyers and sellers at key price levels. The guide explores five primary Doji types: Neutral Doji indicating pure indecision, Long-Legged Doji showing intense volatility, Four-Price Doji representing extreme rarity, Dragonfly Doji signaling bullish reversals, and Gravestone Doji indicating bearish reversals. Rather than standalone signals, Doji patterns excel when combined with confirmation candles, volume analysis, support/resistance levels, and momentum indicators like RSI or MACD. Practical trading strategies emphasize waiting for confirmation, using partial positions, implementing proper stop-loss placement, and trading star formations. While valuable for cryptocurrency and traditional markets on Gate and other platforms
What Is a Doji Candle?
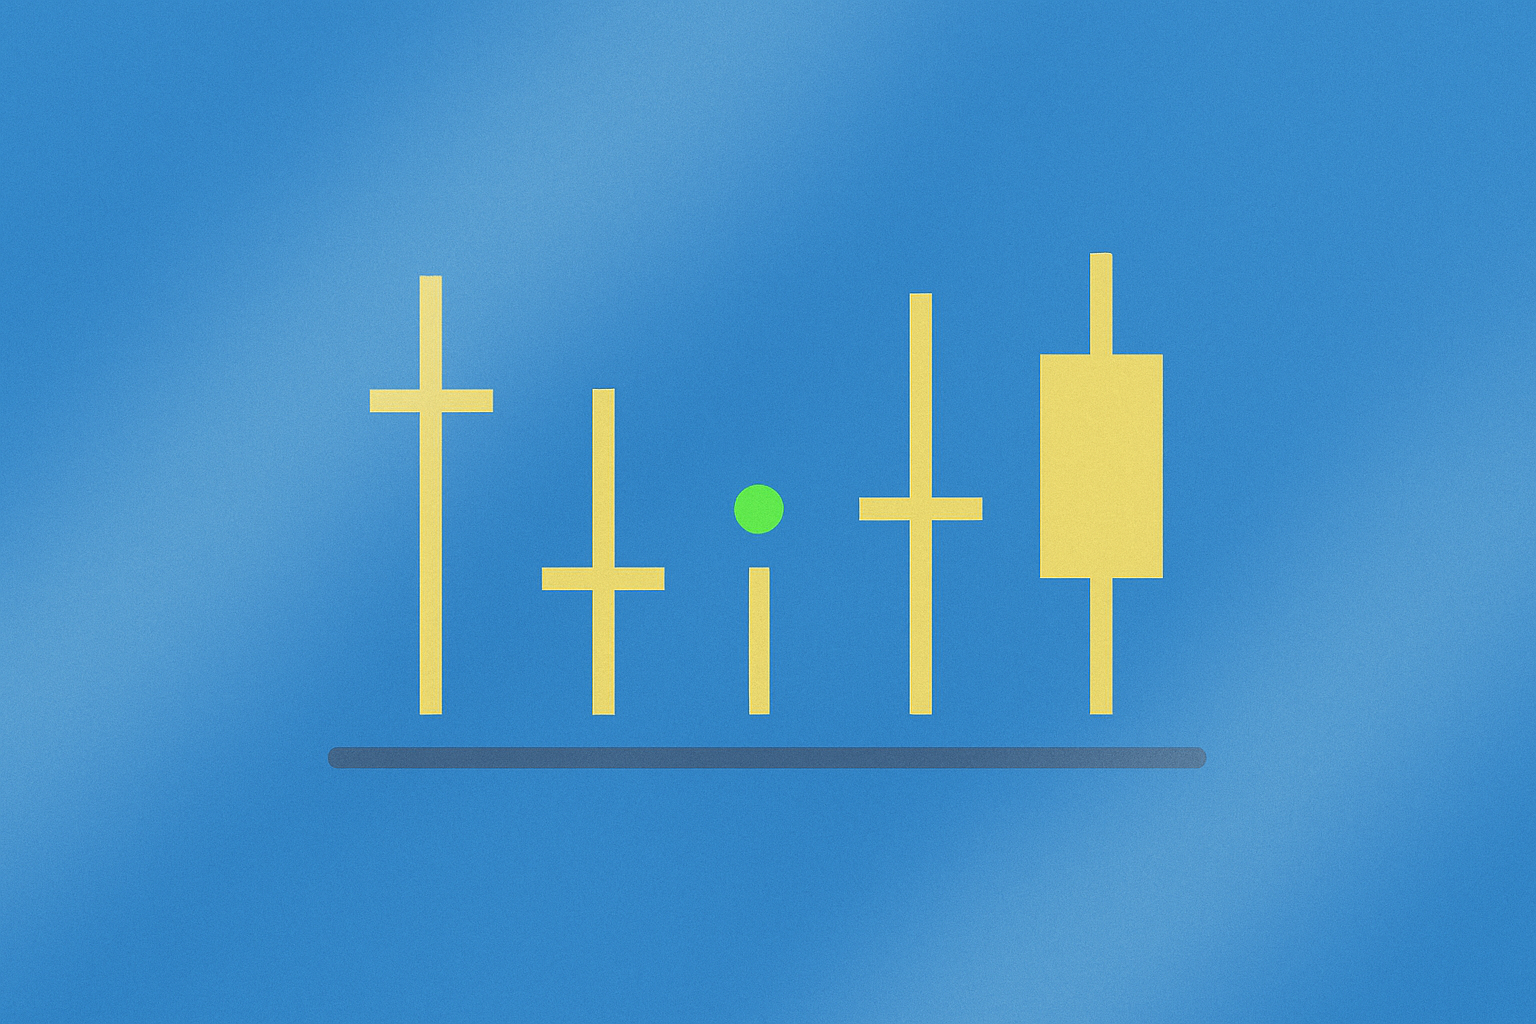
A Doji candle is a candlestick chart formation that represents market neutrality and indecision. Market neutrality occurs when buyers and sellers balance each other out, resulting in minimal or no price movement during a specific trading period.
Candlestick formations provide critical information about price movements during a defined trading session. Each candlestick displays four essential data points:
- Opening price of the period
- Closing price of the period
- Highest price reached during the period
- Lowest price reached during the period
When the opening and closing prices are very close or identical, the candlestick appears as a thin line with wicks (shadows) but no body. This unique formation is called a Doji candle. The absence of a body signifies that despite price fluctuations during the session, the market closed at or near the opening level, indicating equilibrium between bullish and bearish forces.
Doji patterns are particularly significant in technical analysis because they highlight moments of hesitation in the market. Traders interpret these formations as potential signals for trend reversals or continuations, depending on the context in which they appear. Understanding the nuances of Doji candles is essential for developing effective trading strategies in both cryptocurrency and traditional financial markets.
History of Doji Candles
The origins of candlestick chart formations, including the Doji pattern, trace back to 18th-century Japan. Japanese rice traders developed this visual method to track market psychology and price movements. The technique was later introduced to the Western world through Steve Nison's groundbreaking book, "Japanese Candlestick Charting Techniques," published in the early 1990s.
The term "Doji" in Japanese translates to "mistake" or "error." This name reflects the pattern's representation of a trading session where market participants essentially made no net progress—buyers and sellers canceled each other out, leaving the price unchanged. The metaphor suggests that the market "made a mistake" by failing to establish a clear direction.
Historically, Japanese traders recognized that Doji candles often appeared at critical turning points in market trends. They developed sophisticated interpretations of different Doji variations, each carrying specific implications for future price action. This centuries-old wisdom has been validated by modern technical analysis and continues to be a cornerstone of candlestick pattern recognition in contemporary trading across global markets, including cryptocurrency exchanges.
Types of Doji Candles and Their Meanings
Neutral Doji
The Neutral Doji, also known as the Star Doji, features opening and closing prices that are identical, with upper and lower shadows of approximately equal length. This symmetry indicates that price movements above and below the opening/closing level were balanced during the trading session.
The Neutral Doji represents pure market indecision. Neither buyers nor sellers gained control, and the price returned to its starting point. When this pattern appears after a strong trend, it may signal that the prevailing momentum is weakening. Traders often interpret this as a warning to prepare for potential trend changes, though confirmation from subsequent candles is essential before taking action.
Long-Legged Doji
The Long-Legged Doji closely resembles the Neutral Doji but features significantly longer upper and lower shadows extending far from the opening/closing price. This extended range indicates that the trading session experienced substantial volatility, with prices swinging dramatically in both directions before settling back at the opening level.
This pattern reveals intense battle between bulls and bears, with neither side ultimately prevailing. The long shadows demonstrate that both buying and selling pressure were strong, but they neutralized each other. Long-Legged Doji patterns often appear at major support or resistance levels and can precede significant price breakouts or reversals. The heightened volatility captured in this formation makes it particularly important for risk management considerations.
Four-Price Doji
The Four-Price Doji is the rarest and most extreme form of Doji pattern. It has no shadows at all—the opening, closing, highest, and lowest prices are all identical. This pattern appears as a simple horizontal line on the chart.
This formation indicates an extraordinarily quiet trading session with virtually no price movement. It typically occurs in markets with extremely low liquidity or during periods when market participants are completely uncertain about direction. While rare in active markets like major cryptocurrency pairs, Four-Price Doji patterns can appear in less liquid altcoins or during holiday trading periods. Due to its rarity and the minimal information it provides, this pattern is generally considered less actionable than other Doji variations.
Dragonfly Doji
The Dragonfly Doji features opening and closing prices at or near the highest price of the session, with a long lower shadow and little to no upper shadow. The pattern resembles a "T" shape, with the horizontal line at the top.
This formation indicates that sellers pushed prices significantly lower during the session, but buyers stepped in forcefully to drive prices back up to the opening level by the close. The Dragonfly Doji is considered a bullish reversal signal, especially when it appears after a downtrend or at a support level. It demonstrates that selling pressure was met with strong buying interest, suggesting that bearish momentum may be exhausting. Traders often look for confirmation in the form of a bullish candle following the Dragonfly Doji before entering long positions.
Gravestone Doji
The Gravestone Doji is the inverse of the Dragonfly Doji. It features opening and closing prices at or near the lowest price of the session, with a long upper shadow and minimal or no lower shadow. The pattern resembles an inverted "T" or a gravestone, hence its name.
This formation shows that buyers pushed prices significantly higher during the session, but sellers regained control and drove prices back down to the opening level by the close. The Gravestone Doji is typically interpreted as a bearish reversal signal, particularly when it appears after an uptrend or at a resistance level. It suggests that buying pressure was met with overwhelming selling interest, indicating that bullish momentum may be waning. Confirmation through a subsequent bearish candle strengthens the signal for potential short positions.
How to Trade with Doji Candles
Wait for Confirmation
Doji candles represent indecision rather than definitive directional signals. Never enter trades based solely on a Doji formation. Instead, wait for the next candlestick to confirm the direction. A bullish candle following a Dragonfly Doji confirms buying pressure, while a bearish candle after a Gravestone Doji validates selling momentum. This confirmation approach significantly reduces false signals and improves trade accuracy.
Use at Support and Resistance Zones
Doji patterns carry much greater significance when they appear at key price levels. A Doji forming near a major support level suggests that selling pressure is meeting buying interest, potentially signaling a bounce. Conversely, a Doji at resistance indicates that buying momentum is encountering selling pressure, possibly leading to a reversal. Always analyze the broader price structure and identify these critical zones before interpreting Doji signals.
Combine with Volume and Other Indicators
Enhance the reliability of Doji signals by incorporating volume analysis and technical indicators. A Doji accompanied by high trading volume carries more weight than one with low volume, as it indicates genuine market participation and indecision. Additionally, use momentum indicators like RSI (Relative Strength Index) or MACD (Moving Average Convergence Divergence) to confirm whether the market is overbought or oversold. Combining multiple analytical tools creates a more robust trading framework.
Doji candles often appear as the middle component of powerful reversal patterns such as the Morning Star (bullish) or Evening Star (bearish). In these three-candle formations, the Doji represents the transition point between the previous trend and the new direction. The Morning Star pattern (downtrend candle + Doji + uptrend candle) signals bullish reversal, while the Evening Star (uptrend candle + Doji + downtrend candle) indicates bearish reversal. These multi-candle patterns provide stronger signals than isolated Doji formations.
Intraday Trading Applications
For scalping and short-term trading strategies, Doji candles can provide quick entry and exit opportunities. However, Doji patterns on smaller timeframes (1-minute, 5-minute charts) are generally less reliable due to market noise and reduced significance. When trading intraday with Doji signals, always combine them with additional confirmation such as price action context, volume spikes, or breakouts from consolidation zones. Set tight stop-losses to manage the higher risk associated with short-term trading.
Implement Proper Stop-Loss Placement
Risk management is crucial when trading Doji patterns. Place stop-loss orders just beyond the extreme points of the Doji's shadows. For long positions based on a Dragonfly Doji, set the stop slightly below the low of the lower shadow. For short positions based on a Gravestone Doji, place the stop just above the high of the upper shadow. This approach limits potential losses if the anticipated reversal fails to materialize.
Consider Partial Positions and Trend Continuation
Recognize that Doji patterns within strong trends often represent temporary pauses rather than reversals. In such cases, the trend typically continues after a brief consolidation. Consider using partial position sizing when trading Doji signals—enter with a smaller position initially and add to it if the anticipated move confirms. This strategy balances the opportunity to profit from reversals while protecting against false signals during trend continuations.
The Psychology Behind Doji Candles
The power of Doji candlestick patterns lies in their ability to reveal the psychological balance between market participants. A Doji formation captures a moment of equilibrium where bullish and bearish forces are equally matched, reflecting collective uncertainty about future price direction.
During the formation of a Doji, buyers periodically push prices higher, demonstrating their willingness to accumulate at current levels. Simultaneously, sellers pull prices lower, showing their eagerness to distribute holdings. This tug-of-war continues throughout the trading session, with neither side gaining lasting control. Ultimately, the closing price returns to or near the opening level, symbolizing a temporary stalemate.
When a Doji appears after a sustained trend, it frequently signals a shift in market sentiment. In a strong uptrend, a Doji indicates that bullish momentum is encountering significant resistance from bears who believe prices have risen too far. This hesitation suggests that the buying enthusiasm that drove the trend may be waning, and profit-taking or short-selling interest is emerging.
Conversely, a Doji following a downtrend reveals that selling pressure is meeting renewed buying interest. Bears who pushed prices lower are now facing bulls who perceive value at these reduced levels. This psychological shift from fear to cautious optimism often precedes trend reversals.
Understanding the emotional dynamics behind Doji patterns helps traders anticipate how market participants might react to subsequent price action. The pattern essentially asks: "Will buyers or sellers gain control next?" The answer, revealed by the following candles, determines the optimal trading strategy.
Limitations of Doji Candles
Not a Standalone Guarantee
Doji patterns do not guarantee trend reversals or significant price movements. They merely indicate indecision and potential turning points. Many Doji formations are followed by trend continuations rather than reversals. Traders must avoid the misconception that every Doji signals an immediate trading opportunity. Context, confirmation, and supporting analysis are essential.
Misleading Signals in Low Liquidity
In assets with low trading volume or during off-peak hours, Doji patterns may appear frequently but carry little significance. These formations can result from random price fluctuations rather than genuine market indecision. Similarly, on very small timeframes (such as 1-minute charts), Doji candles are abundant and often represent market noise rather than meaningful signals. Focus on Doji patterns in liquid markets and on higher timeframes for more reliable interpretations.
Abundance in Sideways Markets
During periods of consolidation or range-bound trading, Doji candles appear regularly because the market lacks directional conviction. In these conditions, indecision is the norm rather than a special signal. Trading every Doji in a sideways market leads to overtrading and poor results. Reserve Doji-based strategies for trending markets where these patterns represent genuine shifts in momentum.
Timing Challenges
Waiting for confirmation after a Doji pattern can result in less favorable entry prices. By the time a confirming candle appears, the anticipated move may already be underway, reducing potential profit margins. This delay is a necessary trade-off for increased reliability, but it highlights the challenge of balancing risk and reward when trading Doji signals.
Misidentification of Candle Types
Distinguishing Doji patterns from similar candlestick formations requires careful observation. A candle with a very small body might be mistaken for a Doji, or vice versa. Different charting platforms may also display candles slightly differently based on their rendering algorithms. Traders must develop skill in accurately identifying true Doji patterns to avoid false signals.
Need for Comprehensive Analysis
Doji candles should never be analyzed in isolation. They must be evaluated within the broader context of trend direction, momentum indicators, volume patterns, support and resistance levels, and fundamental news flow. A Doji that appears significant in isolation may be irrelevant when considered alongside other market factors. Successful trading requires integrating candlestick patterns into a holistic analytical framework.
Emotional Bias Risk
Traders often project their own expectations onto Doji patterns, interpreting them in ways that confirm pre-existing biases. A trader who is bullish may see a Doji as a bullish signal, while a bearish trader might interpret the same pattern as bearish. This subjective interpretation undermines the objectivity needed for consistent trading success. Develop clear, rule-based criteria for interpreting Doji patterns to minimize emotional influence.
Conclusion
Doji candlestick patterns, while not the most powerful standalone indicators of price movement, serve as valuable tools when evaluated within broader market contexts. These formations excel at highlighting moments of indecision and potential trend transitions, providing traders with early warnings to reassess their positions and strategies.
The true strength of Doji analysis lies in its integration with comprehensive technical analysis. When combined with trend identification, volume analysis, momentum indicators, and key support/resistance levels, Doji patterns become part of a robust trading framework that enhances decision-making accuracy.
Different types of Doji candles—Neutral, Long-Legged, Four-Price, Dragonfly, and Gravestone—each carry distinct implications based on their structure and context. Understanding these variations allows traders to interpret market psychology more accurately and anticipate potential price movements with greater confidence.
However, traders must remain aware of the limitations inherent in Doji pattern analysis. These formations require confirmation, lose reliability in low-liquidity environments, and can be misleading in sideways markets. Proper risk management through strategic stop-loss placement and position sizing is essential when trading based on Doji signals.
Ultimately, a Doji candle is not a definitive buy or sell signal but rather a call for heightened attention and careful analysis. It represents a delicate balance in the market—a moment of pause where the next move could determine the direction of the trend. By respecting both the insights and limitations of Doji patterns, traders can incorporate them effectively into their analytical toolkit, improving their ability to navigate the complexities of cryptocurrency and financial markets with greater skill and confidence.
FAQ
What is a Doji Candlestick? What are its characteristics and pattern features?
A Doji candlestick forms when opening and closing prices are nearly identical, indicating market indecision. It features a small body with long upper and lower wicks, signaling potential trend reversals. Doji patterns reveal equilibrium between buyers and sellers, commonly used by traders to identify turning points.
How to identify and apply Doji candlestick patterns in trading?
Doji candles feature minimal or no body, showing opening and closing prices nearly identical, indicating market indecision. Identify by the small body and long wicks. Combine with support levels and other indicators like RSI or moving averages to confirm reversal signals for better trading decisions.
What are the different types of Doji candlesticks (such as Dragonfly Doji, Long-legged Doji, etc.)?
Doji candlesticks include several types: Dragonfly Doji with long lower wicks, Gravestone Doji with long upper wicks, and Long-legged Doji with extended upper and lower shadows. Each reflects different market uncertainty and potential reversal signals in trading.
Doji烛线出现时通常预示什么市场信号?
Doji烛线通常预示市场中性和不确定性,特别是在趋势高点或低点出现时。它表明买卖双方力量均衡,可能预示趋势反转,是重要的技术分析信号。
How to apply Doji in different market trends (uptrend, downtrend, consolidation)?
In uptrends, Doji signals potential reversal or consolidation before continuation. In downtrends, it indicates possible bottom formation or pause. During consolidation, Doji confirms indecision and breakout preparation. Traders use Doji with support/resistance levels for entry signals across all three trends.
What is the difference between Doji candlesticks and other reversal signals such as hammer patterns and engulfing patterns?
Doji candlesticks feature equal open and close prices, signaling market indecision. Hammer patterns show strong bottom reversals with long lower wicks and small bodies. Engulfing patterns demonstrate powerful trend reversals when one candle completely engulfs the previous one's body, indicating shifted momentum.
When trading with Doji, how to set stop loss and risk management?
Place stop loss between Doji high and previous candle high. Use higher timeframes like daily or weekly charts. Risk management involves fixing position size relative to stop loss distance, ensuring risk-reward ratio exceeds 1:2 for optimal trading outcomes.
How reliable are Doji candlesticks across different time periods (minute, hourly, daily charts)?
Doji candlesticks show higher reliability on shorter timeframes like minute and hourly charts, where they effectively signal indecision and potential reversals. On daily and longer timeframes, their reliability significantly diminishes. For optimal results, combine Doji patterns with volume analysis and support/resistance levels across all timeframes.
How to avoid false signals from Doji candlesticks?
Combine Doji patterns with volume analysis and moving averages to confirm signals. Verify price action and volume changes before trading. Avoid relying solely on Doji patterns for trading decisions.
What is the trading strategy combining Doji candlesticks with other technical indicators such as moving averages and support/resistance levels?
Doji candles combined with moving averages and support/resistance levels confirm potential trend reversals or continuations. Use Doji at support/resistance breaks as entry signals, align with moving average crossovers for confirmation, and manage risk at key levels.
* The information is not intended to be and does not constitute financial advice or any other recommendation of any sort offered or endorsed by Gate.