This comprehensive guide explores the Doji candlestick pattern, a fundamental technical analysis tool that signals market indecision when opening and closing prices converge, creating minimal body with extended wicks. The article examines five distinct Doji variations—Neutral, Long-Legged, Four-Price, Dragonfly, and Gravestone—each revealing different market psychology and reversal probabilities. Learn proven trading strategies including confirmation requirements, support/resistance integration, volume analysis, and proper stop-loss placement to maximize profitability on Gate trading platform. The guide addresses critical limitations such as false signals in low-liquidity conditions and abundant patterns in sideways markets, emphasizing the necessity of combining Doji signals with additional technical indicators and comprehensive market context. Master Doji pattern recognition to identify high-probability trading opportunities while managing risk effectively across various timeframes and market conditions.
What is a Doji Candle?
A Doji candle is a candlestick chart formation that represents market neutrality and indecision. Market neutrality occurs when buyers and sellers are in equilibrium, resulting in minimal price movement during the trading period. This balance creates a unique visual pattern that provides valuable insights into market psychology and potential trend changes.
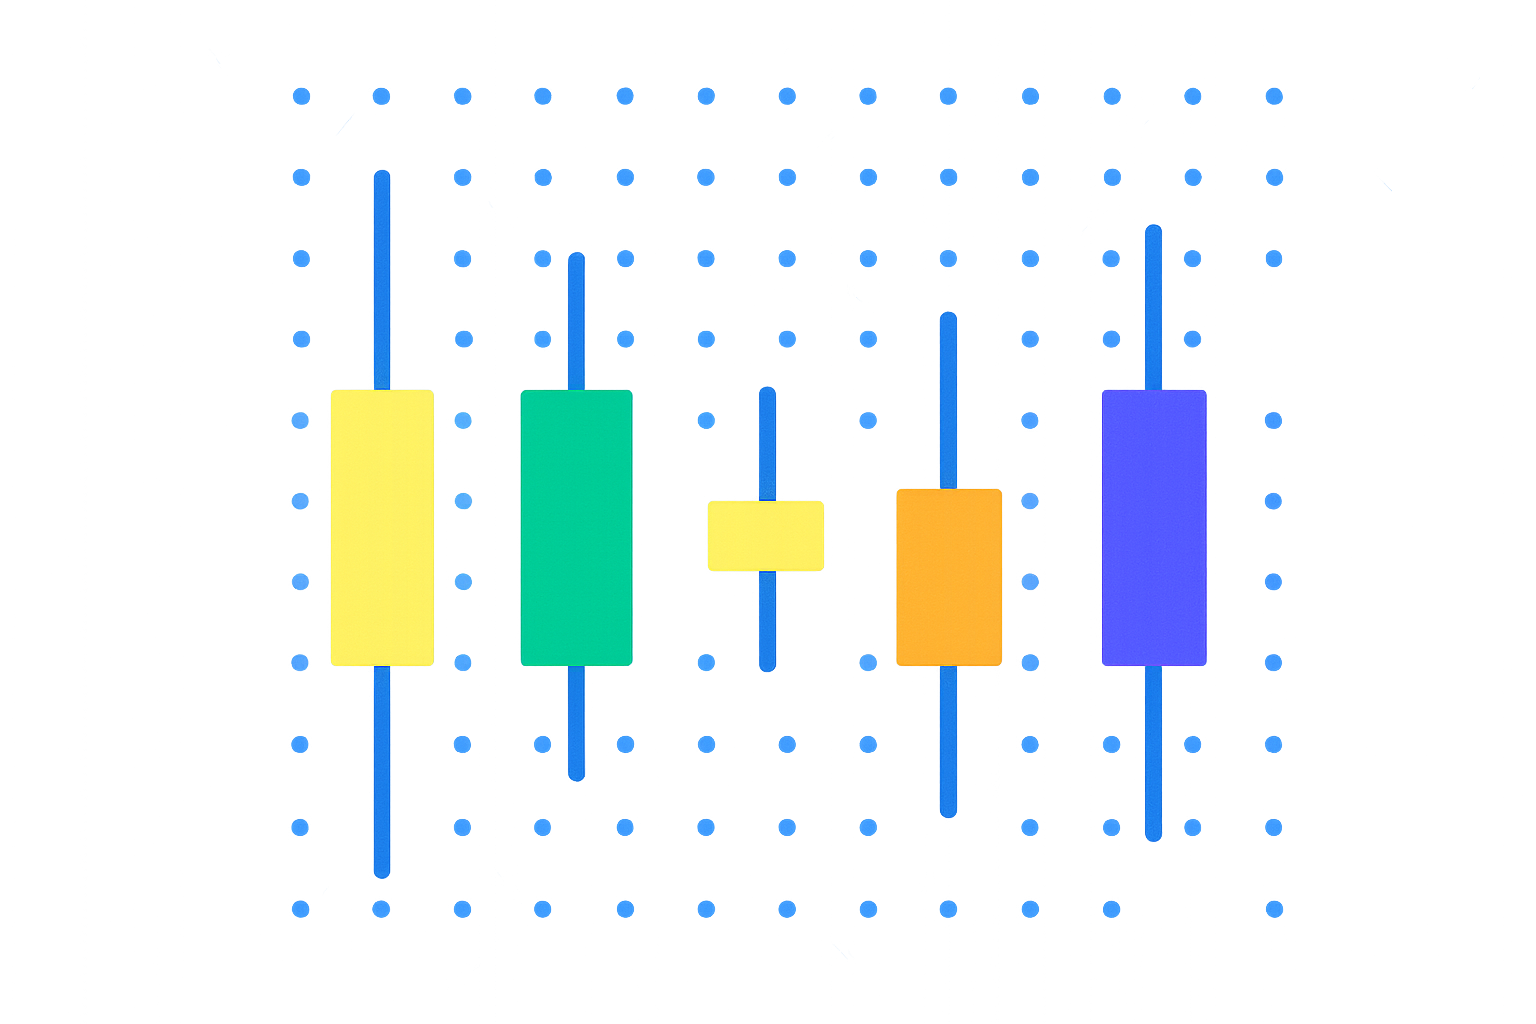
Candlestick chart formations provide information about price movements during a specific trading period. Each candle contains four fundamental pieces of information that traders use to analyze market behavior:
- Opening price of the period (shown at the top of the candle body)
- Closing price of the period (indicated by the line at the bottom of the candle body)
- Highest price during the period (at the end point of the upper wick)
- Lowest price during the period (at the end point of the lower wick)
When the opening and closing prices are very close to each other or identical, the candle is represented by wicks but has no body. This formation is called a Doji candle. The lack of a real body signifies that despite price fluctuations during the session, the market closed at or near its opening level, indicating a standoff between bulls and bears.
History of Doji Candles
The origins of candlestick chart formations are widely attributed to Japan, with the methodology being introduced to the Western world through Steve Nison's pioneering work on Japanese candlestick charting techniques. This ancient form of technical analysis has been used by Japanese rice traders for centuries before gaining international recognition.
In Japanese, the word "doji" translates to "mistake" or "error." This name was given to represent a special candlestick formation that symbolizes the mistakes traders inadvertently make when market indecision occurs. The term reflects the uncertainty and potential for misjudgment that exists when the market shows no clear directional bias. Understanding this etymology helps traders appreciate the cautionary nature of Doji patterns in technical analysis.
Neutral Doji
The Neutral Doji, also known as the Standard Doji, indicates that opening and closing prices are identical, with wicks of equal length extending both above and below. This pattern demonstrates that neither bulls nor bears have gained dominance during the trading period. The symmetrical nature of the wicks shows that both buying and selling pressure were tested equally but ultimately neutralized.
This formation serves as a clear signal of market indecision and hesitation. When a Neutral Doji appears, it suggests that traders are uncertain about the next directional move. In the context of a trending market, a Neutral Doji can indicate that the current trend is losing momentum and a potential reversal or consolidation period may be approaching. The equal-length wicks demonstrate that the market explored both higher and lower prices with equal intensity before settling back at the opening level.
Long-Legged Doji
The Long-Legged Doji resembles the Neutral Doji but features significantly longer wicks extending from both sides of the opening/closing price point. This extended wick length indicates that considerably more volatility occurred during that trading period compared to a standard Neutral Doji. The dramatic price swings represented by the long wicks show intense battle between buyers and sellers.
This pattern is particularly significant because it reveals extreme market indecision combined with high volatility. The long upper wick demonstrates that bulls attempted to push prices significantly higher, while the long lower wick shows bears tried to drive prices much lower. Despite these aggressive moves in both directions, the session closed at or near the opening price, indicating complete equilibrium. Long-Legged Dojis often appear at market turning points or during periods of significant uncertainty, such as before major economic announcements or during consolidation phases within strong trends.
Four-Price Doji
The Four-Price Doji is an extremely rare formation characterized by the complete absence of wicks, displaying only the opening and closing price as a single horizontal line. This pattern indicates that the opening, closing, highest, and lowest prices are all identical throughout the entire trading period. In markets with high trading volume, this formation is exceptionally uncommon.
The Four-Price Doji typically occurs in very low liquidity conditions or in markets with minimal trading activity. When it does appear in more liquid markets, it represents an extraordinary level of price stability and lack of volatility. This pattern is most commonly seen in smaller timeframes or in thinly traded assets. While theoretically significant, its rarity and the conditions under which it appears make it less practically useful for most trading strategies compared to other Doji variations.
Dragonfly Doji
The Dragonfly Doji is characterized by opening and closing prices that coincide with the highest price of the period. The majority or entirety of the wick extends downward from this point, creating a shape reminiscent of a dragonfly. This pattern is most frequently observed when a market direction change is approaching, particularly when it appears after a downtrend.
The Dragonfly Doji tells a powerful story of market psychology. The long lower wick demonstrates that sellers aggressively pushed prices down during the session, but buyers responded with equal or greater force, driving prices back up to close at or near the session high. This rejection of lower prices and strong buying pressure at the lows suggests that selling momentum is exhausted and buyers are gaining control. When this pattern appears at support levels or at the bottom of a downtrend, it can signal a potential bullish reversal. The longer the lower wick, the more significant the rejection of lower prices and the stronger the potential reversal signal.
Gravestone Doji
The Gravestone Doji is the inverse of the Dragonfly Doji, featuring opening and closing prices near the lowest price level while displaying a long upper wick. This pattern resembles a gravestone or inverted T, hence its name. It is typically observed at the end of an uptrend and can serve as a bearish market signal indicating potential trend reversal.
The formation of a Gravestone Doji reveals that buyers attempted to push prices significantly higher during the session, but sellers overwhelmed this buying pressure and drove prices back down to close at or near the session low. This rejection of higher prices demonstrates that buying momentum is weakening and sellers are gaining strength. When this pattern appears at resistance levels or at the top of an uptrend, it suggests that the bullish trend may be exhausted and a bearish reversal could be imminent. The longer the upper wick, the more significant the rejection of higher prices and the stronger the bearish signal. Traders often view Gravestone Dojis as warning signs to consider taking profits on long positions or preparing for potential short opportunities.
How to Trade with Doji Candles
Wait for Confirmation
Never act on a Doji candle alone. Always wait for the next candle's direction to confirm the signal. A bullish confirmation candle following a Dragonfly Doji at support strengthens the reversal signal, while a bearish candle after a Gravestone Doji at resistance confirms potential downward movement. This confirmation approach reduces false signals and improves trading accuracy.
Use at Support and Resistance Zones
Doji patterns are significantly more meaningful when they appear at key price levels such as support and resistance zones, previous highs and lows, or Fibonacci retracement levels. A Doji forming at a well-established support level carries much more weight than one appearing in the middle of a trend with no significant price level nearby. Context is crucial for interpreting Doji significance.
Combine with Volume and Other Indicators
Integrating Doji analysis with volume data and technical indicators like RSI, MACD, or moving averages substantially increases confidence in your trading decisions. For example, a Dragonfly Doji accompanied by high volume and an oversold RSI reading provides a much stronger bullish signal than the Doji alone. Multiple confirming factors create more reliable trading opportunities.
Doji candles often appear as the middle component in powerful reversal patterns such as the Morning Star (bullish reversal) or Evening Star (bearish reversal). In these three-candle formations, the Doji represents the transition point between the old trend and the new direction. Recognizing these complete patterns provides higher-probability trading setups than isolated Doji candles.
Intraday Trading Applications
For scalping or short-term trading strategies, Doji patterns can signal quick entry and exit opportunities. Day traders often use Doji formations on lower timeframes (5-minute, 15-minute charts) to identify brief periods of consolidation before continuation moves or minor reversals. However, shorter timeframes generate more noise, so additional confirmation becomes even more critical.
Implement Stop Loss Protection
Always use stop loss orders to limit potential losses when trading Doji patterns. Position your stop just beyond the extreme point of the Doji's wick. For a Dragonfly Doji signaling a potential upward reversal, place the stop slightly below the low of the lower wick. For a Gravestone Doji indicating potential downward movement, position the stop just above the high of the upper wick. This approach provides protection while giving the trade room to develop.
Consider Partial Positions and Trend Continuation
In strong trending markets, a Doji often represents merely a pause or consolidation rather than a reversal. In such cases, consider taking partial positions or using smaller position sizes until additional confirmation emerges. Strong trends can resume after brief Doji-indicated pauses, so maintaining flexibility in position sizing helps manage risk while staying aligned with the dominant trend direction.
Psychology Behind Doji Candles
The power of the Doji candle lies in its ability to reveal the psychological balance between traders in the market. During Doji formation, buyers periodically push prices upward while sellers pull them downward, ultimately resulting in a close at or near the opening price. This equilibrium represents a critical moment of market indecision where neither side has gained clear control.
A Doji appearing after a trend frequently signals a shift in market sentiment and momentum. In a strong uptrend, a Doji indicates that bullish momentum has encountered significant bearish resistance, suggesting that buyers may be losing conviction or that sellers are becoming more aggressive. Similarly, a Doji after a downtrend shows that selling pressure is meeting strong buying interest, potentially indicating that the downward move is losing steam.
Understanding this psychological dynamic helps traders interpret Doji patterns more effectively. The indecision represented by a Doji often precedes significant moves, as the market resolves the standoff between bulls and bears. Traders who recognize this psychological transition point can position themselves advantageously for the next directional move. The key is recognizing that indecision itself is information—it tells us that the previous trend or directional bias is being challenged and that market participants are reassessing their positions.
Limitations of Doji Candles
Not a Guarantee by Itself
A Doji pattern does not guarantee a trend reversal or significant price movement. Many Doji formations result in trend continuation rather than reversal, particularly in strong trending markets. Traders must view Doji patterns as signals requiring additional confirmation rather than definitive trading triggers. Relying solely on Doji patterns without supporting analysis leads to poor trading decisions and unnecessary losses.
Misleading Signals in Low Liquidity
In assets with low trading volume or during off-peak trading hours, Doji patterns can lose their significance due to market noise and thin liquidity. Price movements in low-liquidity conditions often reflect individual large orders rather than genuine market sentiment shifts. Therefore, Doji patterns appearing in thinly traded markets or during low-volume periods should be treated with increased skepticism and require stronger confirmation before acting upon them.
Abundance of Dojis in Sideways Markets
During ranging or consolidating markets, Doji candles appear frequently as indecision becomes the norm rather than the exception. In these conditions, the proliferation of Doji patterns dilutes their significance, as they simply reflect the ongoing lack of directional bias rather than signaling an impending change. Traders should be cautious about over-interpreting Doji patterns in clearly sideways markets and focus instead on breakout signals from the range.
Speed Requirements and Timing Challenges
Waiting for confirmation of a Doji signal sometimes results in entering trades at less favorable prices. By the time a confirmation candle completes, a significant portion of the anticipated move may have already occurred, reducing the risk-reward ratio of the trade. This timing challenge requires traders to balance the need for confirmation with the desire to enter at optimal price levels, sometimes requiring partial position entries or accepting slightly worse entry prices for increased probability of success.
Misidentifying Candle Types
Distinguishing Doji patterns from similar formations, particularly spinning tops, is crucial for accurate analysis. A spinning top has a small real body, while a true Doji has virtually no body with opening and closing prices at or extremely near the same level. Misclassifying these patterns leads to incorrect interpretations and poor trading decisions. Traders must develop the skill to accurately identify true Doji formations and understand the subtle differences between various candlestick patterns.
See the Complete Picture
Doji patterns must be evaluated within the broader context of trend analysis, momentum indicators, volume patterns, and relevant news flow. Isolating Doji analysis from other technical and fundamental factors creates an incomplete and potentially misleading picture of market conditions. Successful trading requires integrating Doji signals with comprehensive market analysis, including overall trend direction, key support and resistance levels, volume characteristics, and broader market sentiment.
Emotional Bias
Traders often project their own expectations and biases onto Doji patterns, interpreting them optimistically or pessimistically based on existing positions or preconceived market views. This emotional interpretation leads to selective perception, where traders see what they want to see rather than objectively analyzing what the pattern actually indicates. Maintaining objectivity and following a systematic approach to Doji interpretation helps overcome this psychological challenge and improves trading consistency.
Conclusion
Doji candles are not the most powerful indicator for any price movement in isolation. However, when evaluated in conjunction with broader market conditions, trend analysis, volume patterns, and other technical indicators, they can provide valuable assistance in anticipating trend changes and identifying potential reversal points. The Doji reflects the delicate balance and hesitation in the market—despite being a small formation, it carries significant meaning.
Successful traders understand that Doji patterns represent moments of equilibrium and transition in market psychology. These candlestick formations serve as warning signals that the existing market dynamic may be shifting, prompting traders to reassess their positions and prepare for potential directional changes. By combining Doji analysis with comprehensive technical analysis, proper risk management, and disciplined trading execution, traders can incorporate these patterns into effective trading strategies.
The key to profiting from Doji patterns lies not in treating them as definitive signals, but rather as pieces of a larger analytical puzzle. When a Doji appears at a significant price level, is confirmed by subsequent price action, is supported by volume analysis, and aligns with other technical indicators, it becomes a valuable tool for identifying high-probability trading opportunities. Mastering Doji pattern recognition and interpretation requires practice, patience, and a commitment to viewing these formations within their complete market context.
FAQ
What is a Doji Candlestick? What are the definition and characteristics of Doji patterns?
A Doji candlestick is a technical analysis pattern where opening and closing prices are identical or very close, creating no real body. It features only upper and lower wicks, indicating market indecision. Long wicks suggest strong pressure or support, signaling potential price reversals or trend changes.
How to identify different types of Doji patterns (long-legged Doji, dragonfly Doji, gravestone Doji, etc.)?
Long-legged Doji has extended upper and lower wicks with equal length. Dragonfly Doji features a long lower wick and short upper wick, indicating bullish reversal. Gravestone Doji has a long upper wick and minimal lower wick, signaling bearish reversal. Classic Doji shows balanced wicks of similar length.
What signal does a Doji candlestick represent in trading? How should traders make trading decisions based on Doji?
Doji represents market indecision and potential trend reversal. Traders should confirm with the next candle and combine other technical indicators before making decisions. A single Doji is insufficient for trading decisions alone.
What is the difference in trading effectiveness of Doji patterns across different timeframes (daily, 4-hour, 1-hour)?
Doji patterns show varying effectiveness across timeframes. Daily charts provide stronger signals for long-term trend reversals, while 4-hour and 1-hour frames generate more frequent signals suitable for short-term trading. Lower timeframes offer more opportunities but require tighter stops, whereas daily timeframes deliver more reliable reversal confirmation with higher conviction trades.
What risks and false signals should be noted when trading with Doji patterns?
When trading Doji patterns, watch for false breakouts in ranging markets and whipsaw reversals. Low trading volume weakens signal reliability. Doji alone isn't conclusive; combine with support/resistance levels and volume confirmation for better accuracy.
What is the best way to use Doji candlesticks in combination with other technical indicators such as support and resistance levels and moving averages?
Combine Doji signals with support and resistance levels to identify key reversal points. Use moving averages to confirm trend direction. When Doji forms near support or resistance with MA alignment, trading opportunities strengthen significantly.
What is the difference in the meaning of Doji patterns in uptrends and downtrends?
In an uptrend, a Doji signals potential reversal or hesitation before a downturn. In a downtrend, it suggests possible trend continuation or indecision. Both indicate market uncertainty where opening and closing prices are nearly equal, but their predictive significance depends on the preceding trend direction.
Professional traders place stop-loss orders at Doji highs and lows, using previous candle extremes as reference points. Take-profit targets are set based on Doji pattern highs and lows. This approach captures reversals while managing risk effectively on higher timeframes like daily or weekly charts.
* The information is not intended to be and does not constitute financial advice or any other recommendation of any sort offered or endorsed by Gate.