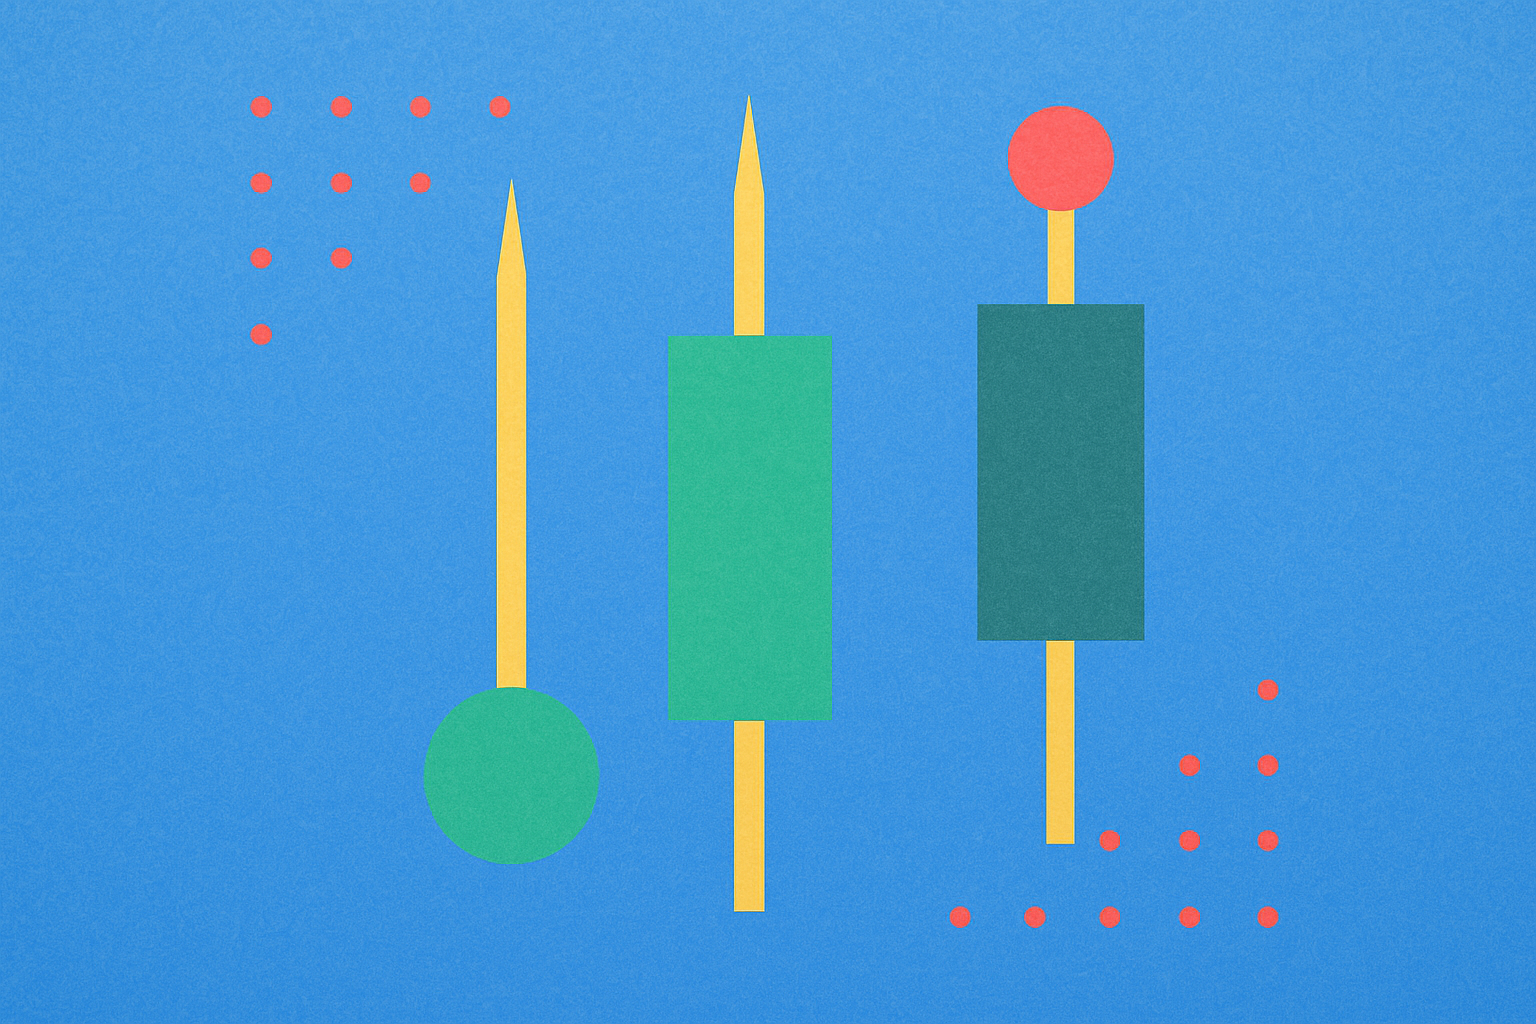
Master long wick candlestick patterns, commonly called John Wick candles, to identify powerful trend reversals in crypto trading. This comprehensive guide explains how long wicks form when price aggressively rejects dominant trends, with bullish Hammer patterns appearing at trend bottoms and bearish Shooting Star patterns at peaks. Learn to identify these formations using the 2-3x body length rule, understand the intense buyer-seller psychology behind each pattern, and execute disciplined trades on Gate. Discover critical confirmation strategies, optimal timeframe selection, and proper stop-loss placement near wick extremes. Explore limitations in low-liquidity and choppy markets, and combine this pattern with additional technical indicators for enhanced signal reliability and consistent alpha generation in volatile market conditions.
Key Points
The long wick candle, commonly referred to as the "John Wick" candle in crypto markets, represents a powerful trend reversal signal that visualizes the intense battle between buyers and sellers.
- A long wick indicates that price was aggressively rejected in the direction of the dominant trend, with momentum rapidly shifting to the opposite side.
- Bullish patterns (Hammer) and bearish patterns (Shooting Star) typically appear at trend peaks or bottoms, providing strong reference points for trading decisions.
- For strategic entry, it is critical to wait for confirmation candles and support from technical indicators after the long wick formation.
- Signal reliability decreases rapidly in contextless conditions such as low liquidity, news-driven volatility, or sideways markets.
For traders seeking to capture trend reversals, the "John Wick" candle can generate short-term alpha when used with disciplined risk management and proper confirmation.
If you've heard traders mention the "John Wick" candle on social media platforms and wondered what it means, you're in the right place. The "John Wick" candle is a popular nickname for one of the most powerful reversal signals in technical analysis: the long wick candle. In this comprehensive guide, we'll explore why it earned this name and how you can trade this formation like a professional.
In candlestick charts, price sometimes leaves a dramatic "tail" or long wick on a candle. Traders pay close attention when they spot these formations because a long wick can signal a potential trend reversal or significant shift in market sentiment.
So what exactly is a long wick candle and how do you trade it? Some traders jokingly call it the "John Wick candle" because, like the film character known for swift and sudden reversals, a long wick represents a violent directional change in the market during the same period.
Understanding long wick candles is crucial for crypto traders because these candles reveal the battle between buyers and sellers. They typically emerge at the peak or bottom of a trend. In this article, we'll explain what a long wick candle is, why it forms, the psychology behind it, how to easily identify them, and how to trade based on these wicks.
What Is a Long Wick Candle?
Traders recognize the long wick candle formation as a signal that the current trend may reverse. It is one of the most iconic candlestick patterns and derives its name from the distinctive long wick attached to its body.
A long wick below the candle body indicates that sellers pushed the price down, but buyers remained strong and pulled the price back up.
A bullish reversal signal with a long wick typically appears at the end of a downtrend. This candle is commonly called a Hammer and features a small body, little to no upper shadow, and a long lower wick. It shows that sellers attempted to drive the price down, but buyers stepped in forcefully to close the price higher.
Conversely, a bearish reversal signal with a long wick emerges at the end of an uptrend. This candle is usually called a Shooting Star and has a small body at the bottom, minimal lower shadow, and a long upper wick. It demonstrates that buyers tried to push the price higher, but sellers took control and pulled the price back down.
Why Is It Called the "John Wick" Candle? The Psychology Behind the Name
In the technical analysis world, among boring terms like stochastic oscillators and Bollinger bands, a name like "John Wick" candle immediately grabs attention: Modern, memorable, and intriguing. But this isn't entirely random or just a cool nickname; it's an almost perfect metaphor for the violent and sudden market movement this candle represents.
To truly understand the meaning of the name, you need to know the character: John Wick.
The cinematic character portrayed by Keanu Reeves, John Wick, is not just an assassin; he's the assassin sent to kill other assassins. He's like a force of nature—known for ruthless efficiency, unwavering focus, and the ability to turn seemingly impossible situations around. When he enters the fight, the direction of battle shifts suddenly and violently.
Now project this character profile onto a price chart.
The "John Wick" candle formation captures exactly this story. It symbolizes a moment of extreme conflict in the market, representing a powerful and ruthless rejection.
1. Long Wick = The Weapon of Rejection
The candle's most striking feature is its long wick (shadow). This wick isn't just a line; it's the trace of a violent battle.
-
In an uptrend (Bearish "John Wick" / Shooting Star): The long upper wick shows that bulls aggressively pushed the price higher. Everything seemed to be in their control, but then bears (sellers) slammed them against the wall, causing a massacre in price.
-
In a downtrend (Bullish "John Wick" / Hammer): The long lower wick tells the opposite story. Bears were completely dominant, dragging the price to new lows. At that moment, bulls entered the market forcefully, clearly defeating the selling pressure and pulling the price back up.
In both cases, the long wick is the weapon of rejection. It expresses a complete and decisive rejection of the current trend's progression.
2. Small Candle Body = The Professional Assassin's Efficiency
A classic John Wick candle has a relatively small real body compared to its wick; this is a critical element. Although the price fluctuated dramatically during the session, the opening and closing prices are very close to each other.
This isn't a prolonged battle; it's like a professional assassination. The war ends quickly and decisively in a single session. The small body demonstrates the efficiency and precision of the reversal. It indicates that the counterattack was so powerful that it almost completely erased the dominant trend's progress.
3. The Outcome = A Violent and Decisive Reversal
When John Wick finishes a fight, the winner is clear. The same applies to the candle bearing his name: it signals a probable and high-probability reversal.
The psychology it creates is very powerful:
- Traders positioned with the current trend are now trapped in losing positions.
- Traders waiting on the sidelines now see a clear signal that the balance of power has shifted.
- The market witnesses an extraordinary show of force from the opposing side.
This is why traders have embraced this name. When this candle appears on a chart, what you feel inside is a true John Wick moment—resulting in a quick, violent, and decisive victory.
The Psychology of Long Wick Candles
Long wick candles reveal market psychology's interpretation in both bullish and bearish directions within a single bar.
-
Bullish Long Wick (Long Lower Shadow): Appears in a downtrend. Sellers rapidly pull the price down, but buyers step in and push the price back up toward the close. It means lower prices were rejected, signaling the trend may be ending and presenting a buying opportunity.
-
Bearish Long Wick (Long Upper Shadow): Seen in an uptrend. Buyers rapidly push the price higher, but sellers respond and bring the close near the opening. It shows bulls are losing strength and bears are regaining control.
-
Spinning Top Candles (Long Wicks on Both Ends): Features long wicks on both ends with a small body; indicates indecision and typically precedes a trend reversal. Confirmation from the next candle is needed to determine direction.
Understanding long wick candles prevents hasty decisions and emphasizes the importance of confirmation signals. It serves as an alert to tighten stops, take profits, or reverse positions, enabling traders to act effectively during emotional market fluctuations.
What Happens If a Candle Has Long Wicks on Both Top and Bottom?
Spinning Top
Some candles have very long shadows on both the top and bottom. However, these candles are not classic long wick candles but are called "spinning tops." The candle body is typically small. The lengths of the upper and lower wicks are usually not equal, though sometimes the difference can be hard to determine.
A spinning top formation shows that buyers and sellers are indecisive. The long upper and lower wicks indicate no significant price change occurred. Spinning tops generally suggest the trend may change direction or sideways movement may begin. If the spinning top is a reversal signal, green suggests a probable bullish reversal, while red indicates a probable bearish signal.
How to Identify a Long Wick Candle?
Here are examples of bullish and bearish long wick candles that traders can use as reference. These candles are easy to spot thanks to their long wicks at the bottom. However, the appearance of a long wick candle does not guarantee the trend will reverse.
Bullish Long Wick Candle
A long wick candle forms after a downtrend. This is a bullish reversal signal indicating that the asset has bottomed and a price increase may follow. The long wick below the candle body shows that sellers pushed the price down, but buyers remained strong and pulled the price back up.
Bearish Long Wick Candle
A long wick candle appears after an uptrend. This is a bearish reversal signal indicating that the asset has peaked and a price decline may be coming. The long wick at the top of the candle shows that buyers tried to overpower sellers but ultimately sellers succeeded in pulling the price down.
How "Long" Is Long? A Practical Rule
A frequently asked question is how to determine if a wick is truly "long." While there's no official standard, a wick being at least 2 to 3 times the length of the candle body is a generally accepted measure.
- Strong Signal: If the wick is 3 times the body length, it's a strong rejection signal.
- Weak Signal: If the wick is only slightly longer, its significance decreases and caution is warranted.
The longer the wick, the more dramatic the price rejection and the stronger the reversal signal.
How to Trade with the "John Wick" (Long Wick) Candle Strategy?
When traders begin regularly identifying long candle formations, they should consider strategies for market entry and exit, as well as placing Stop Loss or Take Profit orders. Since the crypto market is volatile, stop or profit orders should not be placed too close to the entry price, otherwise they will trigger too quickly.
When trading with long wick candles, the Stop Loss is typically placed near the candle's closing price. Take Profit is somewhat more complex. For bullish and bearish long wick candles, profit targets are set according to support and resistance levels:
-
A resistance level is where an upward move is stopped by sellers, also known as a ceiling price. For bullish long wick candles, Take Profit orders should be placed near resistance levels.
-
A support level is where a decline is halted by buyers, representing a floor price. For bearish long wick candles, Take Profit orders are placed at support levels.
When to Trade a Long Wick Candle?
Traders should not open trades immediately after seeing a long wick candle. Additional confirmation from technical indicators, oscillators, or other analytical tools is needed to validate the trend reversal. Additionally, an appropriate timeframe can be selected based on strategy. Intraday traders can trade quickly with shorter periods (5-15 minutes). For most traders, timeframes of 1 hour and above are suitable. Beginners are advised to practice on demo platforms and develop their skills with low-volume trades.
Trading with a Bullish Long Wick Candle
The steps are as follows:
- The trader identifies a bullish candle with a long lower shadow at the end of a downtrend.
- Places a buy order near the candle's close.
- To limit losses, places a Stop Loss order at the bottom of the long wick.
- Places a Take Profit order. The target in the emerging uptrend should be a reasonable support level, which could be a previous low or the nearest strong support.
Trading with a Bearish Long Wick Candle
The steps are as follows:
- The trader identifies a bearish candle with a long upper shadow at the end of a trend.
- Places a sell order near the candle's close.
- To limit losses, places a Stop Loss order at the top of the candle's upper wick.
- For closing the position, the Take Profit order should be near a support level.
Limitations of the Long Wick Candle Strategy
Although long wick candles can generate useful signals, caution is required in certain situations:
-
Low Liquidity & Irregular Markets: Long wicks seen during low trading volume or quiet market hours may actually be noise and not genuine reversal signals. Don't trust wicks in low volume conditions.
-
Lack of Trend Context: The significance of a long wick decreases in horizontal or choppy markets. However, when it appears after a strong trend, it should be taken seriously.
-
Without Confirmation: Trading solely based on a long wick is risky. Always wait for a confirmation candle or additional indicators.
-
During Major News Events: Long wicks formed before or after major news can be misleading; price may return to previous levels.
-
Ignoring Other Indicators: Don't focus only on the wick; evaluate it together with other indicators and market structure. If there are conflicting signals, be more cautious.
-
Extreme Volatility: In highly volatile markets, long wicks can form frequently in both directions, making reversal tracking difficult. Avoid risk by using broader confirmation criteria or not trading at all.
-
Not a Guarantee: A long wick signals a possible reversal but is not guaranteed. A strong trend can continue despite the wick.
In conclusion, don't use the long wick candle strategy alone or in unsuitable market conditions. It's a tool that works best when combined with other analytical instruments. If conditions aren't right or the signal isn't clear, not trading is the wisest choice. There will always be new opportunities in the market.
Conclusion
Trading based on long wick candles can be quite profitable when properly identified and rules are followed consistently. Bullish long wicks typically appear at the end of declines, while bearish long wicks emerge at the peak of rallies. By learning about bullish long wicks (Hammer), bearish long wicks (Shooting Star), and the psychology of the bull-bear struggle that creates them, you can capture potential reversals with greater confidence.
However, remember that like every trading strategy, trading with long wick candles carries risk. A long wick is only a signal of trend reversal probability, not certainty. Therefore, combine the formation with other analytical tools and practice before real trades.
FAQ
What is a John Wick Candle? What are its characteristics?
A John Wick candle is a candlestick pattern featuring an unusually long wick, typically indicating strong price rejection at certain levels. Its characteristics include a small body with an extended upper or lower wick, reflecting high volatility and market indecision during the trading period.
Long wick candles form when price moves significantly in one direction but closes near the opposite end, indicating buyer or seller rejection. They represent market indecision and strong resistance or support, signaling potential trend reversals or consolidation phases.
What is the significance of John Wick candles in trading and how to identify buy and sell opportunities?
John Wick candles with long wicks signal strong market sentiment reversals. Upper wicks indicate rejection at resistance; lower wicks suggest support testing. Traders identify buy signals from lower wicks in downtrends and sell signals from upper wicks in uptrends. Combine wick analysis with other indicators for reliable trading decisions.
What is the difference between long wick candles and other candlestick patterns (such as hammer and inverted hammer)?
Long wick candles differ from hammer and inverted hammer lines in body size and formation. Long wick candles have larger bodies with extended wicks, indicating strong market forces and major player activity. Hammer and inverted hammer patterns have smaller bodies relative to their wicks, showing weaker market momentum. Long wick candles typically appear during strong uptrends.
How to apply John Wick candlestick analysis across different timeframes (daily, 4-hour, 1-hour)?
Use daily charts to identify overall trends, 4-hour charts for medium-term signals, and 1-hour charts for precise entry and exit points. Confirm John Wick candle patterns across multiple timeframes to enhance accuracy and strengthen trading decisions.
What are the key risks when trading John Wick candles and how should you set stop losses?
When trading John Wick candles, main risks include sudden market reversals and high volatility. Set stop losses before price trends reverse to protect capital. Adjust stop loss levels based on personal risk tolerance and current market conditions for optimal position management.
* The information is not intended to be and does not constitute financial advice or any other recommendation of any sort offered or endorsed by Gate.