Master long wick candlestick trading with this comprehensive guide covering the complete 'John Wick' pattern strategy. Learn to identify bullish hammers and bearish shooting stars as powerful trend reversal signals in cryptocurrency markets. This article explains the psychology behind price rejection, practical wick-to-body ratios for signal validation, and systematic trading approaches for both bullish and bearish formations. Discover entry techniques, Stop Loss placement strategies, and Take Profit optimization across different market conditions. Understand critical limitations including low liquidity risks, false signals in sideways markets, and the importance of confirmation indicators. Combine long wick analysis with technical indicators and support/resistance levels on Gate exchange for enhanced trading accuracy. Suitable for traders seeking to integrate candlestick patterns into comprehensive trading systems.
Key Points
The long wick candlestick, commonly referred to as the "John Wick" candle in crypto markets, serves as a powerful trend reversal signal that visually represents an intense battle between buyers and sellers. This distinctive pattern provides traders with critical insights into market sentiment shifts and potential entry or exit points.
- A long wick indicates that price was aggressively rejected in the direction of the dominant trend, with momentum rapidly shifting to the opposing side
- Bullish patterns (hammer) and bearish patterns (shooting star) typically appear at trend peaks or bottoms, offering strong reference points for buy/sell decisions
- For strategic entry, it is essential to wait for confirming candles after the long wick formation and support from technical indicators
- Signal reliability significantly decreases in contexts such as low liquidity environments, news-driven volatility, or sideways markets
What Is a Long Wick Candlestick?
Traders recognize the long wick candlestick formation as a signal that the current trend may be reversing. It stands as one of the most iconic candlestick patterns in technical analysis, deriving its name from the distinctively long wick (or shadow) attached to its body.
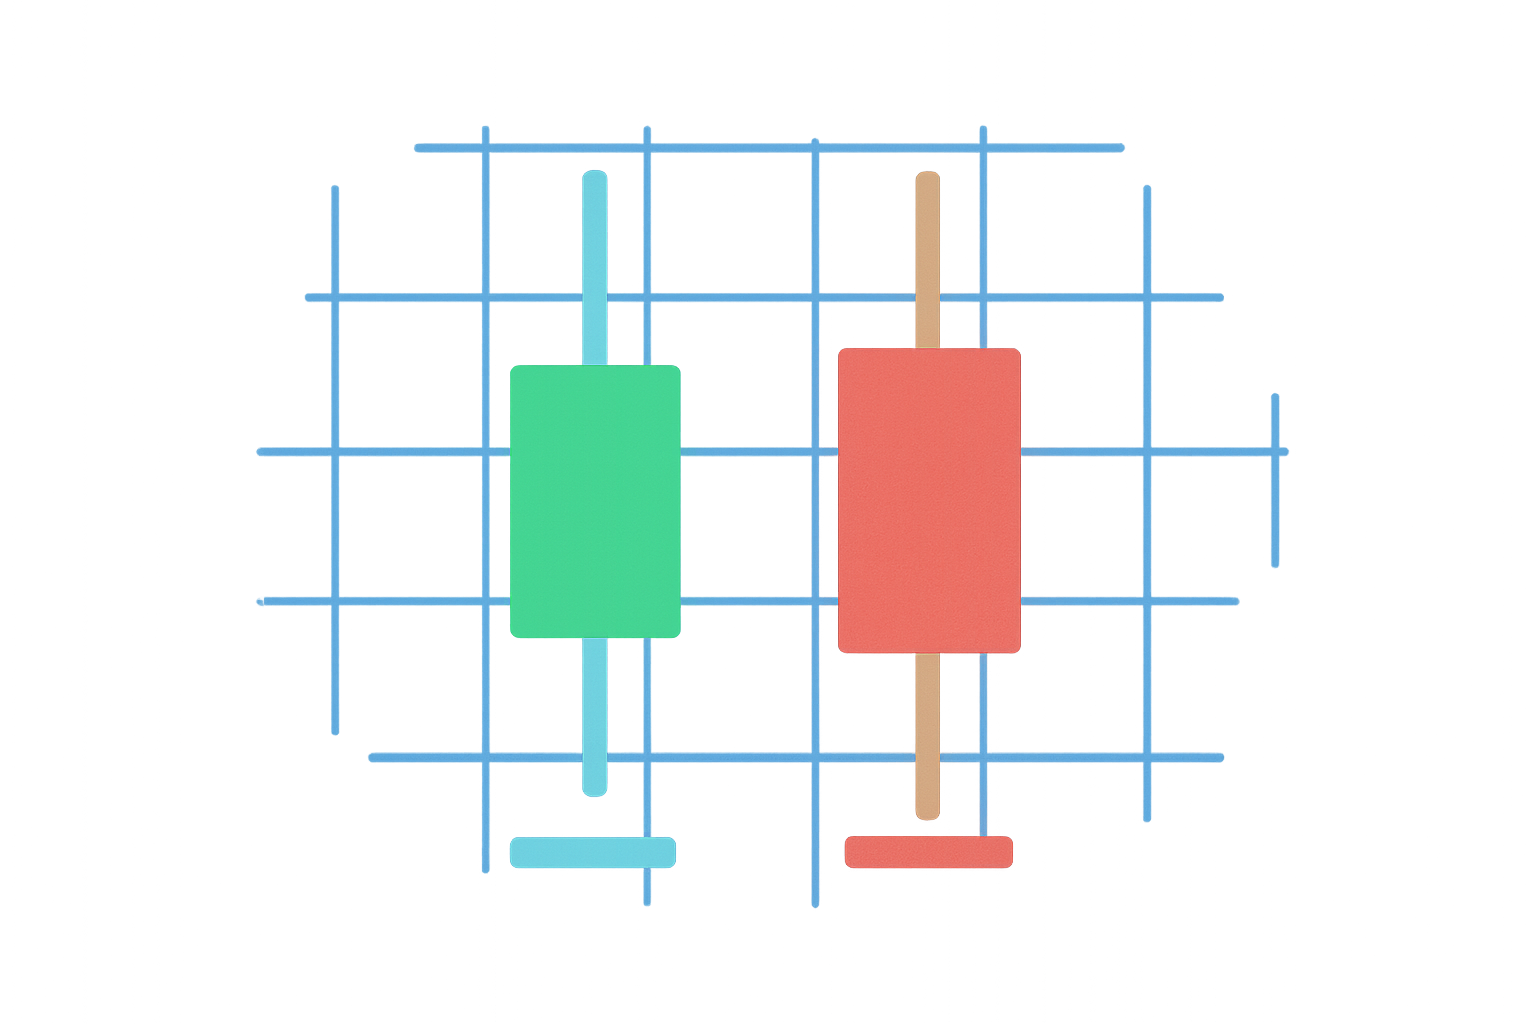
A bullish reversal signal with a long wick typically appears at the end of a downtrend. This candle is widely known as a Hammer and features a small body, a small (or nonexistent) upper shadow, and a long lower wick. The extended lower shadow demonstrates that sellers pushed the price significantly lower during the session, but buyers stepped in with enough force to drive the price back up near the opening level by the close.
Conversely, a bearish reversal signal with a long wick emerges at the end of an uptrend. This candle is commonly called a Shooting Star and displays a small body near the bottom of the candle, a small (or nonexistent) lower shadow, and a long upper wick. The extended upper shadow shows that buyers initially pushed the price much higher, but sellers overwhelmed them and brought the price back down near the opening by the close.
These formations are particularly significant in cryptocurrency markets, where volatility amplifies the visual impact of these patterns and their predictive power. The length of the wick relative to the body size determines the strength of the reversal signal—the longer the wick compared to the body, the more forceful the rejection and the stronger the potential reversal.
Why Is It Called a "John Wick" Candle?
To understand the meaning behind this name, one must be familiar with the character: John Wick, portrayed by Keanu Reeves in the popular film series, is renowned for his ruthless efficiency, unwavering focus, and ability to turn around seemingly impossible situations. When he enters a fight, the direction of battle shifts suddenly and violently.
The "John Wick" candlestick formation captures exactly this narrative in market terms. It symbolizes a moment of extreme conflict in the market, representing a powerful and merciless rejection of price movement in one direction.
Long Wick = The Weapon of Rejection
The most striking feature of the candle is its long wick (shadow). This wick is not merely a line—it is the trace of a violent battle between market participants. The wick tells the story of an attempted move that was decisively rejected.
-
In an uptrend (Bearish "John Wick" / Shooting Star): The long upper wick shows that bulls aggressively pushed the price upward, attempting to continue the rally. However, bears stepped in with overwhelming force, rejecting the higher prices and driving the close back down near the opening. This rejection suggests that buying pressure has been exhausted and sellers are taking control.
-
In a downtrend (Bullish "John Wick" / Hammer): The long lower wick indicates that bears were completely dominant during the session, dragging the price to new low levels. However, buyers emerged with sufficient strength to reject these lows, pushing the price back up significantly by the close. This demonstrates that selling pressure may be exhausted and buyers are stepping in.
The dramatic nature of this price rejection mirrors John Wick's ability to turn the tables on his adversaries—what seemed like a decisive move in one direction is suddenly and forcefully reversed.
Small Candle Body = The Professional Assassin's Efficiency
A classic John Wick candle features a relatively small real body compared to its wick. Despite extreme price fluctuations throughout the trading session, the opening and closing prices remain very close to each other. This small body demonstrates precision and efficiency—much like the character himself.
The compact body tells us that despite the chaos and volatility during the session (represented by the long wick), the market closed near where it opened. This suggests that the aggressive move in one direction was completely negated, and equilibrium was restored at a level that rejects the attempted breakout or breakdown. The smaller the body relative to the wick, the more complete the rejection and the stronger the reversal signal.
This combination of a dramatic wick with a small body creates a powerful visual representation of market psychology: one side attempted a decisive move, but the opposing side responded with such force that the session ended essentially unchanged, except for the clear message that the attempted direction has been rejected.
The Psychology Behind Long Wick Candlesticks
Understanding the psychological dynamics behind long wick formations is essential for interpreting their significance and making informed trading decisions. Each type of long wick candle tells a specific story about the battle between buyers and sellers.
-
Bullish Long Wick (Long Lower Shadow): This pattern emerges in a downtrend and reveals a critical shift in market psychology. Initially, sellers maintain control and aggressively push the price downward, often to new lows. This selling pressure might be driven by fear, negative news, or technical breakdown. However, at some point during the session, buyers recognize value at these lower levels and step in forcefully. Their buying pressure is strong enough not only to halt the decline but to drive the price significantly higher, often closing near or above the opening price. This demonstrates that sellers have exhausted their momentum and buyers are gaining confidence, suggesting a potential trend reversal from bearish to bullish.
-
Bearish Long Wick (Long Upper Shadow): This formation appears in an uptrend and signals a potential exhaustion of buying pressure. During the session, buyers enthusiastically push the price higher, perhaps driven by FOMO (fear of missing out), positive news, or technical breakout attempts. However, sellers respond decisively at these elevated levels, viewing them as overvalued. The selling pressure is strong enough to drive the price back down, often closing near the opening level. This rejection of higher prices suggests that buyers are losing control and sellers are becoming more aggressive, indicating a potential reversal from bullish to bearish.
-
Spinning Top Candles: These unique formations feature long wicks on both the upper and lower ends, combined with a small body positioned near the middle of the trading range. Spinning tops indicate indecision and equilibrium between buyers and sellers. Neither side can maintain control, resulting in price being pushed both up and down significantly during the session, only to close near the opening. These patterns typically appear before trend reversals or at the beginning of consolidation periods, as they signal that the previous trend's momentum is weakening and the market is entering a state of uncertainty.
The psychological interpretation becomes even more powerful when considering the context: a bullish long wick at a key support level suggests strong buying interest defending that level, while a bearish long wick at a resistance level indicates determined sellers preventing upward breakouts.
What Happens When a Candle Has Long Wicks on Both Top and Bottom?
Some candlesticks display very long shadows on both the upper and lower ends, creating a distinctive appearance. However, these candles are not classified as classic long wick candles but are instead known as "spinning tops." The spinning top formation reveals that both buyers and sellers are highly active but neither group can establish clear dominance.
During the formation of a spinning top, the price experiences significant volatility in both directions. Buyers push the price substantially higher at some point during the session, creating the long upper wick. Simultaneously or alternatively, sellers drive the price significantly lower, forming the long lower wick. Despite all this activity, the opening and closing prices remain relatively close, resulting in a small body.
This pattern indicates market indecision and uncertainty about future direction. Spinning tops generally suggest that the current trend is losing momentum and the market may be preparing to change direction or enter a period of sideways movement. When spinning tops appear after an extended trend, they often serve as warning signals that the trend may be exhausted.
Traders should interpret spinning tops as periods of high uncertainty requiring caution. Rather than providing a clear directional signal like a classic long wick candle, spinning tops suggest waiting for additional confirmation before taking positions. The subsequent candles following a spinning top often provide clearer direction as the market resolves its indecision.
How "Long" Is Long Enough? A Practical Rule
A frequently asked question among traders is how to determine whether a wick is truly "long" enough to be significant. While there is no official standard measurement, the trading community has established a generally accepted guideline: the wick length should be at least 2 to 3 times the length of the candle body.
-
Strong Signal: If the wick is three times the length of the body or more, this represents a sharp rejection signal with high reliability. Such an extreme ratio indicates that the price moved dramatically in one direction but was forcefully rejected, suggesting strong conviction from the opposing side.
-
Moderate Signal: If the wick is approximately two times the body length, this still represents a meaningful rejection, though with somewhat less intensity than the 3:1 ratio. These formations should be traded with additional confirmation.
-
Weak Signal: If the wick is only slightly longer than the body, its significance diminishes considerably, and traders should approach with caution. Such formations may simply represent normal price fluctuation rather than a meaningful rejection.
Beyond the ratio, traders should also consider the absolute length of the wick in relation to recent price action. A wick that extends significantly beyond recent trading ranges carries more weight than one that remains within normal volatility parameters. Additionally, the location of the wick matters—a long wick that tests and rejects a key support or resistance level is more significant than one appearing in the middle of a trading range.
Context is crucial: in highly volatile markets like cryptocurrency, wicks naturally tend to be longer, so the ratio requirement might need adjustment. Conversely, in less volatile markets, even a 2:1 ratio might represent a significant rejection.
How to Trade Using the "John Wick" (Long Wick) Candlestick Strategy
Once traders begin regularly identifying long wick formations, they must develop comprehensive strategies for market entry and exit, as well as proper placement of Stop Loss and Take Profit orders. A systematic approach to trading these patterns significantly improves success rates.
When trading with long wick candles, Stop Loss orders are typically placed near the candle's closing price, providing protection while allowing for minor price fluctuations. Take Profit placement is more complex and should be determined based on support and resistance levels, recent price structure, and overall market conditions.
When to Execute Trades on Long Wick Candles
Traders should never immediately open positions upon spotting a long wick candle. Patience and confirmation are essential components of successful trading. To validate a trend reversal, traders must obtain additional confirmation from technical indicators, oscillators, or other analytical tools before committing capital.
Confirmation methods include:
- Waiting for the next candle to close in the direction suggested by the long wick
- Checking for convergence with momentum indicators like RSI or MACD
- Verifying that the formation occurs at a significant support or resistance level
- Ensuring adequate trading volume accompanies the formation
- Confirming that the broader market context supports the reversal
Rushing into trades based solely on a single long wick candle, without proper confirmation, significantly increases the risk of false signals and premature entries.
Trading a Bullish Long Wick Candle
The systematic approach to trading a bullish long wick (hammer) formation involves several carefully executed steps:
-
Pattern Identification: The trader identifies a candle with a long lower shadow appearing at the end of a downtrend. The candle should have a small body near the top of its range, minimal or no upper shadow, and a lower wick at least 2-3 times the body length.
-
Entry Positioning: After confirming the pattern with subsequent price action or technical indicators, the trader places a buy order near the closing price of the long wick candle. Some traders prefer to wait for the next candle to break above the high of the long wick candle before entering, providing additional confirmation.
-
Stop Loss Placement: To limit potential losses, a Stop Loss order is placed below the lowest point of the long lower wick. This placement ensures that if the reversal fails and price continues lower, the position is automatically closed with a defined, limited loss. Some traders add a small buffer below the wick low to account for minor price fluctuations.
-
Take Profit Strategy: A Take Profit order is established at a reasonable resistance level identified through technical analysis. This might be a previous swing high, a Fibonacci retracement level, or a significant moving average. The risk-to-reward ratio should be favorable, typically at least 1:2 or better.
-
Position Management: As the trade moves in the favorable direction, traders may consider trailing their Stop Loss upward to lock in profits while allowing the position to capture further upside if the reversal proves strong.
Trading a Bearish Long Wick Candle
The approach to trading a bearish long wick (shooting star) formation follows a similar systematic process:
-
Pattern Recognition: The trader identifies a candle with a long upper shadow appearing at the end of an uptrend. The candle should have a small body near the bottom of its range, minimal or no lower shadow, and an upper wick at least 2-3 times the body length.
-
Entry Execution: After obtaining confirmation through subsequent bearish price action or technical indicator signals, the trader places a sell order near the closing price of the long wick candle. Conservative traders may wait for the next candle to break below the low of the long wick candle before entering short.
-
Stop Loss Management: To protect against adverse price movement, a Stop Loss order is placed above the highest point of the long upper wick. This placement ensures that if the price continues rising despite the bearish signal, the position is closed with a controlled loss. Adding a small buffer above the wick high can prevent premature stops from minor fluctuations.
-
Take Profit Planning: A Take Profit order should be positioned near a significant support level identified through chart analysis. This could be a previous swing low, a key support zone, or a major moving average. Maintaining a favorable risk-to-reward ratio of at least 1:2 is recommended.
-
Trade Monitoring: As the price moves downward favorably, traders can trail their Stop Loss downward to secure profits while remaining in the position to capture additional downside if the reversal continues strongly.
Limitations of the Long Wick Candlestick Strategy
While long wick candlesticks provide valuable trading signals, understanding their limitations is crucial for avoiding false signals and managing risk effectively. No trading strategy is perfect, and long wick patterns are no exception.
-
Low Liquidity & Irregular Market Conditions: Long wicks appearing during low-volume trading hours or in illiquid markets may represent noise rather than genuine reversal signals. In thin markets, a relatively small order can create a long wick without reflecting true market sentiment. Cryptocurrency markets, particularly smaller altcoins, are especially susceptible to this issue during off-peak hours.
-
Lack of Trend Context: The significance of a long wick diminishes considerably in sideways or choppy markets. When price is ranging rather than trending, long wicks may simply represent normal oscillation within the range rather than meaningful reversals. Traders should avoid relying heavily on long wick signals during consolidation periods.
-
Absence of Confirmation: Trading solely based on a single long wick candle without waiting for confirmation is risky and often leads to false signals. The market may test the wick's extreme again before ultimately moving in the expected direction, or the signal may fail entirely. Always wait for confirming candles or supporting technical indicators before entering positions.
-
Major News Events: Long wicks forming immediately before, during, or after significant news announcements can be misleading. News-driven volatility often creates exaggerated price movements that don't reflect sustainable market sentiment. These wicks may represent knee-jerk reactions rather than thoughtful market repositioning.
-
Neglecting Other Indicators: Focusing exclusively on wick formations while ignoring other technical indicators, market structure, and broader context significantly reduces trading effectiveness. Long wick candles should be integrated into a comprehensive analytical framework that includes trend analysis, support/resistance levels, volume analysis, and momentum indicators.
-
Extreme Volatility: In highly volatile markets, long wicks can form frequently in both directions, creating conflicting signals and reducing the reliability of individual formations. During periods of extreme volatility, traders should increase their confirmation requirements and potentially reduce position sizes.
-
No Guarantee of Success: A long wick indicates the probability of a reversal but provides no guarantee. Markets can and do fail to reverse despite clear long wick formations. Risk management through proper position sizing and Stop Loss placement remains essential regardless of signal strength.
-
Time Frame Dependency: Long wick significance varies across different time frames. A long wick on a 5-minute chart carries far less weight than one on a daily or weekly chart. Traders should prioritize longer time frame signals while using shorter time frames for entry timing refinement.
Conclusion
Trading based on long wick candlesticks can be highly profitable when executed with proper identification skills and strict adherence to trading rules. Bullish long wicks typically appear at the end of downtrends, while bearish long wicks emerge at the peaks of uptrends, providing valuable insights into potential trend reversals.
However, it is crucial to remember that, like all trading strategies, long wick candlestick trading carries inherent risks. A long wick represents only a signal of potential trend reversal probability, not a certainty. The pattern indicates that a battle between buyers and sellers occurred, with one side decisively winning, but this doesn't guarantee that the reversal will continue or that the pattern won't fail.
For optimal results, traders should combine long wick formations with other analytical tools, including trend analysis, support and resistance levels, volume indicators, and momentum oscillators. This multi-faceted approach significantly improves signal reliability and reduces the likelihood of false signals.
Before committing real capital to long wick trading strategies, extensive practice in demo accounts or paper trading is strongly recommended. This practice period allows traders to develop pattern recognition skills, refine entry and exit timing, and build confidence in their ability to identify high-probability setups. Additionally, maintaining a trading journal to document long wick trades, including successes and failures, provides valuable learning opportunities and helps refine the strategy over time.
Ultimately, the "John Wick" candlestick pattern earns its dramatic name through the powerful reversals it can signal. Like the character it's named after, these patterns represent moments when the market suddenly and forcefully changes direction, offering astute traders opportunities to position themselves on the right side of emerging trends. With proper education, practice, and disciplined execution, long wick candlestick trading can become a valuable component of a comprehensive trading strategy.
FAQ
What is a John Wick candlestick and how do you identify it on a price chart?
A John Wick candlestick is a long-bodied candle with minimal or no wicks, showing strong directional price movement with low volatility. Identify it by locating candles with small upper and lower wicks relative to their body size on your price chart.
What are the main trading strategies when you see a John Wick candle pattern?
Identify potential reversals or breakouts using the John Wick pattern. Enter trades opposite to the wick direction, focusing on tight stop losses. Use wicks to highlight rejection zones and confirm failed breakouts for strategic entry and exit points.
What does a long wick candlestick indicate about market sentiment and price rejection?
A long wick candlestick signals market rejection of extreme price levels, indicating traders opposed the price move. This suggests potential reversal as buyers or sellers failed to sustain the move at those levels.
How can traders use John Wick candles for support and resistance levels?
Traders use John Wick candles to identify support and resistance by observing the opening range, which typically acts as key price levels throughout the trading day. Breakouts above or below this range signal potential trend shifts and trading opportunities.
What are the risks of trading based on long wick candlestick patterns?
Long wick patterns can produce false signals, leading to incorrect entries and exits. Price may reverse unexpectedly after forming these patterns. Relying solely on wicks without confirming indicators increases losses. Market volatility and low liquidity can amplify risks during pattern formation.
How do John Wick candles differ from other candlestick patterns in technical analysis?
John Wick candles prioritize the candle body while disregarding wicks, unlike traditional patterns that analyze both. This approach isolates pure price movement, offering clearer trend signals and reducing false breakout noise in trading analysis.
* The information is not intended to be and does not constitute financial advice or any other recommendation of any sort offered or endorsed by Gate.