The Hammer Candlestick Pattern is a powerful technical analysis tool for identifying trend reversals in financial markets. This comprehensive guide teaches traders to recognize hammer patterns at downtrend bottoms, preceded by three consecutive red candles, and execute profitable trades when confirmation candles show bullish momentum. The article covers four key pattern variations: traditional hammers and inverted hammers signaling bullish reversals, plus hanging mans and shooting stars indicating bearish reversals in uptrends. Traders learn systematic entry strategies using proper stop-loss placement at pattern lows and reward-to-risk ratios between 1 and 3. The guide emphasizes combining hammer patterns with support levels and moving averages to filter false signals and increase reliability. While acknowledging that hammer candlesticks achieve 60-70% success rates, the article stresses combining multiple technical indicators for robust trading strategies across stocks, forex, and cryptocurrency markets on G
Summary
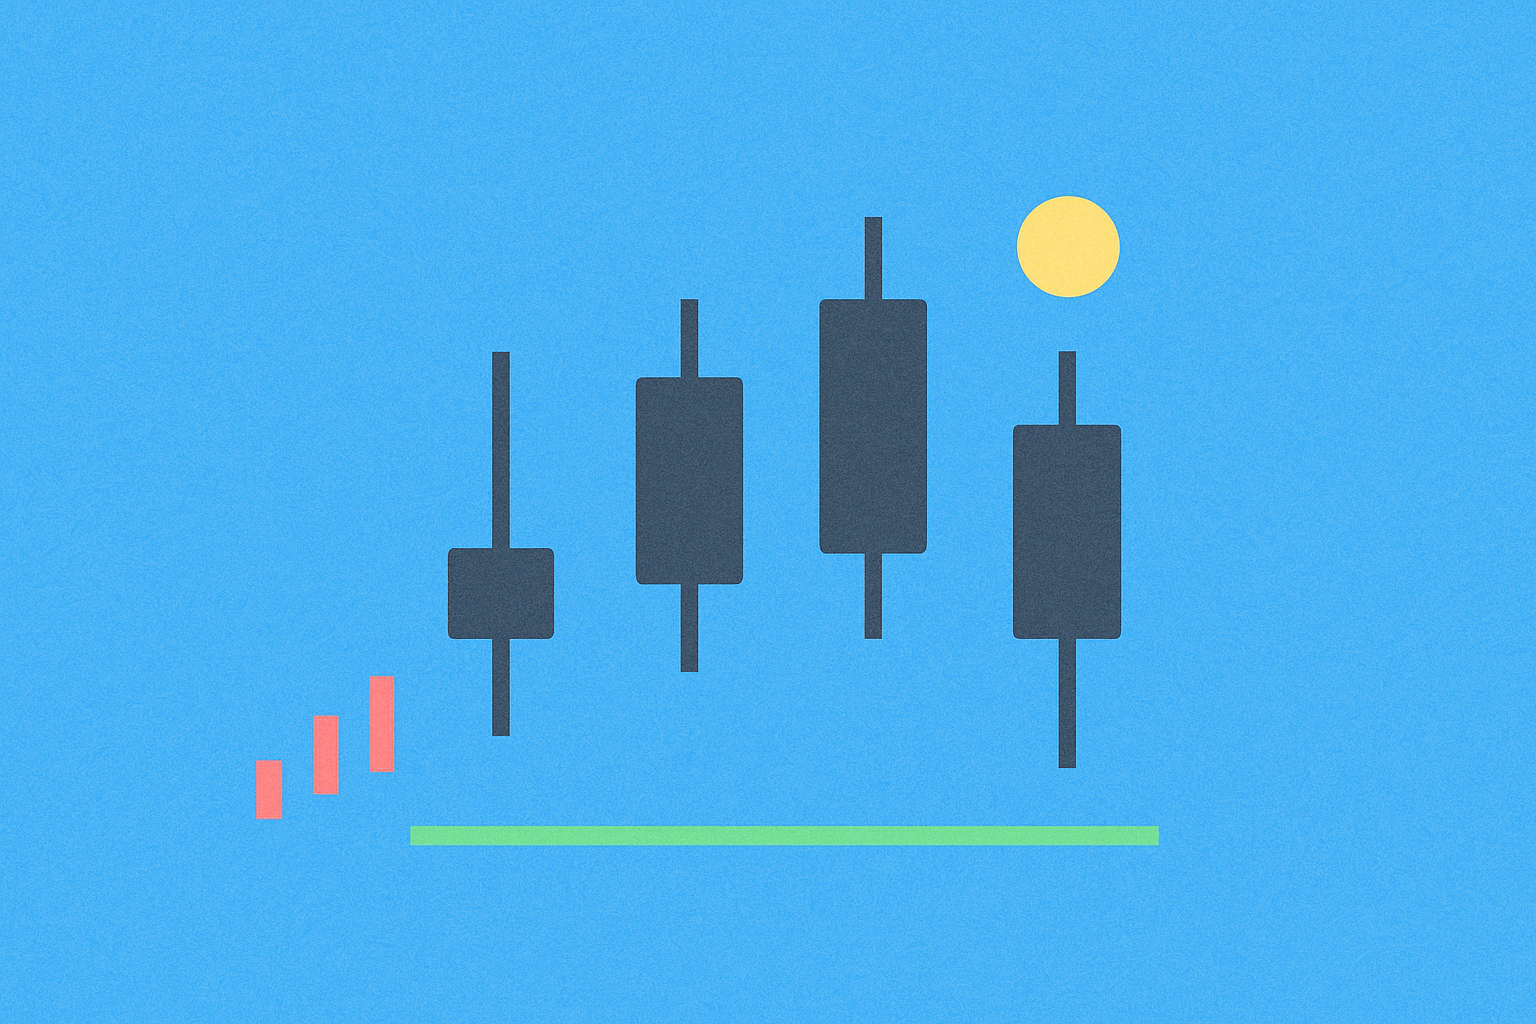
The hammer candlestick pattern is a powerful technical analysis tool that traders use to identify potential trend reversals in financial markets. A hammer or inverted hammer typically appears at the end of a downtrend, signaling a possible bullish reversal. These patterns are most reliable when preceded by at least three consecutive red candles, indicating a sustained downward movement. The confirmation of a hammer pattern comes from the subsequent candle, which should show a price increase, validating the reversal signal. Understanding how to properly identify and trade on hammer candlestick patterns can significantly enhance a trader's ability to enter positions at optimal price points and maximize profit potential.
When traders spot a normal hammer or an inverted hammer, they should carefully examine the preceding price action to ensure it follows at least three red candles. This context is crucial for the pattern's reliability. After identifying the hammer pattern, traders must closely monitor the candle that comes right after the hammer candlestick patterns. If this confirmation candle shows bullish momentum with a higher closing price than its opening price, it validates the reversal signal and provides a strategic entry point for long positions. This systematic approach to trading hammer patterns helps traders make informed decisions based on proven technical analysis principles.
What Is a Hammer Candlestick?
The hammer candlestick pattern is one of the most iconic and widely recognized formations in technical analysis, receiving its distinctive name due to its shape that closely resembles a traditional hammer tool. This pattern holds significant importance in price action analysis and is frequently used by traders across various financial markets, including cryptocurrencies, stocks, and forex trading.
The visual representation of a hammer candlestick provides crucial information about market sentiment and potential price movements. In candlestick charting, the green color of the candle's body indicates that the closing price is higher than the opening price, demonstrating bullish momentum within that time period. Conversely, a red candle signifies that the opening price exceeds the closing price, suggesting bearish pressure. However, experienced traders often regard the hammer candlestick as a bullish reversal signal regardless of the candle's body color, as the pattern's shape and position within the trend carry more weight than the body color alone. It's worth noting that the colors of the candles may vary depending on individual charting preferences and platform settings, with some traders using different color schemes such as black and white or blue and orange.
Hammer Candles in Downtrend and Uptrend
The context in which a hammer candlestick appears dramatically affects its interpretation and trading implications. When a hammer candlestick is found after a sustained downtrend, it signifies the possible reversal of a bearish downward trend into a bullish upward trend. This scenario represents a classic bullish reversal pattern, where sellers have exhausted their momentum and buyers are beginning to step in, pushing prices higher from the lows. The hammer in this context suggests that despite significant selling pressure during the session (evidenced by the long lower shadow), buyers managed to push the price back up near the opening level, demonstrating renewed buying interest.
However, if a hammer candlestick is found after an uptrend, it carries a completely different meaning and may indicate the possible reversal of a bullish uptrend into a bearish downtrend. In this latter scenario, the hammer candlestick pattern goes by a different name – the "Hanging Man." The Hanging Man serves as a warning signal that the uptrend may be losing momentum and that sellers could be gaining control. This distinction highlights the critical importance of context in technical analysis, as the same candlestick shape can have opposite implications depending on its position within the broader trend.
The hammer candlestick is characterized by several distinctive features that make it easily identifiable on price charts. The pattern exhibits a small or sometimes non-existent upper shadow, where the candle's highest price is close to or almost equivalent to the opening or closing price. This characteristic indicates that there was minimal upward price movement beyond the opening or closing level. Another notable characteristic is its long bottom shadow, which serves as the defining feature of the pattern. The bottom shadow's length is typically at least double that of the candle's body, meaning that the candle's lowest price is significantly far from its opening or closing price. This long lower shadow tells a story of substantial selling pressure during the session that was ultimately rejected by buyers, who pushed the price back up near the opening level.
What is the Inverted Hammer Candlestick (Shooting Star)?
The inverted variations of the hammer candlestick pattern provide equally important trading signals but with a reversed visual appearance. As illustrated in candlestick pattern analysis, inverted hammer patterns look essentially the same as the normal hammer candlestick patterns but turned upside down, creating a mirror image of the traditional hammer. From a structural perspective, an inverted hammer candlestick has a very small or sometimes non-existent bottom shadow and a long upper shadow that extends at least twice as long as the candle's body. This configuration demonstrates that buyers pushed prices significantly higher during the session, but sellers stepped in to drive prices back down near the opening level.
The inverted hammers can display either green or red body colors depending on the asset's opening and closing price relationship. A green inverted hammer indicates that the closing price was higher than the opening price, while a red inverted hammer shows that the closing price was lower than the opening price. Similar to regular hammers, the body color is less important than the pattern's shape and context. The inverted hammer serves as a bullish reversal signal when found after a downtrend, suggesting that buyers are attempting to gain control despite the session ending near the lows. Conversely, when an inverted hammer appears after an uptrend, it becomes a bearish reversal signal. In this latter case, the inverted hammer is commonly called a "Shooting Star," which warns traders of potential trend exhaustion and possible downward reversal.
How To Recognize the Hammer Candlestick?
Recognizing hammer candlestick patterns accurately is a fundamental skill that every trader must develop to successfully implement this technical analysis strategy. The following examples demonstrate the different hammer candlestick patterns that traders can use as practical references for their own chart analysis. These real-world examples illustrate the typical hammer, the Hanging Man, the inverted hammer, and the Shooting Star in various market conditions, providing valuable insights into how these patterns manifest in actual trading scenarios.
Typical Hammer Candlestick
A classic example of a typical hammer candlestick pattern can be observed in a downtrend scenario where the hammer appears after sustained bearish pressure. In this illustrative case, the hammer candlestick is located after a significant downtrend where the price fell from approximately $3,500 to about $2,000, representing a substantial decline of roughly 43%. This extended downward movement created the ideal conditions for a potential reversal pattern to form. The appearance of a hammer candlestick in this context serves as a potential bullish reversal signal, indicating that the asset may be forming a bottom, which could be followed by a price increase.
The signal gains confirmation when the candle that appears immediately after the hammer displays a higher closing price than its opening price, demonstrating bullish momentum and buyer commitment. In this specific example, the asset's price did indeed increase following the appearance of the hammer candlestick, rising to approximately $2,900, which represents a gain of about 45% from the hammer's low point. This successful reversal validates the hammer pattern's predictive power and demonstrates why traders place significant emphasis on this formation.
The Hanging Man
The Hanging Man pattern provides a contrasting example of how the same candlestick shape can signal a bearish reversal when appearing in an uptrend context. In this case study, the Hanging Man is located after a sustained uptrend where the price rose from around $143 to approximately $176, marking a substantial increase of about 23%. This upward movement created an extended bullish trend that eventually showed signs of exhaustion. The appearance of a Hanging Man pattern serves as a potential bearish reversal signal, suggesting that the asset may be forming a top, which could be followed by a price drop.
The bearish signal receives confirmation when the candle that follows the Hanging Man displays a higher opening price than its closing price, indicating that sellers have gained control and are pushing prices lower. In this particular example, the asset's price did decrease after the appearance of the Hanging Man, dropping to approximately $165, which represents a decline of about 6% from the pattern's high point. This price action confirms the Hanging Man's warning signal and demonstrates the importance of recognizing this pattern at potential market tops.
Inverted Hammer Candlestick
The inverted hammer candlestick pattern offers another variation of bullish reversal signals that traders can utilize in their technical analysis toolkit. In this demonstration, the inverted hammer candlestick is located after a downtrend where the price fell from around $600 to about $540, representing a decline of approximately 10%. This downward movement set the stage for a potential reversal pattern to emerge. The appearance of an inverted hammer in this context serves as a potential bullish reversal signal, indicating that the asset may be forming a bottom, which could be followed by a price increase as buyers begin to assert control.
The bullish reversal signal gains confirmation when the candle that immediately follows the inverted hammer shows a higher closing price than its opening price, validating the pattern's predictive power. In this specific example, the asset's price did rise substantially after the appearance of the inverted hammer, increasing back to approximately $600, which represents a recovery of about 11% from the inverted hammer's low point. This successful reversal pattern demonstrates how inverted hammers can provide valuable entry signals for traders looking to capitalize on trend reversals.
The Shooting Star
The Shooting Star pattern represents the bearish counterpart to the inverted hammer and provides crucial warning signals when appearing after uptrends. In this case study, the Shooting Star is located after an uptrend where the price rose from around $237 to approximately $247, marking an increase of about 4%. This upward movement preceded the formation of the Shooting Star pattern. The appearance of a Shooting Star serves as a potential bearish reversal signal, suggesting that the asset may be forming a top, which could be followed by a price decrease as selling pressure intensifies.
The bearish signal receives confirmation when the candle that appears right after the Shooting Star displays an opening price that is higher than its closing price, indicating that sellers have successfully pushed prices lower. In this particular example, the asset's price did drop after the appearance of the Shooting Star, falling to approximately $230, which represents a decline of about 7% from the pattern's high point. This price movement validates the Shooting Star's warning signal and underscores the importance of recognizing this pattern as a potential exit signal for long positions.
How To Trade on a Hammer Candlestick?
Trading on hammer candlestick patterns requires a systematic approach that combines pattern recognition with proper risk management and trade execution strategies. There are two fundamental rules that traders should follow when implementing hammer candlestick trading strategies to maximize their success rate and minimize potential losses.
The first critical rule involves proper pattern validation through context analysis. When traders spot a normal hammer or an inverted hammer pattern on their charts, they should carefully verify that it is preceded by at least three consecutive red candles. This requirement ensures that there has been sufficient downward momentum to make the reversal pattern meaningful and reliable. In the case of the Hanging Man or Shooting Star patterns, traders should check if the pattern is preceded by at least three consecutive green candles, confirming an established uptrend. The hammer candlestick patterns prove most effective and reliable in these specific scenarios, as they represent genuine shifts in market sentiment rather than random price fluctuations.
The second essential rule focuses on confirmation and timing of trade entry. Traders must carefully examine the candle that comes immediately after the hammer candlestick patterns to confirm the reversal signal. If there is a price increase following a normal hammer or an inverted hammer, as evidenced by a bullish confirmation candle, traders can confidently enter long positions at a relatively lower price point and plan to take profit at a higher price level. Conversely, if there is a price decrease after the Hanging Man or Shooting Star patterns, as shown by a bearish confirmation candle, traders should consider exiting their long positions at the higher price and potentially re-entering at a lower price point, or even consider short positions depending on their trading strategy and risk tolerance.
Once traders develop the ability to regularly spot hammer candlestick patterns with confidence, they should focus on developing comprehensive strategies for market entry and exit, as well as proper placement of Stop Loss and Take Profit orders. Given that the cryptocurrency market is characterized by high volatility and rapid price movements, the Stop Loss and Take Profit orders should not be placed too close to the entry price, as this would cause them to trigger prematurely due to normal market fluctuations. Instead, traders should strategically place Take Profit orders according to a well-calculated reward-to-risk ratio, which is determined using the following formula:
(Take Profit price – Entry price) / (Entry price – Stop Loss price) = Reward-to-risk ratio
Traders should establish a reward-to-risk ratio that aligns with their individual risk tolerance and trading objectives. Conservative traders who prefer lower risk may opt for a reward-to-risk ratio close to 1, meaning they aim to gain approximately the same amount they are willing to risk. More aggressive traders who are comfortable with higher risk in pursuit of larger gains can choose a higher reward-to-risk ratio of more than 3. However, any ratio between 1 and 3 is generally considered acceptable and practical for most traders, providing a balanced approach between risk and potential reward.
Trading on a Hammer or an Inverted Hammer
Implementing a trading strategy based on hammer or inverted hammer patterns requires a methodical approach that follows specific steps to ensure proper execution and risk management. The following example illustrates how to enter a market position after the appearance of a hammer pattern, and this strategy works equally well for an inverted hammer candle. The corresponding steps provide a comprehensive framework for traders to follow:
Step 1: Pattern Identification - The trader carefully identifies a hammer candle on the price chart, ensuring that the hammer is preceded by at least three consecutive red candles. This context confirms that there has been a sustained downtrend, making the hammer pattern a potentially reliable reversal signal.
Step 2: Confirmation Waiting - The trader exercises patience and waits until the next candle after the hammer shows a clear price increase, confirming the bullish reversal signal. This confirmation candle, which appears right after the hammer, serves as the optimal entry point for the trade, as it validates the pattern's predictive power.
Step 3: Order Placement - The trader places a buy order around the identified price point of approximately $2,100 and prepares to take a long position. This entry point is based on the confirmation candle's price level, ensuring that the trader enters after receiving confirmation of the reversal.
Step 4: Stop Loss Implementation - To effectively limit potential losses and protect trading capital, the trader places a Stop Loss order at the low end of the hammer candlestick. In this specific case, the Stop Loss order is strategically placed at around $1,800, which represents the lowest point reached during the hammer candle's formation. This placement ensures that if the reversal fails and prices continue to decline, the trader's losses are contained.
Step 5: Take Profit Strategy - The trader establishes a Take Profit order based on their calculated reward-to-risk ratio. Depending on their risk tolerance and trading objectives, they should place the order at a level that yields a reward-to-risk ratio between 1 and 3. In this example, the Take Profit order is set at approximately $2,600, which gives a reward-to-risk ratio of roughly 1.7, representing a balanced approach between conservative and aggressive trading styles.
Trading on a Hanging Man or Shooting Star
Trading on bearish reversal patterns like the Hanging Man or Shooting Star requires a similar systematic approach but with adjustments for short positions or exit strategies. The following example demonstrates how to exit a market position or enter a short position after the appearance of a Shooting Star pattern. This strategy is equally applicable for a Hanging Man pattern. The corresponding steps outline a comprehensive approach:
Step 1: Pattern Recognition - The trader identifies the Shooting Star pattern on the price chart, verifying that it is preceded by at least three consecutive green candles. This context confirms an established uptrend, making the Shooting Star a potentially reliable bearish reversal signal.
Step 2: Confirmation Analysis - The trader waits patiently until the next candle shows a clear price drop, confirming the bearish reversal signal. The candle that appears after the Shooting Star serves as the entry point for a short position or the exit point for existing long positions, as it validates the pattern's warning signal.
Step 3: Position Entry - The trader places a sell order around the identified price point of approximately $246 and prepares to take a short position or exit long positions. This entry point is based on the confirmation candle's price level, ensuring proper timing of the trade.
Step 4: Stop Loss Protection - To limit potential losses if the bearish reversal fails, the trader places a Stop Loss order at the high end of the Shooting Star pattern. In this case, the Stop Loss order is placed at around $250, which represents the highest point reached during the Shooting Star's formation. This placement protects the trader if prices continue to rise despite the bearish signal.
Step 5: Profit Target Setting - The trader establishes a Take Profit order based on their calculated reward-to-risk ratio. Depending on their risk tolerance, they should place the order at a level that yields a reward-to-risk ratio between 1 and 3. In this example, the Take Profit order is set at approximately $237, which provides a reward-to-risk ratio of roughly 2.5, representing a more aggressive but still reasonable trading approach.
How Reliable Are Hammer Candlesticks?
While the examples provided above demonstrate successful applications of hammer candlestick patterns, it is crucial for new traders to understand that hammer candlesticks should not be used in isolation, even when accompanied by price drop or increase confirmation signals. The reliability of hammer patterns, like all technical analysis tools, is not absolute, and traders must maintain realistic expectations about their accuracy rate.
In some market conditions, the price may continue to drop even though a hammer candle appeared after a bearish downtrend, representing a false reversal signal. This can occur due to various factors, including strong fundamental bearish news, overall market sentiment, or institutional selling pressure that overwhelms the technical pattern. Similarly, prices may continue to rise despite the appearance of a Hanging Man or Shooting Star pattern in an uptrend.
Experienced traders recognize these limitations and typically combine hammer candlestick patterns with other trading indicators and technical analysis tools to increase the reliability of their trading signals. Common complementary tools include moving averages, which help identify the overall trend direction and potential support or resistance levels. Support and resistance levels provide additional context for where price reversals are more likely to occur. Other useful indicators include the Relative Strength Index (RSI) for identifying overbought or oversold conditions, volume analysis to confirm the strength of price movements, and trend lines to provide additional confirmation of trend changes.
By combining multiple analytical approaches, traders can filter out false signals and increase their overall success rate when trading hammer candlestick patterns. This multi-faceted approach to technical analysis represents a more sophisticated and reliable trading methodology than relying on any single indicator or pattern in isolation.
Conclusion
Trading on hammer candlesticks can prove to be a highly profitable strategy if traders develop the ability to reliably identify these patterns by strictly adhering to the identification rules and confirmation requirements. A hammer or inverted hammer pattern is typically found at the end of a downtrend, preceded by at least three consecutive red candles, and followed by a price increase that confirms the bullish reversal signal. In contrast, the Hanging Man or Shooting Star pattern is usually located at the end of an uptrend, preceded by at least three consecutive green candles, and followed by a price drop that confirms the bearish reversal signal.
However, like all trading strategies in financial markets, hammer pattern candlestick trading involves a certain degree of risk that cannot be eliminated entirely. A hammer candle serves as a signal that indicates there is a possibility of a trend reversal occurring, but it does not provide any guarantee that the reversal will actually happen or that it will be sustained. Market conditions can change rapidly, and unexpected news or events can override technical patterns.
Therefore, traders are strongly advised to thoroughly understand the limitations of the hammer candlestick pattern and to maintain realistic expectations about its accuracy. Successful trading requires a comprehensive approach that combines pattern recognition with proper risk management, position sizing, and emotional discipline. Additionally, traders should combine the hammer pattern with other available trading tools and technical indicators to create a more robust trading system. It is also highly recommended that traders practice extensively with these tools using demo accounts or paper trading before committing real capital to trades based on hammer candlestick patterns. This practice period allows traders to gain experience, refine their strategy, and build confidence in their pattern recognition abilities without risking actual funds.
FAQ
What is a Hammer Candlestick? What are its characteristics?
A Hammer Candlestick is a technical analysis pattern featuring a small body at the top and a long lower wick at least twice the body's length. It signals potential trend reversal, commonly appearing at market bottoms to indicate bullish reversals.
How to identify a hammer candlestick on charts? What key points should be noted?
A hammer candlestick appears after price decline with a small body and long lower wick. Key points: identify the reversal signal, watch for price recovery confirmation, and ensure proper ratio between wick and body for valid formation.
How should you trade when a hammer candlestick appears? What is the best timing for buying and selling?
When a hammer candlestick forms, buy after confirmation on the next candle. Set stop loss below the hammer's low and take profit at support or resistance levels. Best timing is during downtrends for reversal signals.
What is the success rate of hammer candlesticks? What risks should be noted when using them?
Hammer candlesticks have moderate success rates around 60-70% when combined with volume confirmation. Key risks include false signals in low-volume markets, whipsaw movements, and the need for proper stop-loss placement below the hammer's lower wick.
What is the difference between Inverted Hammer and Hammer Candlestick?
Hammer forms at lows with price rising, signaling potential uptrend reversal. Inverted Hammer forms at highs with price falling, signaling potential downtrend reversal. They differ in position and market direction implications.
Combining hammer candlesticks with support levels and moving averages significantly enhances trade accuracy. Hammers at support levels or near moving averages provide stronger reversal signals for both long and short positions, improving entry point identification and increasing trading success rates.
What are the differences of hammer candlesticks across different timeframes (daily, 4-hour, 1-hour)?
Hammer candlesticks vary by timeframe: daily hammers signal long-term reversals with higher conviction, 4-hour hammers indicate intermediate trend shifts, and 1-hour hammers show short-term support bounces. Lower timeframes provide more signals but less reliability, while daily hammers carry stronger predictive power for sustained price movements.
Are hammer candlestick trading strategies the same across different markets (stocks, forex, cryptocurrencies)?
Hammer candlestick patterns share similar core principles across all markets, signaling potential bullish reversals. However, strategies vary due to different market volatility, liquidity, and trading volumes. Cryptocurrencies may show more extreme price swings, requiring adjusted risk management and confirmation indicators compared to traditional markets.
* The information is not intended to be and does not constitute financial advice or any other recommendation of any sort offered or endorsed by Gate.