This comprehensive guide explores the spinning top candlestick pattern, a critical technical analysis tool for cryptocurrency traders. The pattern, characterized by a small body centered between long upper and lower wicks, signals market indecision and potential trend reversals. The article covers pattern identification, formation mechanics, bearish and bullish interpretations, and distinctions from Doji patterns. Traders learn practical application strategies including market context analysis, confirmation techniques, and integration with support/resistance and trendline analysis. Through risk management principles and multi-indicator approaches, this guide empowers both beginners and experienced traders to effectively utilize spinning tops for improved entry and exit decisions on Gate trading platform.
What Is a Spinning Top Candlestick?
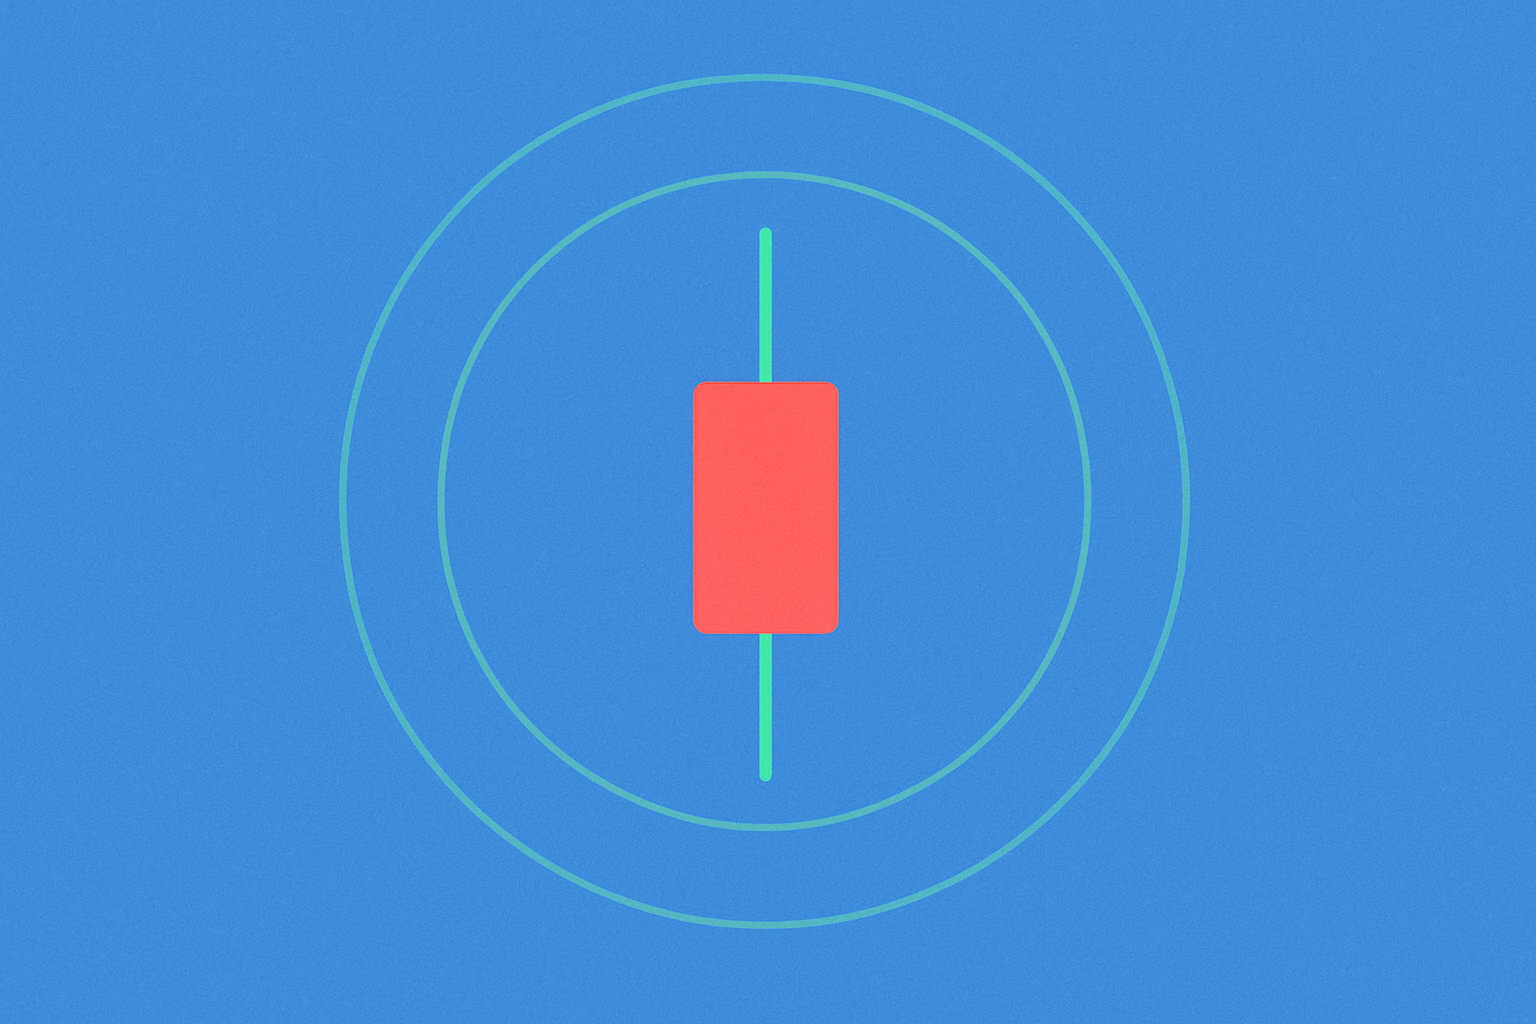
The spinning top candlestick pattern is a distinctive technical analysis tool characterized by a short body positioned between significantly long upper and lower wicks of relatively equal length. This unique formation indicates market indecision about an asset's future trend direction, making it a valuable signal for crypto traders.
In the context of cryptocurrency trading, the spinning top pattern emerges when neither buyers nor sellers can establish dominance during a specific timeframe. The pattern's visual appearance resembles a spinning top toy, hence its name. The short body represents minimal difference between opening and closing prices, while the long wicks demonstrate significant price volatility during the trading period.
This candlestick formation is particularly significant because it captures a moment of equilibrium in the market, where buying and selling pressures are nearly balanced. Understanding this pattern helps traders identify potential turning points in price trends, making it an essential component of technical analysis in volatile cryptocurrency markets.
The formation of a spinning top candlestick pattern occurs through a specific sequence of market activities within a single trading period. Initially, buyers push the price upward, creating the upper wick as the price reaches its peak. Subsequently, sellers enter the market and drive the price downward, forming the lower wick as the price hits its lowest point.
Throughout this process, the battle between buyers and sellers results in the opening price being very similar to the closing price, creating the characteristic short body. This near-equality between opening and closing prices demonstrates that despite significant price movement during the period, neither side achieved a decisive victory.
The formation process typically unfolds as follows: the market opens at a certain price level, experiences substantial upward movement as bulls gain temporary control, then faces downward pressure from bears, and finally closes near the opening level. This back-and-forth action creates the distinctive shape with long shadows on both sides of a small body.
For this reason, the spinning top candlestick is often classified as a continuation pattern, though it can also signal potential reversals depending on its position within the broader trend context. The key factor is the market's inability to establish a clear directional bias during the formation period.
What Does a Spinning Top Candlestick Mean?
A spinning top candlestick pattern fundamentally represents market equilibrium and indecision. It signifies that both sellers and buyers were unable to gain the upper hand regarding an asset's price, resulting in a stalemate situation. This balance of forces provides valuable insights into market psychology and potential future movements.
The interpretation of this pattern depends heavily on its context within the broader market trend. When appearing after a strong directional move, the spinning top can signal exhaustion of the prevailing trend and potential reversal. The pattern suggests that the momentum driving the previous trend is weakening, and market participants are uncertain about the next direction.
In practical terms, the spinning top candlestick pattern can serve multiple functions. It may act as an early warning sign of a potential trend reversal, particularly when followed by a confirmation candle. Alternatively, it could signal the continuation of sideways movement, indicating that the market remains in a consolidation phase with no clear directional bias.
Traders should note that the reliability of the spinning top pattern increases significantly when it appears at key support or resistance levels, or after extended trends. The pattern's predictive value is enhanced when combined with other technical indicators, as it provides context for understanding market sentiment and potential price action.
A price reversal becomes more probable when the subsequent candle confirms the prediction through decisive movement in the new direction. This confirmation is crucial because the spinning top alone indicates indecision rather than a definitive directional change.
How to Identify a Spinning Top Candlestick Pattern
Identifying a spinning top candlestick pattern requires attention to specific visual and structural characteristics that distinguish it from other candlestick formations. Mastering these identification criteria is essential for effective application of this trading strategy.
The primary features to recognize include:
-
Body Length: The pattern features a short real body that is slightly longer than a Doji pattern. The body represents the difference between opening and closing prices and should be noticeably smaller than typical candlesticks in the chart.
-
Shadow Symmetry: Spinning top candlesticks have their short real bodies centered between long top and bottom shadows of almost equal length. This symmetry is crucial for pattern validity, as it demonstrates balanced buying and selling pressure.
-
Price Range: The distance between the open and close should be minimal, typically representing only a small percentage of the total price range covered by the candlestick. This narrow range indicates the indecisive nature of the trading period.
-
Wick Proportions: The upper and lower wicks should each be at least two to three times longer than the body length. This proportion ensures that the pattern truly represents significant price movement with minimal net change.
When examining charts, traders should compare the spinning top candidate against surrounding candlesticks to confirm its distinctive appearance. The pattern should stand out due to its unique shape and proportions. Additionally, the color of the body (red or green) is less important than the overall structure, though it can provide additional context about slight bullish or bearish bias.
The spinning top candlestick trading strategy becomes particularly powerful when traders can quickly and accurately identify these patterns in real-time market conditions. This skill, combined with other forms of technical analysis, presents crypto traders with valuable opportunities to make more informed investment decisions and anticipate potential market movements.
Bearish Spinning Top Candlestick Pattern
A bearish spinning top candlestick forms when a crypto asset closes at a slightly lower price than it opened, indicating that mild selling activity has occurred during the trading period. This formation is also known as a spinning top black candlestick, though the actual color may vary depending on the charting platform used.
The bearish interpretation becomes particularly significant when this pattern appears at the peak of an upward trend or following sustained bullish price action. In this context, the spinning top suggests that the bullish momentum driving the market is beginning to weaken, and the bulls are losing their dominant position. This weakening of buying pressure often precedes a trend reversal from bullish to bearish territory.
Traders should understand that the appearance of a bearish spinning top at a trend peak serves as an early warning signal rather than a definitive reversal confirmation. The pattern indicates that buyers who previously pushed prices higher are becoming hesitant, while sellers are starting to test the market's strength. This shift in market dynamics creates the conditions for a potential downward reversal.
The visual representation is often a green or white candlestick (depending on the color scheme), but what matters most is the pattern's position within the broader trend context. The key consideration is not the candlestick's color but rather where it appears in the price action sequence.
Before making investment decisions based on a bearish spinning top pattern, traders should wait for confirmation from the subsequent candlestick. This confirmation typically appears as a candlestick with a decisive downward close, often colored red or black, indicating that sellers have indeed gained control. The confirmation candle should show clear bearish momentum, with a larger body and closing near its low.
In practical trading scenarios, a bearish spinning top at resistance levels or after extended rallies carries more significance. Traders might consider this pattern as a signal to take profits on long positions or prepare for potential short opportunities, always waiting for proper confirmation before executing trades.
Bullish Spinning Top Candlestick Pattern
A bullish spinning top candlestick develops when a crypto asset closes at a slightly higher price than it opened, reflecting mild buying activity during the trading session. This formation is alternatively known as the spinning top white candlestick, representing a subtle shift toward bullish sentiment.
The bullish significance of this pattern becomes most apparent when it occurs at the bottom of a downward trend or after a period of sustained bearish price action. In this position, the spinning top suggests that the selling pressure dominating the market is beginning to exhaust itself, and buyers are starting to challenge the bears' control. This shift in momentum often precedes a trend reversal from bearish to bullish conditions.
When analyzing a bullish spinning top at a trend bottom, traders should recognize it as an early indication that market sentiment is shifting. The pattern shows that sellers, who previously drove prices lower, are losing conviction, while buyers are becoming more willing to enter positions at these lower price levels. This dynamic creates the foundation for a potential upward reversal.
The pattern typically appears as a red or black candlestick (in standard color schemes) at the bottom of a downtrend, though the exact color is less critical than the pattern's structural characteristics and position. What matters most is the context: appearing after a decline, near support levels, or following capitulation selling.
Confirmation of the bullish reversal comes from the subsequent candlestick, which should demonstrate clear upward momentum. This confirmation candle typically appears green or white, with a strong close near its high, indicating that buyers have successfully taken control of the market. The confirmation is essential because the spinning top alone only suggests potential reversal rather than guaranteeing it.
Traders utilizing this pattern should consider additional factors such as trading volume, support levels, and other technical indicators. A bullish spinning top appearing at a significant support level with increasing volume carries more weight than one appearing in isolation. This pattern can signal optimal entry points for long positions, but always requires confirmation and should be combined with proper risk management strategies.
Spinning Top Candlestick Pattern vs Doji Pattern
While the spinning top candlestick pattern shares similarities with the Doji pattern, understanding their differences is crucial for accurate technical analysis and trading decisions. These two patterns are often confused by novice traders, but experienced analysts recognize several distinguishing features that set them apart.
The most fundamental difference lies in the body structure:
-
Body Size: The spinning top candlestick pattern features a small but visible real body, representing a modest difference between opening and closing prices. In contrast, the Doji pattern has virtually no body, with opening and closing prices being nearly identical. Some charting platforms represent the Doji as simply a cross or plus sign due to this minimal body.
-
Price Movement Indication: The spinning top's small body indicates that one side (buyers or sellers) achieved a slight advantage, even though overall indecision prevailed. The Doji's absent body suggests complete equilibrium with no side gaining any advantage whatsoever.
The second major distinction concerns the shadow characteristics:
-
Wick Length: Spinning top candlesticks are characterized by long wicks extending from both sides of the small body, typically two to three times the body length. These extended wicks represent significant price exploration during the trading period. The Doji pattern, conversely, features shorter wicks relative to the spinning top, though the exact length can vary depending on the specific Doji type (such as dragonfly, gravestone, or long-legged Doji).
-
Price Range Representation: The spinning top's longer wicks indicate greater volatility and price range during the formation period, suggesting more active battle between buyers and sellers. The Doji's shorter wicks typically represent less dramatic price swings.
Additional distinguishing factors include:
-
Market Interpretation: While both patterns signal indecision, the spinning top suggests a temporary pause or weakening in trend momentum, whereas the Doji often indicates a more critical turning point or moment of extreme uncertainty.
-
Reliability Context: Spinning tops are generally considered more reliable when appearing after strong trends, while Dojis carry significant weight when appearing at major support or resistance levels.
-
Frequency: Spinning tops appear more frequently in charts than Dojis, as the requirement for nearly identical opening and closing prices makes Dojis relatively rare formations.
Traders should develop the ability to quickly distinguish between these patterns, as their subtle differences can impact trading decisions. Both patterns require confirmation from subsequent price action, but their specific contexts and implications may differ. Understanding these distinctions enhances a trader's ability to interpret market psychology and make more informed trading decisions in the volatile cryptocurrency markets.
How to Use Spinning Top Candlestick in Crypto Trading?
The spinning top pattern demonstrates its greatest significance in markets exhibiting strong directional trends, whether upward or downward. When this pattern emerges within such trending markets, it serves as a crucial signal indicating potential changes in price action and momentum shifts. Understanding how to effectively utilize this pattern can significantly enhance trading decision-making.
Identifying Market Context
To successfully implement the spinning top candlestick trading strategy, traders must first accurately identify the current market trend. This involves analyzing whether the market is in a bullish (upward) or bearish (downward) phase. The trend context provides essential information for interpreting the spinning top's implications.
When a spinning top candlestick forms at the peak of a bullish trend, this typically signals that bears may be gaining momentum and preparing to challenge the bulls' dominance. This scenario often represents a sell signal, suggesting that traders might consider taking profits on long positions or preparing for potential short opportunities. The pattern indicates that the buying pressure that drove the uptrend is weakening, creating conditions for a possible reversal.
Conversely, when a spinning top candlestick appears at the bottom of a bearish trend, this generally constitutes a buy signal. The pattern suggests that bulls are beginning to accumulate strength and may soon gain control of the market. Traders might interpret this as an opportunity to establish long positions, anticipating an upward reversal.
Confirmation Strategy
The candlestick immediately following the spinning top plays a critical role in confirming the predicted trend direction. This confirmation candle validates or invalidates the reversal signal suggested by the spinning top pattern.
For example, when a spinning top appears at the bottom of a bearish trend (indicating downward momentum), the confirmation would be a bullish or green candlestick showing strong upward movement. This confirmation demonstrates that buyers have indeed taken control and are pushing prices higher.
Similarly, in a bearish trend reversal scenario, if a spinning top forms at the top of a bullish trend, the confirmation would be a bearish or red candlestick with decisive downward movement. This confirms that sellers have gained the upper hand and are driving prices lower.
As illustrated in practical trading scenarios, when a red spinning top candlestick forms after a strong bullish trend and is followed by a confirmation candle, this often marks the beginning of a strong bearish trend where the bear market gains significant momentum. The confirmation provides traders with greater confidence in their trading decisions.
Sideways Market Interpretation
When a spinning top occurs within a sideways trading range rather than at a trend extreme, the interpretation differs. If the confirmation candle shows that price remains within the established range, this indicates continued market indecision and uncertainty. In such cases, traders might choose to wait for a clearer directional signal before entering positions.
To maximize the effectiveness of the spinning top candlestick strategy, it's essential to combine it with complementary technical analysis methods. This multi-indicator approach helps validate signals and reduces the risk of false signals.
Support and Resistance Strategy Integration:
The spinning top pattern becomes particularly powerful when combined with support and resistance levels. When a spinning top forms at a support level, the probability of an upward trend reversal increases significantly. The support level provides a foundation where buying interest typically emerges, and the spinning top pattern confirms this potential reversal point.
However, when a spinning top appears in the middle of a trend, positioned between support and resistance levels, the market is more likely to continue moving in the direction of the existing trend. This scenario suggests that the pattern represents a temporary pause rather than a reversal signal.
Trendline Strategy Integration:
The spinning top candlestick strategy also works effectively in conjunction with trendline analysis. When a spinning top forms precisely on a trendline—whether an uptrend line or downtrend line—this convergence strongly indicates that the current trend will reverse. The trendline provides a reference point for trend strength, and the spinning top signals that this trend is losing momentum at a critical juncture.
Risk Management Considerations
Traders should always implement proper risk management when trading based on spinning top patterns. This includes:
- Setting appropriate stop-loss orders below support levels for long positions or above resistance levels for short positions
- Sizing positions appropriately based on account size and risk tolerance
- Waiting for confirmation before entering trades
- Considering the broader market context and multiple timeframe analysis
Practical Application Tips
For optimal results, traders should:
- Monitor spinning top formations on higher timeframes (4-hour, daily) for more reliable signals
- Pay attention to volume accompanying the pattern—higher volume increases reliability
- Consider the pattern's position relative to key price levels
- Use multiple confirmation methods rather than relying on a single indicator
- Practice identifying patterns on historical charts before applying them to live trading
By systematically applying these principles and maintaining discipline in waiting for confirmations, traders can effectively incorporate the spinning top candlestick pattern into their cryptocurrency trading strategies, potentially improving their ability to identify trend reversals and optimal entry or exit points.
Conclusion
Cryptocurrency markets are characterized by high volatility and constantly evolving signals and trends, creating a challenging environment for traders at all experience levels. For new investors, this dynamic landscape can be particularly confusing and frustrating, as the rapid pace of change makes it difficult to keep up with shifting trends and make accurate, timely decisions.
The spinning top candlestick pattern offers a valuable tool for navigating this complexity. While numerous signals and technical analysis indicators are available for cryptocurrency trading, the spinning top candlestick strategy stands out as an accessible yet powerful approach, especially when used in combination with other technical analysis tools.
For beginners, the spinning top pattern provides a clear visual signal that is relatively easy to identify once the basic characteristics are understood. Its appearance signals moments of market indecision that often precede significant price movements, giving traders advance warning of potential trend changes. This early warning capability, when properly confirmed, can help traders position themselves advantageously before major market moves occur.
However, it's crucial to emphasize that the spinning top pattern should never be used in isolation. The most successful traders combine this pattern with:
- Support and resistance analysis to identify key price levels
- Trendline analysis to understand overall market direction
- Volume indicators to confirm the strength of signals
- Multiple timeframe analysis to validate patterns
- Risk management principles to protect capital
Traders should also recognize the limitations of any single indicator. The spinning top pattern, like all technical analysis tools, is not infallible and can produce false signals. This is why confirmation from subsequent price action is essential before making trading decisions.
For those beginning their journey in cryptocurrency trading, starting with the spinning top candlestick strategy, combined with fundamental understanding of market dynamics and proper risk management, can provide a solid foundation. As traders gain experience, they can expand their toolkit with additional indicators and refine their interpretation of patterns within different market contexts.
Ultimately, successful trading requires patience, discipline, and continuous learning. The spinning top candlestick pattern represents one piece of a larger puzzle, and its effective use depends on understanding both its strengths and limitations within the broader framework of technical analysis and market understanding.
FAQ
What is a Spinning Top candlestick pattern and what does it indicate in crypto trading?
A Spinning Top is a small-bodied candlestick with long wicks, indicating market indecision. It signals potential trend reversals in crypto trading, showing neither bulls nor bears dominate price action at that moment.
How do you identify and recognize a Spinning Top pattern on cryptocurrency price charts?
A Spinning Top has a small body with long upper and lower wicks, indicating market indecision. Look for this pattern after price movements to identify potential trend reversals or continuations.
What are the trading signals and market implications of a Spinning Top candlestick?
A Spinning Top signals market indecision with long upper and lower shadows showing sharp price swings. Traders typically await confirmation before entering positions. It indicates potential volatility and reversals, suggesting caution in trading decisions.
How should you use Spinning Top patterns in combination with other technical indicators for crypto trading?
Combine spinning tops with RSI, MACD, or Bollinger Bands for confirmation. Look for volume surges and divergences. Use multiple indicators together to strengthen reversal signals and improve entry/exit accuracy in crypto markets.
What is the difference between a Spinning Top and other similar candlestick patterns like Doji?
A Spinning Top has a small but noticeable body with long wicks, indicating indecision. A Doji has an almost nonexistent body with nearly identical open and close prices, showing stronger equilibrium between buyers and sellers.
What are the risks and limitations of trading based on Spinning Top patterns in cryptocurrency markets?
Spinning Top patterns often generate false signals due to market indecision, lacking clear directional bias. This ambiguity increases trading losses and missed opportunities. Relying solely on this pattern is risky; always combine with additional technical indicators for confirmation before executing trades.
* The information is not intended to be and does not constitute financial advice or any other recommendation of any sort offered or endorsed by Gate.