Learn how to recognize, interpret, and apply the Hanging Man pattern in trading to forecast potential trend reversals. Discover candlestick trading strategies for the cryptocurrency market on Gate and other major exchanges.
What Is the "Hanging Man" Pattern?
In technical analysis of the cryptocurrency market, the "hanging man" is a bearish candlestick pattern that signals a likely reversal of an uptrend. This pattern usually forms at the top of a bullish market move and indicates that buyer momentum has faded and selling pressure is starting to take over.
Because the crypto market is highly volatile, prices can shift in a matter of minutes. Market participants rely on various tools to anticipate price movements. The "hanging man" candlestick pattern is one such trading signal that helps traders make more informed decisions.
The "hanging man" only appears on candlestick charts, as it's a candlestick pattern by definition. Candlestick charts are widely used by market participants because they provide comprehensive information about price action, trading volumes, and overall market sentiment. For this reason, many traders incorporate candlestick patterns into their strategies to improve the effectiveness of their analysis.
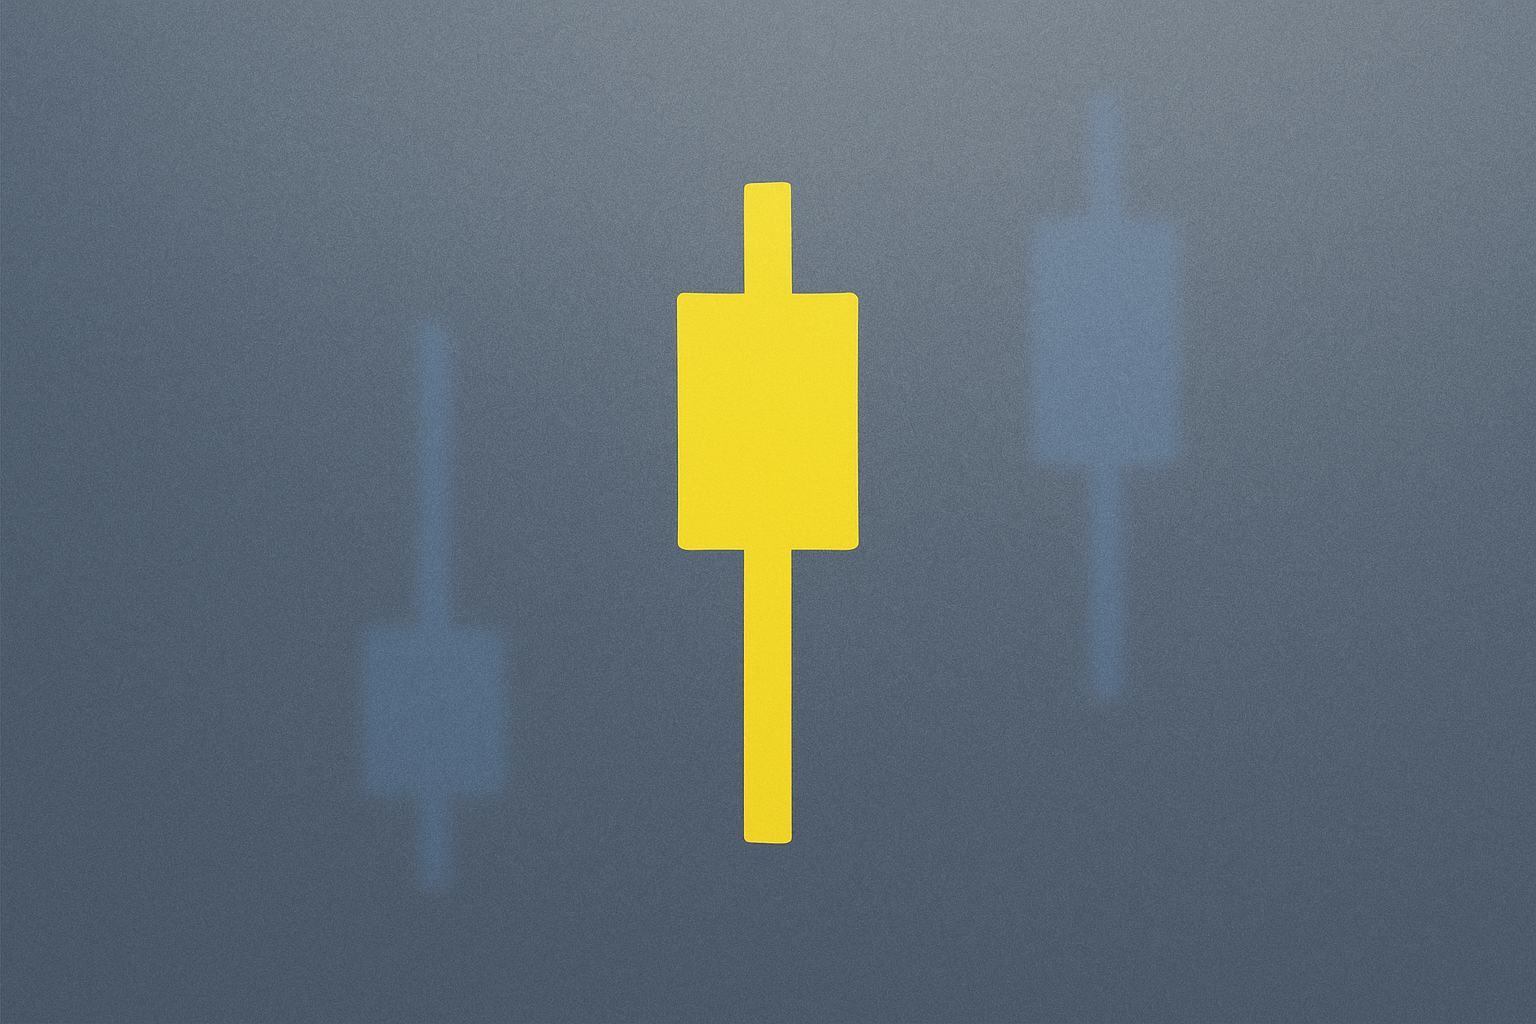
What Does a "Hanging Man" Candlestick Look Like?
The "hanging man" is the bearish version of the classic "hammer" pattern. It forms when the opening price is above the closing price, creating a distinct visual profile. The main identifying features of this pattern are:
- A relatively small body, indicating a narrow gap between the open and close prices
- A long lower wick (or shadow), at least twice the length of the body
- A minimal or nonexistent upper wick
The long lower wick shows there was strong selling pressure during the session, driving the price much lower. However, buyers managed to push the price back up somewhat by the close, though not enough to reach the opening price.
The candlestick may have a small upper wick, but it should be much shorter than the lower wick. This points to weak buying pressure and buyers’ inability to maintain control over price movement.
How to Interpret the Hanging Man Candlestick Pattern
Traders use the "hanging man" pattern to gain insight into a potential change in asset price direction. The extended lower wick is key and indicates aggressive selling during the trading period.
Accurate identification of the "hanging man" requires the closing price to be below the opening price, confirming its bearish character. If the closing price is above the opening price but there's a long lower wick, this pattern is called a "bullish hammer" and means the opposite.
Context is crucial. The "hanging man" is only a reliable reversal signal when it forms after a sustained uptrend or near significant resistance levels. If it appears mid-trend or during a downtrend, it doesn't carry the same predictive weight.
How to Trade Using the "Hanging Man" Candlestick Pattern
When traders spot a "hanging man" in market analysis, they often see it as a potential cue to open short positions or close out longs. Its bearish nature points to a likely trend reversal from bullish to bearish.
However, professional traders never base decisions on a single pattern. Relying on just one indicator significantly increases the risk of acting on false signals. For example, buying pressure could remain strong, but a brief wave of selling from profit-taking or other short-term events might trigger the pattern. That doesn’t mean buyers have lost control.
To reduce risk and improve accuracy, use the "hanging man" together with other technical indicators, such as:
- Volume indicators to confirm the strength of the move
- Support and resistance levels
- Moving averages to assess the overall trend
- Oscillators (RSI, MACD) to gauge if the market is overbought
It's also wise to wait for confirmation from a subsequent bearish candlestick before entering a position.
Pros and Cons of the "Hanging Man" Candlestick Pattern
The "hanging man" can serve as an early warning for potential shifts in price action. However, like any technical analysis tool in crypto, it comes with both strengths and limitations that traders must keep in mind.
Pros:
-
Trend Reversal Signal: This pattern clearly points to a possible transition from bullish to bearish, alerting traders to changing market sentiment and offering a chance to adjust positions promptly.
-
Easy to Identify: Its distinct visual characteristics — a small body and a long lower wick — make it easy to spot, even for novice traders, without special tools.
-
Resistance Level Confirmation: When a "hanging man" forms near a major resistance level, it can further validate the strength of that zone and the likelihood of a downward price bounce.
-
Versatile Application: The pattern works across multiple timeframes, from minute-by-minute charts for short-term trades to daily or weekly charts for long-term analysis.
Cons:
-
Risk of False Signals: The "hanging man" can generate false reversal alerts, especially in volatile crypto markets. This exposes traders to potential losses or missed opportunities.
-
Requires Contextual Analysis: Before reacting, traders must consider the broader market context, including longer-term trends, fundamentals, and macroeconomic conditions. Ignoring context can lead to misreading the signal.
-
Subjective Interpretation: Traders may differ on how to judge the strength and significance of the pattern. For example, views may vary on how long the lower wick must be to validate the signal.
-
Needs Confirmation: The pattern requires confirmation from other indicators, making the decision process more complex and demanding more advanced technical analysis skills.
How the "Hanging Man" Compares to Other Candlestick Patterns
The "hanging man" belongs to the hammer family of patterns, which take different forms and meanings depending on market context. Understanding these differences is crucial for accurate market analysis.
Hammer Candlestick
The classic hammer forms when the closing price is higher than the opening price, creating a bullish body. Like the "hanging man," the hammer has a long lower wick, showing strong selling pressure during the session. However, the key distinction is that buyers not only recovered but also closed above the open.
This means buyers retained control despite selling activity. As a result, the "hammer" is viewed as a bullish signal, especially after a downtrend. There's also an inverted hammer variant, which has a long upper wick instead of a lower one and can also be bullish in certain setups.
Shooting Star Candlestick
The "shooting star" pattern is a bearish signal that visually resembles an inverted hammer but has the opposite meaning. It predicts a likely price drop and forms at the top of an uptrend.
The "shooting star" appears when the opening price is much higher than the close, resulting in a small bearish body at the bottom of the candle. Its defining feature is a long upper wick, showing that buyers tried to push prices up but met strong resistance, driving the price back to or below the open.
The main distinction between the "hanging man" and "shooting star" is wick direction: the "hanging man" has a long lower wick, while the "shooting star" has a long upper wick. Both are bearish reversal signals, but they occur in different price zones and reflect different market dynamics.
Why Pay Attention to the "Hanging Man" Candlestick?
The "hanging man" is a valuable tool for technical analysis in the crypto market. It's especially useful for spotting potential bearish reversals and identifying reliable resistance zones, helping traders make better entry or exit decisions.
Still, this pattern has important limitations. The main risk is false signals, especially in highly volatile crypto markets. Traders should be cautious and avoid immediately opening positions after spotting the pattern.
Never rely on this signal alone or assume its appearance guarantees a trend reversal. Crypto market dynamics are driven by many factors, and no single indicator is 100% accurate.
The "hanging man" is an effective early warning thanks to its visual clarity and relative ease of interpretation. If you spot this pattern, use additional technical indicators — such as trading volume, moving averages, Fibonacci levels, or oscillators — to confirm the signal. It's also wise to do fundamental analysis, considering news, market sentiment, and macroeconomic factors, before making a final trading decision.
A comprehensive approach — combining candlestick patterns with other tools and methods — greatly increases your odds of trading success and helps minimize risk in the unpredictable crypto market.
FAQ
What Are the Characteristics of the "Hanging Man" Candlestick Pattern and How Can You Identify It?
The "hanging man" pattern is a candlestick with a small body near the top and a long lower wick (at least twice the body’s length). It forms after an uptrend and signals a possible reversal downward. The closing price is near the open, showing that buyers rejected higher prices.
What Does the Appearance of the "Hanging Man" Pattern Indicate? Is It Bullish or Bearish?
The "hanging man" pattern usually appears after an uptrend and signals a possible downward reversal. It's a bearish signal that points to increased selling pressure and the potential for price decline.
What’s the Difference Between the Hanging Man and Hammer Candlesticks?
The hanging man and hammer look alike, both with a long lower wick and a small body. The difference is in their placement: the hammer forms at the bottom of a downtrend and signals a reversal upward, while the hanging man forms at the top of an uptrend and signals a possible decline. Position determines their technical meaning.
How Do You Use the "Hanging Man" Pattern in Actual Trading?
The "hanging man" signals a potential downward reversal. Use it as a cue to sell or open a short position after confirmation from the next candle. Combine it with support levels, volume, and other indicators to improve entry accuracy.
How Reliable Is the "Hanging Man" Candlestick Pattern? Is the Success Rate High?
The "hanging man" pattern has moderate reliability — about 60–65% when properly confirmed. Its effectiveness depends on market context, support levels, and volume. It performs best in trending markets. Use additional indicators to boost signal reliability.
Which Technical Indicators Should You Use to Confirm a "Hanging Man" Pattern?
To confirm a "hanging man" pattern, use support and resistance indicators, trading volume, and moving averages. Combine with RSI and MACD to test the strength of the reversal signal. Check support levels below the pattern.
* The information is not intended to be and does not constitute financial advice or any other recommendation of any sort offered or endorsed by Gate.