The "Hanging Man" pattern in trading serves as a bearish trend reversal indicator on cryptocurrency charts. Discover how to recognize this candlestick, execute trades using this pattern on Gate, and minimize false signals. Explore effective strategies for traders.
What Is the Hanging Man Pattern?
In technical analysis of the cryptocurrency market, the Hanging Man is a bearish candlestick pattern that acts as a key indicator of a potential trend reversal. This pattern typically develops at the peak of an uptrend and signals that bullish momentum is fading as sellers begin to take control.
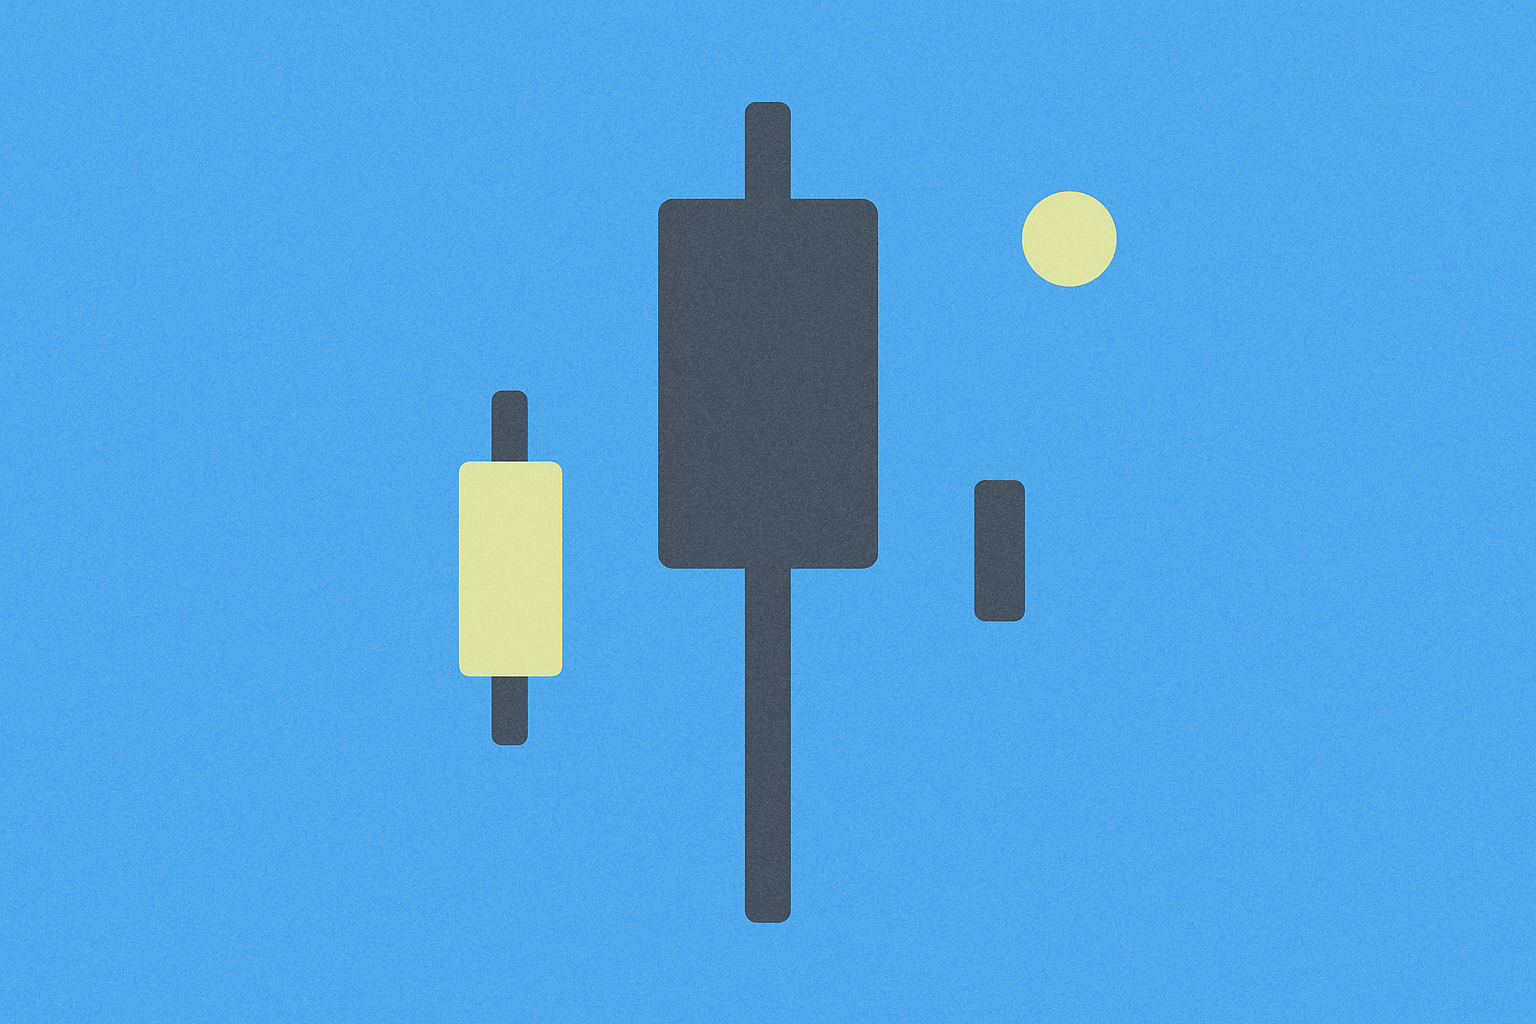
As a type of candlestick pattern, the Hanging Man is visible only on candlestick charts. In recent years, this charting method has gained significant popularity among traders because it presents comprehensive market data in a compact format. Candlestick charts display four essential price points over a specific period: open, close, high, and low. As a result, many professional traders incorporate candlestick patterns into their trading strategies as a core decision-making tool.
Understanding the market psychology behind this pattern helps traders make more informed decisions. When a Hanging Man appears, it means that sellers pushed the price down sharply during the session, but by the close, buyers managed to recover some ground, though not enough to bring the price back to the opening level.
How Does a Hanging Man Candle Look?
The Hanging Man candle is the bearish version of the well-known Hammer pattern and has distinct visual traits. It forms when the session's opening price is higher than the closing price, producing a characteristic candlestick structure.
The key features of this pattern are:
- A relatively small candle body, showing minimal difference between open and close prices
- A long lower wick (shadow), at least twice the size of the body, indicating significant selling pressure during the session
- A minimal or absent upper wick, signaling weak or nonexistent buying pressure
The lower wick's length is critical for identifying the pattern. It shows that sellers were able to drive the price down significantly at some point during the session, but buyers partially reversed those losses by the close. However, since the closing price remains below the opening price, this signals waning bullish sentiment in the market.
How to Interpret the Hanging Man Candlestick Pattern
Traders use the Hanging Man candle to predict future price movements. The long lower wick provides visual evidence of intense bearish activity during the trading session.
Proper pattern identification requires the closing price to be below the opening price. If the opposite is true—with the close above the open and a similar wick structure—the pattern is a Bullish Hammer, which has the opposite meaning.
From a psychological perspective, the Hanging Man represents a key moment of struggle between buyers and sellers. The long lower wick indicates that sellers made an aggressive attempt to lower the price, causing a significant drop within the session. Buyers managed to recover some of these losses by pushing the price up from the session low. However, they did not have enough strength to close above the opening price, indicating that bullish momentum is weakening.
This pattern is especially relevant after a sustained uptrend or near major resistance levels. In these situations, the Hanging Man may indicate that buying demand has been exhausted and the market is primed for a correction or reversal.
How to Trade the Hanging Man Candlestick Pattern
If you spot a Hanging Man during your analysis, it’s traditionally seen as a signal to open short positions or close long positions, as the pattern is bearish and suggests a potential trend reversal.
However, relying solely on the Hanging Man for trading decisions is highly risky. Using a single pattern in isolation often leads to false signals. The market may still be dominated by buyers, with a temporary spike in selling caused by profit-taking or short-lived news, which doesn’t necessarily mean the trend has reversed.
To improve signal reliability, it’s recommended to:
- Use additional technical indicators such as RSI, MACD, or moving averages for confirmation
- Analyze trading volume—an increase during the Hanging Man pattern strengthens the signal
- Wait for confirmation from the next bearish candle that closes below the Hanging Man’s body
- Consider the overall market context and key support/resistance levels
- Set a stop-loss above the Hanging Man’s high to limit potential losses
- Set profit targets based on the nearest support levels or use at least a 1:2 risk/reward ratio
This comprehensive approach helps filter out false signals and increases the likelihood of successful trades.
Pros and Cons of the Hanging Man Candlestick Pattern
The Hanging Man pattern is a valuable early warning tool for potential price changes. Like all technical analysis tools in crypto, however, it comes with both significant advantages and important limitations that must be considered.
Pros:
Signals Trend Reversal: The Hanging Man effectively highlights a potential shift from a bullish to a bearish trend, giving traders early warning of changing market sentiment. This allows traders to adjust positions and strategies in time, protecting profits or avoiding losses from a trend reversal.
Easy to Identify: With its distinct visual features—a small body and a long lower wick—the pattern is easily recognized, even by beginners. This makes it accessible to a broad range of market participants and doesn’t require deep knowledge of complex indicators.
Confirms Resistance Levels: When a Hanging Man forms near a strong resistance level, it can provide additional confirmation of that level’s strength. This helps traders make more informed decisions about entering short positions or exiting long ones.
Cons:
Risk of False Signals: The Hanging Man can generate false signals, especially in volatile crypto markets. In such cases, traders may make mistakes leading to losses or missed opportunities. False signals are especially common on lower timeframes or in sideways markets.
Context Required: Before reacting to a Hanging Man, it’s critical to evaluate the broader market context, including long-term trends, support and resistance levels, and fundamental factors. Ignoring context may result in misinterpreting the signal or missing genuinely profitable trades.
Subjectivity in Interpretation: Traders may assess the strength and significance of the Hanging Man pattern differently. Criteria such as the required length of the lower wick or body size may vary between individuals. This subjectivity can lead to differences in trading decisions and outcomes.
How the Hanging Man Compares to Other Candlestick Patterns
The Hanging Man belongs to the broader Hammer family of candlestick patterns, each with its own characteristics and trading implications. Understanding these differences is crucial for accurate interpretation of market signals.
Hammer Candle
The traditional Hammer forms when the closing price is above the opening price, in contrast to the Hanging Man. Although both patterns have a long lower wick indicating significant selling during the session, a close above the open means buyers still control the market and have successfully rejected lower prices. As a result, the Hammer is considered a bullish signal, especially at the bottom of a downtrend.
There is also an Inverted Hammer, which features a long upper wick instead of a lower wick but also has a bullish bias. This pattern shows buyers attempted to push the price higher, met resistance, but still closed above the opening price.
Shooting Star Candle
The Shooting Star is a bearish signal similar to the Hanging Man in meaning, but with a different visual structure. It resembles an inverted hammer, forms at the top of an uptrend, and has a distinctly bearish profile. The Shooting Star suggests a potential price drop and trend reversal.
The Shooting Star occurs when the opening price is above the closing price, and the candle has a long upper wick and small body. The long upper wick indicates that buyers attempted to continue the uptrend, but sellers pushed the price back to or below the opening. This demonstrates growing bearish sentiment and potential exhaustion of bullish momentum.
The key difference between the Hanging Man and the Shooting Star is wick orientation: the Hanging Man has a long lower wick, while the Shooting Star’s long wick points upward. Both patterns, however, are bearish signals that may indicate a reversal in an uptrend.
Why Pay Attention to the Hanging Man Candle?
The Hanging Man is a valuable technical analysis tool for both novice and seasoned traders. This pattern is especially effective for detecting potential bearish reversals and identifying reliable resistance levels on cryptocurrency charts.
However, it’s essential to recognize this tool’s limitations. The primary risk in using the Hanging Man is reacting to false signals, which often occur in high volatility or low trading volume environments. Traders should exercise caution and use extra filtering methods to validate these signals.
Never rely solely on this pattern or treat its appearance as a guaranteed trend reversal. In the cryptocurrency market, all forecasts and signals are probabilities, not certainties. The Hanging Man is a useful indicator thanks to its visual clarity and straightforward interpretation, making it accessible for a wide audience.
If you spot a Hanging Man on the chart, always use additional technical indicators and analysis methods to confirm your trading hypothesis before opening or closing a position. A comprehensive approach—reviewing trading volumes, other candlestick patterns, trend indicators, and key support or resistance levels—greatly increases your chances of trading success and helps prevent costly mistakes in volatile crypto markets.
FAQ
What is the Hanging Man candlestick pattern and what are its characteristics?
The Hanging Man is a bearish pattern that forms in an uptrend. Key traits: a small candle body near the top, a long lower wick (2–3 times the body size), and a minimal upper wick. It signals a potential downward reversal and weakening buying pressure.
What is the difference between the Hanging Man and Hammer patterns? How do you tell them apart?
Both patterns have the same shape with a long lower wick, but their position differs. The Hammer forms in a downtrend and signals a reversal upward. The Hanging Man appears in an uptrend and signals a potential decline. Context within the trend is crucial.
How should you trade after the Hanging Man pattern appears, and what market signal does it give?
The Hanging Man pattern signals a potential trend reversal. After it appears, wait for confirmation (a close below the opening level) and enter a short position with a stop-loss above the candle’s high. Higher trading volume helps confirm the bearish reversal.
What are the identification criteria for the Hanging Man pattern, and what technical requirements must be met?
The Hanging Man is identified by these features: a small candle body near the top of the range, a long lower wick (at least twice the body size), and a minimal upper wick. Confirmation from the next bearish candle and increased trading activity are required.
How reliable is the Hanging Man pattern on different timeframes?
The Hanging Man is most reliable on higher timeframes (4H, D, W). On lower timeframes (1H, 15M), signals are less accurate due to market noise. For better reliability, combine with support levels and trading volume. On daily charts, it performs best for trend reversals trend.
What confirmation signals should you look for after the Hanging Man pattern forms? What conditions should be met before trading?
After a Hanging Man forms, look for confirmation on the next candle: a close below the Hanging Man’s body, rising trading volume, and a break of the support level. These signal it’s time to consider a short position.
How does the Hanging Man pattern relate to other bearish candlestick patterns (e.g., Dark Cloud Cover)?
The Hanging Man and Dark Cloud Cover are both bearish reversal signals. They indicate waning buying strength and potential price drops. The Hanging Man appears after an uptrend, while the Dark Cloud Cover requires two candles. Both serve as warnings of a possible correction.
What are the risks and limitations of trading with the Hanging Man pattern?
The Hanging Man has limitations: it requires confirmation on the next candle, may give false signals during sideways markets, and depends on trading volume and context. Its effectiveness decreases in highly volatile conditions and requires sound position management.
* The information is not intended to be and does not constitute financial advice or any other recommendation of any sort offered or endorsed by Gate.