Discover the Hanging Man candlestick in technical analysis: definition, identification techniques, and proven trading strategies. Master the use of this classic pattern to anticipate bearish reversals on Gate and make better-informed cryptocurrency investment decisions.
Navigating the cryptocurrency market is often challenging. Given the market’s volatility, crypto prices can shift in an instant. This forces market participants to continually anticipate what comes next. One common approach is to use trading signals and technical indicators derived from chart patterns. For instance, the hanging man candlestick is a widely used trading signal for predicting potential bearish reversals.
This article offers a comprehensive explanation of the hanging man candlestick—what it is, how to recognize it, and how traders can capitalize on this pattern. By understanding its features and practical application, traders can improve investment decision-making in highly volatile markets.
What Is the Hanging Man Candlestick?
In technical analysis, the hanging man candlestick is a bearish reversal pattern. It typically forms at the top of an uptrend, signaling that bullish momentum has faded and a reversal may be imminent.
Because the hanging man is a candlestick pattern, it appears exclusively on candlestick charts. These charts have become increasingly popular due to their ability to present a wealth of market information. Candlestick charts display not only opening and closing prices but also session highs and lows, providing a holistic view of market action. As a result, candlestick patterns are integral to many trading strategies.
What Does the Hanging Man Candlestick Look Like?
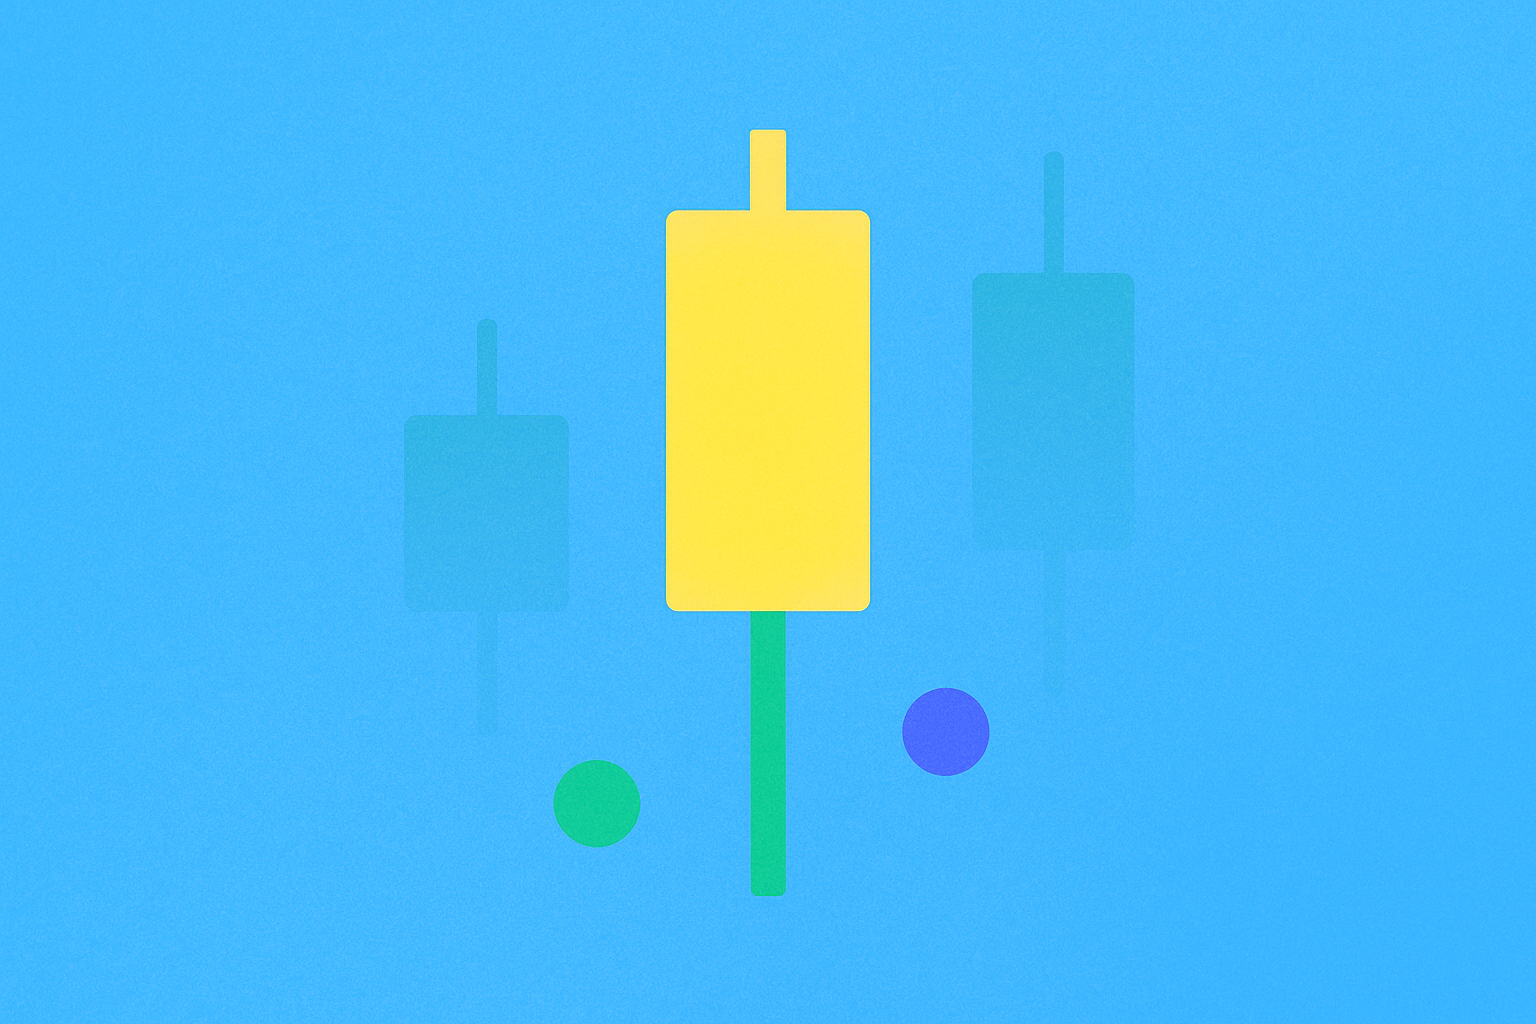
The hanging man is essentially the bearish counterpart to the hammer candlestick, forming when the opening price is higher than the closing price. It features a relatively small body and a long lower wick, indicating heavy selling pressure.
Typically, the real body accounts for about one-third of the candle’s total length, while the lower wick is at least two to three times the body’s length. This structure indicates that during the session, the price dropped sharply but partially recovered before the close.
The candle may also have an upper wick, though it is significantly shorter than the lower wick, reflecting weak buying pressure. The stark contrast between the upper and lower wicks is a key identifier for the hanging man pattern and helps differentiate it from similar candlesticks.
How to Read the Hanging Man Candlestick Pattern
Traders use the hanging man pattern to better forecast future price movements. A long lower wick highlights significant selling pressure during the session. However, as previously noted, the closing price must fall below the opening price for a legitimate hanging man pattern.
When analyzing this pattern, traders should focus on its position. The hanging man is only meaningful when it forms after a sustained uptrend, usually near the market’s peak. If it appears mid-uptrend or at the beginning, its predictive value drops significantly.
If the closing price is above the opening price, it forms a bullish hammer instead, revealing a very different market sentiment. This makes it essential to accurately assess the relationship between opening and closing prices in technical analysis.
How to Trade with the Hanging Man Candlestick Pattern
If you identify a hanging man candlestick during market analysis, traders often treat this as a sell signal, since it marks the beginning of a potential bearish reversal.
In practice, many experienced traders wait for confirmation from the following candle before acting. For example, if the next candle is strongly bearish with high volume, this provides strong confirmation of a reversal indicated by the hanging man.
However, it’s important not to rely solely on the hanging man pattern. No single candlestick should be used in isolation, as it can produce false signals. For example, sustained buying pressure may remain, but a sudden sell-off could be triggered by temporary external factors. This doesn’t always mean buyers have lost control.
Therefore, always use the hanging man in combination with other indicators such as RSI, MACD, or moving averages to minimize false signals. Layering multiple tools increases the reliability of your trading decisions.
Advantages and Disadvantages of the Hanging Man Candlestick Pattern
The hanging man pattern can be an effective early warning sign for sudden price shifts. Like all tools in crypto trading, however, it has both strengths and limitations investors should weigh carefully.
Advantages:
-
Signals a potential reversal from bullish to bearish, alerting traders to changes in market sentiment. This gives investors time to prepare and adjust their strategies.
-
Easy to spot due to its distinctive features. The small body and long lower wick make it stand out on charts, even for beginners.
-
Helps confirm resistance levels, especially when forming near major resistance. This enables traders to set more effective stop-loss or take-profit orders.
Disadvantages:
-
The hanging man can produce false signals, especially in volatile markets. In such cases, traders may make poor decisions, lose money, or miss better opportunities by closing positions too soon.
-
It’s critical to consider overall market context before acting on a hanging man signal. If this step is skipped, traders could miss out on potential opportunities or make unsound decisions.
-
Interpretation can be subjective. Different traders may set varied thresholds for the pattern’s strength and relevance, leading to inconsistent trading outcomes.
Comparing the Hanging Man to Other Candlestick Patterns
The hanging man is a bearish form of the hammer candlestick. Hammer patterns come in both bullish and bearish forms, each carrying specific meaning in technical analysis.
Hammer Candlestick
A traditional hammer forms when the closing price is above the opening price, resembling the hanging man in shape. However, despite the presence of strong selling pressure (reflected by a long lower wick), the hammer signals buyers are still in control, pushing prices up by session close.
Thus, it’s a bullish signal most often seen at the end of a downtrend. The inverted hammer can also appear as a bullish indicator, but with a long upper wick instead of a lower one.
Shooting Star Candlestick
The shooting star is a bearish reversal pattern, similar in shape to the inverted hammer. The difference is that the shooting star appears after an uptrend and signals a sharp price drop may be coming.
The shooting star forms when the opening price is above the closing price, with a long upper wick showing sellers drove the price down from session highs. Both patterns—hanging man and shooting star—indicate possible reversals, but differ in wick placement.
Why Focus on the Hanging Man Candlestick Pattern?
The hanging man pattern is a valuable tool in technical analysis, especially for identifying bearish reversals and strong resistance. Its early warning capability gives traders time to adjust their strategies.
However, it also carries some drawbacks. The risk of false signals is significant, so traders should not rely solely on this pattern for their decisions.
Never depend on this signal alone or assume a trend will reverse immediately upon its appearance. In the highly volatile crypto market, all signals are relative and should be confirmed by additional evidence.
The hanging man is useful because it’s easy to spot and carries clear meaning in technical analysis. After spotting this pattern, always use additional technical indicators—such as volume, trendlines, or fundamental analysis—to confirm market moves before making final trading decisions. Using multiple methods increases success rates and reduces risk in crypto trading.
FAQ
What Is the Hanging Man Candlestick Pattern? What Are Its Features?
The Hanging Man is a bearish candlestick with a small upper body and long lower wick, appearing after an uptrend. Key features: the close is near the open, and the lower wick accounts for about two-thirds of the candle’s length. It signals a possible bearish reversal and is often viewed as a sell signal.
How Do You Identify the Hanging Man on a Price Chart?
The Hanging Man has a small upper body, a long lower wick (at least twice the body’s length), and a short or absent upper wick. Appearing after an uptrend, it warns of a likely bearish reversal. The close is near the open, revealing strong late-session selling pressure.
What Does the Hanging Man Indicate? What’s Its Significance in Technical Analysis?
The Hanging Man signals a possible bearish reversal. It appears when the close is near the session high, but a long lower wick indicates growing selling pressure. This tells investors to watch for potential weakness in the current uptrend.
What’s the Difference Between the Hanging Man and Hammer Candlesticks?
Both feature small bodies and long lower wicks, but their locations differ. Hammers follow downtrends and signal bullish reversals; hanging man patterns form after uptrends and warn of bearish reversals. The market context determines their meaning.
How Do You Trade the Hanging Man Signal?
Identify a Hanging Man by its long lower wick and small body near market tops. When it appears at a high, wait for bearish confirmation in subsequent candlesticks, then consider opening a sell position. Use indicators such as RSI to improve the reliability of reversal signals.
How Reliable Is the Hanging Man Pattern? What Risks Are Involved?
The Hanging Man has about 60–70% reliability when used with other indicators. The main risk is false signals in volatile markets, so always confirm with the next candlestick and trading volume for greater accuracy.
* The information is not intended to be and does not constitute financial advice or any other recommendation of any sort offered or endorsed by Gate.