In-depth guide to the Hanging Man pattern in crypto trading. Discover how to spot this classic bearish setup, identify trend reversal indicators, and apply proven trading strategies on Gate to maximize your profits in the cryptocurrency market.
Introduction to the Hanging Man Candlestick Pattern
Navigating the cryptocurrency market can be complex. Its high volatility means prices can change in an instant, presenting both opportunities and risks for participants. Traders and investors must continuously assess market conditions and attempt to predict what will happen next. They use a variety of trading signals and technical indicators—chart patterns that help inform sound trading decisions.
One key tool is the Hanging Man candlestick pattern—a bearish trading signal that helps market participants anticipate potential trend reversals from bullish to bearish. Understanding this pattern enables traders to secure profits or enter short positions at the right moment.
This guide explores the Hanging Man pattern in detail, covering its chart appearance, interpretation, and strategic application.
What Is the Hanging Man Pattern
In technical analysis, the Hanging Man is a bearish candlestick formation that signals a likely reversal of an upward trend. The pattern is named for its distinctive shape, which resembles a hanging figure with extended legs and a small body.
The Hanging Man candle generally appears at the peak of an uptrend or after sustained price growth, signaling that buyer momentum is fading and selling pressure is emerging. Its presence warns of a possible shift in market sentiment.
As a type of Japanese candlestick, the Hanging Man appears exclusively on candlestick charts. These charts are increasingly favored by traders because they compactly display crucial market data—open, close, high, and low prices for a specific period.
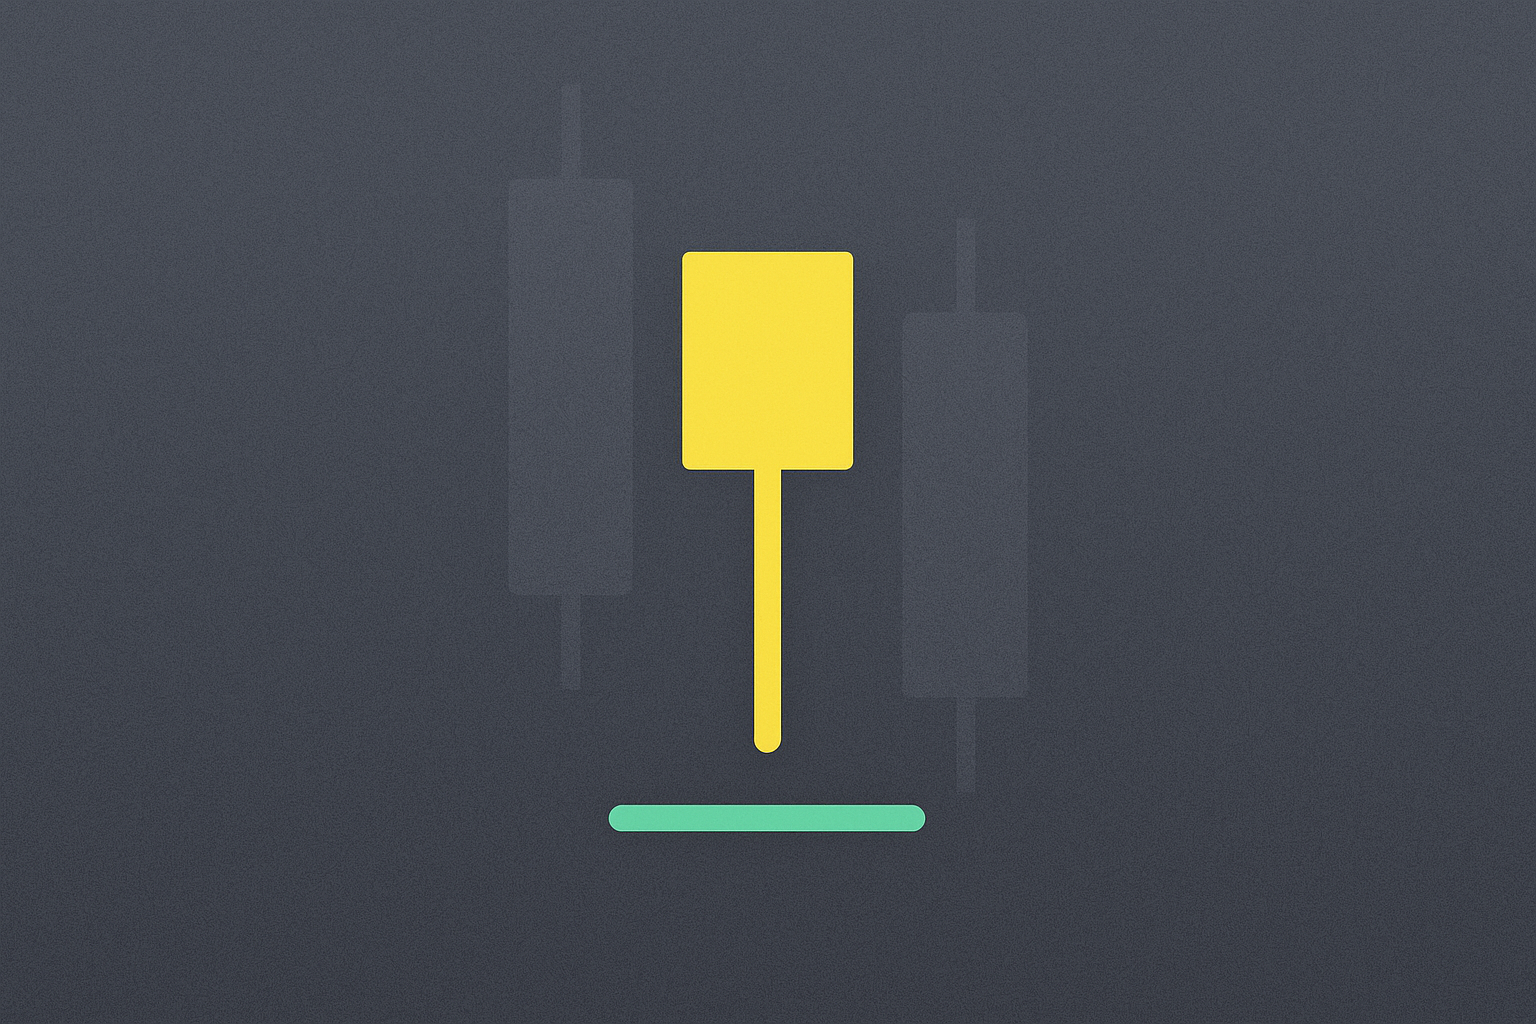
What Does a Hanging Man Candle Look Like
The Hanging Man candle is the bearish version of the Hammer, featuring distinctive visual traits. It forms
FAQ
What Is the Hanging Man Candlestick Pattern and What Are Its Characteristics?
The Hanging Man pattern is a bearish candle with a small body at the top and a long lower wick (at least twice the length of the body). It forms when the closing price is at the upper end of the range. This pattern signals a potential downward trend reversal after a price advance.
What Does the Hanging Man Pattern Indicate After Appearing, and How Do You Determine Trade Direction?
The Hanging Man pattern usually suggests a possible reversal to the downside. It forms with a long lower wick and a small body at the top, indicating buyer rejection. This is a bearish signal for selling—especially if the next candle shows a price drop.
What Is the Difference Between the Hanging Man and Hammer Patterns, and How Can You Tell Them Apart?
Both patterns feature a long lower wick and a small body. The difference lies in trend context: the Hanging Man forms after an uptrend (indicating a downward reversal), while the Hammer forms after a downtrend (indicating an upward reversal). The body is positioned at the top in both, but the trend direction determines how each is interpreted.
How Do You Use the Hanging Man Pattern to Build a Trading Strategy?
The Hanging Man pattern signals a likely reversal to the downside. Consider selling when price moves below the candle’s lower shadow and confirmation is present. Wait for increased trading volume and a price decline. Set a stop-loss above the candle’s high. This pattern works best during strong uptrends.
How Reliable Is the Hanging Man Pattern, and What Risks Should You Watch For?
The Hanging Man pattern is about 60–65% reliable when confirmed by trading volume. Major risks include false signals without confirmation, market volatility, and the need for contextual analysis. Enhance accuracy by combining with other indicators.
Does the Hanging Man Pattern Vary Across Different Timeframes (Daily, Weekly, Monthly)?
Yes, the reliability of the pattern differs by timeframe. On daily charts, it appears more often but is less reliable. On weekly and monthly charts, it signals more significant reversals. Larger timeframes produce stronger and more accurate reversal signals.
* The information is not intended to be and does not constitute financial advice or any other recommendation of any sort offered or endorsed by Gate.