This comprehensive analysis examines XAVA versus ENJ as investment opportunities within the cryptocurrency gaming sector. XAVA, an investor-centric launchpad platform launched in May 2021, addresses token distribution inefficiencies, while ENJ, a blockchain gaming pioneer since November 2017, serves over 18.7 million registered players. The article compares historical price movements, tokenomics, and institutional adoption patterns, revealing distinct volatility trajectories and market positioning differences. Price projections through 2031 suggest differentiated growth potential based on sector-specific catalysts and ecosystem expansion. Investment recommendations vary by risk tolerance, with conservative portfolios favoring ENJ's established gaming infrastructure and aggressive strategies emphasizing XAVA's launchpad infrastructure potential. Current market conditions at Fear & Greed Index 29 present opportunities for strategic investors implementing diversified allocation and proper risk management protoco
Introduction: Investment Comparison Between XAVA and ENJ
In the cryptocurrency market, the comparison of XAVA vs ENJ remains a compelling topic for investors. The two assets exhibit significant differences in market cap rankings, application scenarios, and price performance, representing distinct positioning within the crypto asset landscape.
XAVA (Avalaunch): Launched in May 2021, this investor-centric platform has positioned itself as a launchpad addressing inefficiencies in token distribution while continuously refining its products and technology.
ENJ (Enjin Coin): Since its inception in November 2017, ENJ has established itself as a pioneering force in blockchain gaming infrastructure, serving over 18.7 million registered players through its gaming community platform.
This article provides a comprehensive analysis of XAVA vs ENJ investment value comparison, examining historical price movements, supply mechanisms, institutional adoption patterns, technological ecosystems, and future projections. We aim to address the question that concerns investors most:
"Which is the better buy right now?"
I. Historical Price Comparison and Current Market Status
XAVA (Avalaunch) and ENJ (Enjin Coin) Historical Price Trends
- 2021: XAVA reached a peak of $20.09 in December 2021, reflecting market enthusiasm during the broader crypto bull cycle.
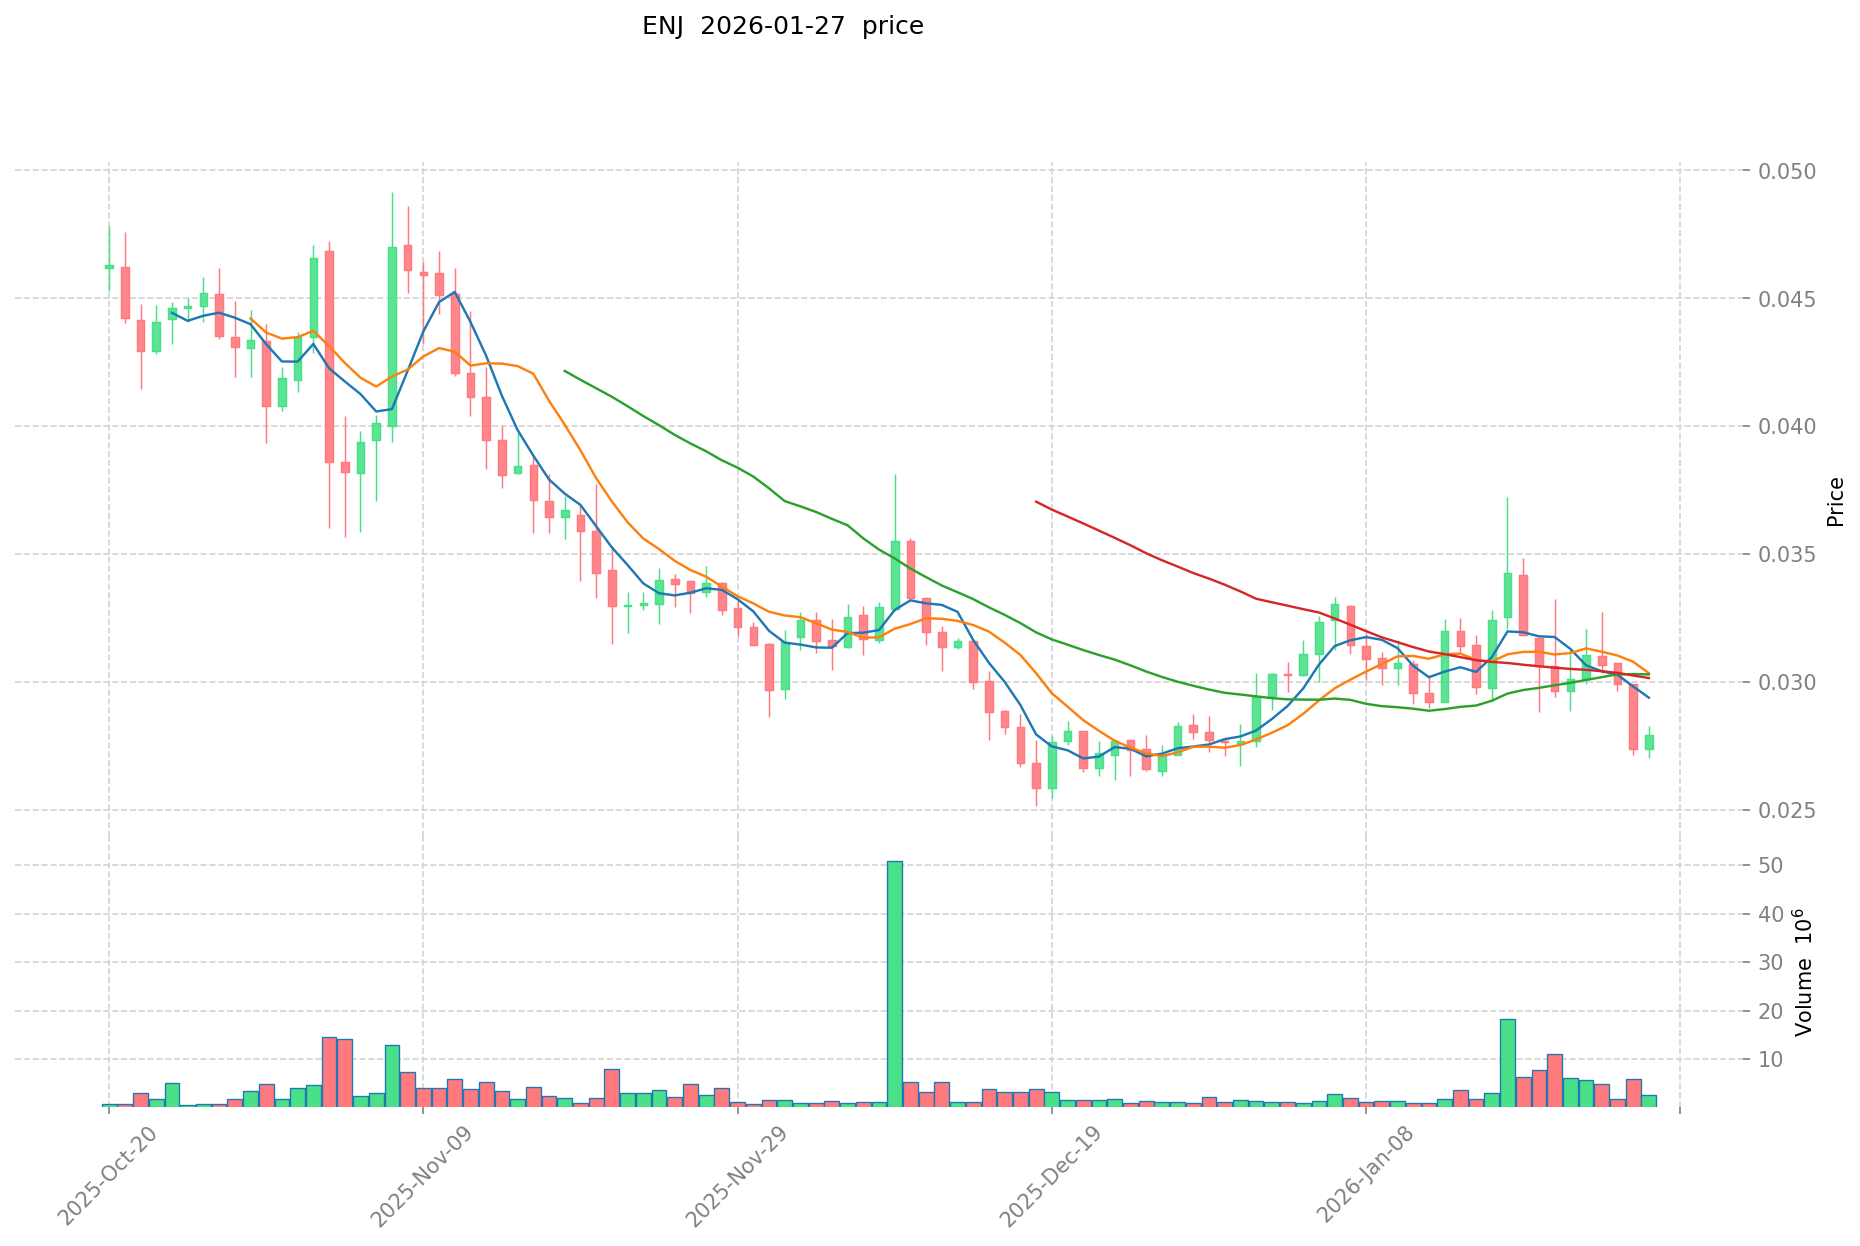
- 2021: ENJ recorded an all-time high of $4.82 in November 2021, driven by growing interest in gaming-related tokens and NFT infrastructure.
- Comparative Analysis: During recent market fluctuations, XAVA declined from its all-time high of $20.09 to a recorded low of $0.136585 in January 2026, while ENJ decreased from $4.82 to $0.01865964 in November 2017, showing different volatility patterns across market cycles.
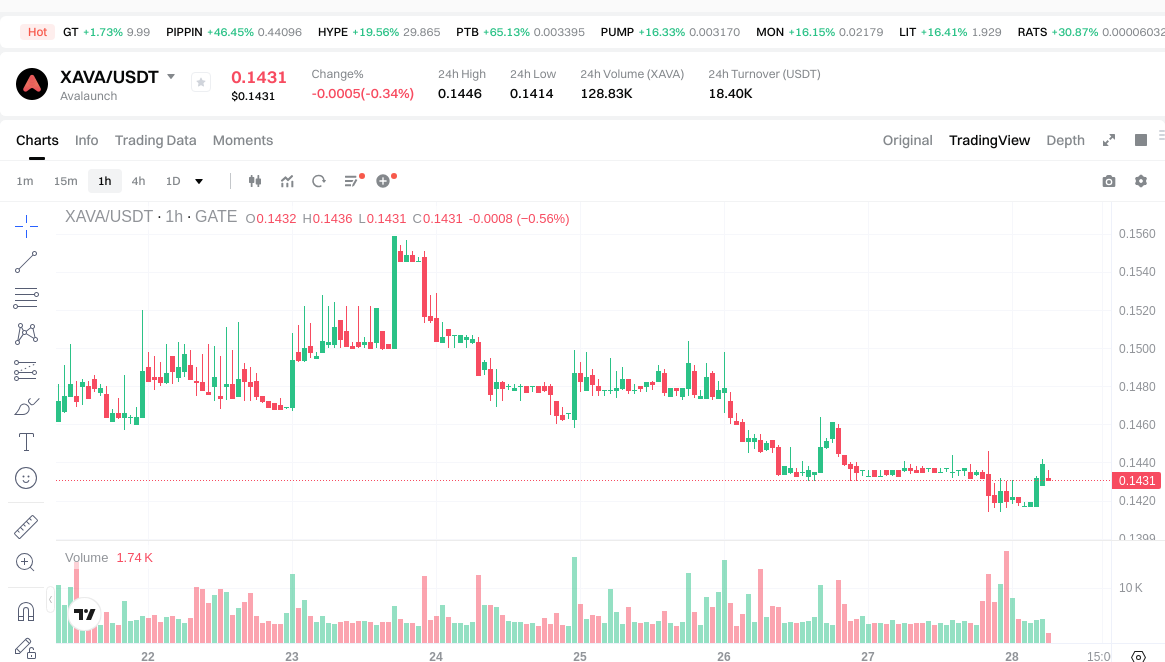
Current Market Status (January 28, 2026)
- XAVA Current Price: $0.1439
- ENJ Current Price: $0.02773
- 24-Hour Trading Volume: XAVA $18,159.24 vs ENJ $28,294.02
- Market Sentiment Index (Fear & Greed Index): 29 (Fear)
Check real-time prices:
II. Core Factors Influencing XAVA vs ENJ Investment Value
Tokenomics Comparison
- XAVA: Information regarding XAVA's supply mechanism is not available in the provided materials.
- ENJ: Information regarding ENJ's supply mechanism is not available in the provided materials.
- 📌 Historical Pattern: Supply mechanisms have historically played a role in shaping price cycles through factors such as scarcity dynamics and emission schedules.
Institutional Adoption and Market Application
- Institutional Holdings: Data comparing institutional preference between XAVA and ENJ is not available in the provided materials.
- Enterprise Adoption: Information regarding XAVA and ENJ applications in cross-border payments, settlements, or investment portfolios is not available in the provided materials.
- National Policy: Information regarding different countries' regulatory stances toward XAVA and ENJ is not available in the provided materials.
Technology Development and Ecosystem Building
- XAVA Technology Upgrades: Information regarding XAVA's technical developments and potential impacts is not available in the provided materials.
- ENJ Technology Development: Information regarding ENJ's technical developments and potential impacts is not available in the provided materials.
- Ecosystem Comparison: Data comparing DeFi, NFT, payment systems, and smart contract implementations between XAVA and ENJ is not available in the provided materials.
Macroeconomic Factors and Market Cycles
- Performance in Inflationary Environments: Information comparing anti-inflation properties between XAVA and ENJ is not available in the provided materials.
- Macroeconomic Monetary Policy: Information regarding how interest rates and dollar index movements affect XAVA and ENJ is not available in the provided materials.
- Geopolitical Factors: Information regarding cross-border transaction demand and international situations affecting XAVA and ENJ is not available in the provided materials.
III. 2026-2031 Price Prediction: XAVA vs ENJ
Short-term Prediction (2026)
- XAVA: Conservative 0.103104-0.1432 | Optimistic 0.1432-0.177568
- ENJ: Conservative 0.0171802-0.02771 | Optimistic 0.02771-0.0340833
Mid-term Prediction (2028-2029)
- XAVA may enter a growth phase, with projected prices ranging from 0.156093728 to 0.31503387104
- ENJ may enter a development phase, with projected prices ranging from 0.0220463046075 to 0.0501207928032
- Key drivers: institutional capital inflows, ETF developments, ecosystem expansion
Long-term Prediction (2030-2031)
- XAVA: Baseline scenario 0.2309025653424-0.26540524752 | Optimistic scenario 0.274176890950536-0.361800433419264
- ENJ: Baseline scenario 0.024892049503419-0.0434871584616 | Optimistic scenario 0.046096387969296-0.049784099006839
View detailed price predictions for XAVA and ENJ
Disclaimer
XAVA:
| Year |
Predicted High Price |
Predicted Average Price |
Predicted Low Price |
Price Change |
| 2026 |
0.177568 |
0.1432 |
0.103104 |
0 |
| 2027 |
0.20689536 |
0.160384 |
0.14113792 |
11 |
| 2028 |
0.247913568 |
0.18363968 |
0.156093728 |
28 |
| 2029 |
0.31503387104 |
0.215776624 |
0.14888587056 |
50 |
| 2030 |
0.2999079296976 |
0.26540524752 |
0.2309025653424 |
85 |
| 2031 |
0.361800433419264 |
0.2826565886088 |
0.274176890950536 |
97 |
ENJ:
| Year |
Predicted High Price |
Predicted Average Price |
Predicted Low Price |
Price Change |
| 2026 |
0.0340833 |
0.02771 |
0.0171802 |
0 |
| 2027 |
0.0349132145 |
0.03089665 |
0.028424918 |
11 |
| 2028 |
0.04080211599 |
0.03290493225 |
0.0220463046075 |
18 |
| 2029 |
0.0501207928032 |
0.03685352412 |
0.0195323677836 |
32 |
| 2030 |
0.048705617476992 |
0.0434871584616 |
0.036094341523128 |
56 |
| 2031 |
0.049784099006839 |
0.046096387969296 |
0.024892049503419 |
66 |
IV. Investment Strategy Comparison: XAVA vs ENJ
Long-term vs Short-term Investment Strategies
- XAVA: May appeal to investors focused on launchpad infrastructure and token distribution innovation within emerging blockchain ecosystems
- ENJ: May appeal to investors interested in blockchain gaming infrastructure and NFT-related utility tokens with established community presence
Risk Management and Asset Allocation
- Conservative Investors: XAVA 30-40% vs ENJ 60-70%
- Aggressive Investors: XAVA 60-70% vs ENJ 30-40%
- Hedging Instruments: Stablecoin allocation, options strategies, cross-asset portfolio diversification
V. Potential Risk Comparison
Market Risk
- XAVA: Price volatility patterns reflecting launchpad sector dynamics and token distribution market cycles
- ENJ: Price movements influenced by gaming industry adoption trends and NFT market sentiment shifts
Technology Risk
- XAVA: Platform scalability considerations and smart contract security maintenance
- ENJ: Gaming infrastructure evolution requirements and blockchain integration complexity
Regulatory Risk
- Global regulatory frameworks may impact launchpad mechanisms and gaming-related tokens differently across jurisdictions
VI. Conclusion: Which Is the Better Buy?
📌 Investment Value Summary:
- XAVA Advantages: Focused positioning in the token launch infrastructure sector with investor-centric platform approach
- ENJ Advantages: Established presence in blockchain gaming with considerable registered user base and pioneering status in gaming token infrastructure
✅ Investment Recommendations:
- Novice Investors: Consider diversified exposure with emphasis on understanding platform-specific use cases and market positioning differences
- Experienced Investors: Evaluate sector-specific catalysts, including launchpad demand trends for XAVA and gaming adoption metrics for ENJ
- Institutional Investors: Assess portfolio allocation based on sector exposure preferences and correlation with broader crypto market cycles
⚠️ Risk Disclaimer: Cryptocurrency markets exhibit substantial volatility. This article does not constitute investment advice.
VII. FAQ
Q1: What are the main differences between XAVA and ENJ in terms of their core use cases?
XAVA functions as an investor-centric token launchpad platform, while ENJ operates as blockchain gaming infrastructure. XAVA launched in May 2021 focuses on addressing inefficiencies in token distribution mechanisms, positioning itself within the DeFi launchpad sector. In contrast, ENJ, established in November 2017, serves as a pioneering force in blockchain gaming with over 18.7 million registered players through its gaming community platform. The fundamental difference lies in their market positioning: XAVA targets token launch and distribution infrastructure, whereas ENJ provides utility within gaming ecosystems and NFT-related applications.
Q2: How do the historical price performances of XAVA and ENJ compare during market cycles?
Both tokens experienced significant volatility with distinct peak-to-trough patterns. XAVA reached its all-time high of $20.09 in December 2021 before declining to $0.136585 in January 2026, representing a substantial correction. ENJ recorded its peak at $4.82 in November 2021 and experienced a decline to $0.01865964 in November 2017. As of January 28, 2026, XAVA trades at $0.1439 while ENJ is priced at $0.02773. The historical data suggests both assets exhibit high volatility characteristic of the cryptocurrency market, with price movements influenced by broader market cycles and sector-specific catalysts.
Q3: What are the projected price ranges for XAVA and ENJ through 2031?
Based on analytical projections, XAVA shows potential growth trajectories ranging from conservative estimates of $0.103104-$0.1432 in 2026 to optimistic long-term scenarios of $0.274176890950536-$0.361800433419264 by 2031. ENJ's projections range from $0.0171802-$0.02771 in 2026 to $0.024892049503419-$0.049784099006839 by 2031. Mid-term predictions for 2028-2029 suggest XAVA may reach $0.156093728-$0.31503387104, while ENJ could range between $0.0220463046075-$0.0501207928032. These projections incorporate factors such as institutional capital inflows, ecosystem expansion, and sector-specific developments, though cryptocurrency price predictions carry inherent uncertainty.
Q4: How should investors approach portfolio allocation between XAVA and ENJ based on risk tolerance?
Portfolio allocation strategies vary significantly based on investor risk profiles. Conservative investors may consider allocating 30-40% to XAVA and 60-70% to ENJ, prioritizing the more established gaming infrastructure token with its demonstrated community presence. Aggressive investors seeking higher risk-reward potential might reverse this allocation to 60-70% XAVA and 30-40% ENJ, emphasizing exposure to the launchpad infrastructure sector. Both strategies should incorporate hedging instruments such as stablecoin allocations, options strategies, and cross-asset portfolio diversification. The allocation approach should also consider individual investment timeframes, with long-term holders potentially favoring different weightings than short-term traders.
Q5: What are the primary risks associated with investing in XAVA versus ENJ?
XAVA faces risks related to launchpad sector dynamics, platform scalability considerations, and smart contract security maintenance within token distribution mechanisms. Market volatility in the launchpad sector can significantly impact price performance. ENJ encounters risks associated with gaming industry adoption trends, NFT market sentiment shifts, gaming infrastructure evolution requirements, and blockchain integration complexity. Both tokens face common cryptocurrency market risks including regulatory uncertainty across jurisdictions, macroeconomic factors affecting digital asset valuations, and technological vulnerabilities. The regulatory landscape may impact launchpad mechanisms and gaming-related tokens differently depending on jurisdictional interpretations of securities laws and gaming regulations.
Q6: Which token is more suitable for novice investors versus experienced traders?
Novice investors should consider diversified exposure between both tokens while prioritizing understanding of platform-specific use cases and market positioning differences. ENJ may offer more accessibility for beginners due to its established presence in blockchain gaming and clearer utility proposition within gaming ecosystems. Experienced investors can evaluate sector-specific catalysts, including launchpad demand trends for XAVA and gaming adoption metrics for ENJ, allowing for more nuanced tactical allocation decisions. Institutional investors should assess portfolio allocation based on sector exposure preferences and correlation analysis with broader crypto market cycles. Regardless of experience level, all investors should implement proper risk management protocols and avoid over-concentration in either asset.
Q7: How do current market conditions (Fear & Greed Index at 29) affect the investment outlook for XAVA and ENJ?
The current Fear & Greed Index reading of 29 indicates a "Fear" market sentiment as of January 28, 2026, suggesting potential opportunities for contrarian investors while signaling caution for momentum-based strategies. Under fearful market conditions, both XAVA (trading at $0.1439) and ENJ (trading at $0.02773) may present entry opportunities for long-term investors who believe in the fundamental value propositions of their respective sectors. However, fear-driven markets can persist and lead to further downside volatility. The 24-hour trading volumes of $18,159.24 for XAVA and $28,294.02 for ENJ reflect relatively modest liquidity conditions. Investors should consider dollar-cost averaging strategies during fearful market periods rather than attempting to time exact market bottoms, while maintaining appropriate position sizing relative to overall portfolio risk tolerance.
* The information is not intended to be and does not constitute financial advice or any other recommendation of any sort offered or endorsed by Gate.