This comprehensive analysis compares XDB Chain and Synthetix (SNX), two distinct blockchain tokens with different market positioning and investment characteristics. XDB, launched in 2019, focuses on consumer digital asset transfer through branded tokens and NFTs with deflationary buyback mechanisms, currently trading at $0.0001967. SNX, established in 2018, enables synthetic asset creation and trading across multiple asset classes, currently at $0.389 with significantly higher liquidity ($1.54M vs $13.9K daily volume). The article examines historical price trends—XDB's 99.98% decline from $0.850722 peak versus SNX's 98.64% decline from $28.53—alongside comparative analysis of market adoption, technical ecosystems, and regulatory frameworks. Long-term price forecasts through 2031 project SNX between $0.345-$0.990 and XDB between $0.000146-$0.000409, with investment allocation strategies tailored for conservative and aggressive investors. The guide addresses key risks including liquidity concerns, smart contrac
Introduction: Investment Comparison Between XDB and SNX
In the cryptocurrency market, the comparison between XDB vs SNX remains a topic of continuous interest among investors. These two assets exhibit notable differences in market capitalization ranking, application scenarios, and price performance, while representing distinct positioning within the crypto asset landscape.
XDB CHAIN (XDB): Launched in 2019, this protocol layer blockchain positions itself as a platform empowering brands and consumers through fast and affordable transfer of consumer digital assets including branded tokens (BCO), NFTs, and stablecoins. The project introduces a deflationary buyback and burn (BBB) mechanism supported by its branded token economics.
Synthetix (SNX): Introduced in 2018, this decentralized protocol enables the creation and trading of synthetic assets, supporting various asset classes including fiat currencies pegged to the US dollar, precious metals, indices, and other cryptocurrencies. The platform targets engineers building decentralized and trustless networks.
This article will provide a comprehensive analysis of XDB vs SNX investment value comparison, examining historical price movements, supply mechanisms, institutional adoption, technological ecosystems, and future outlook, while addressing the question investors frequently ask:
"Which is the better buy right now?"
I. Historical Price Comparison and Current Market Overview
Historical Price Trends of XDB (Coin A) and SNX (Coin B)
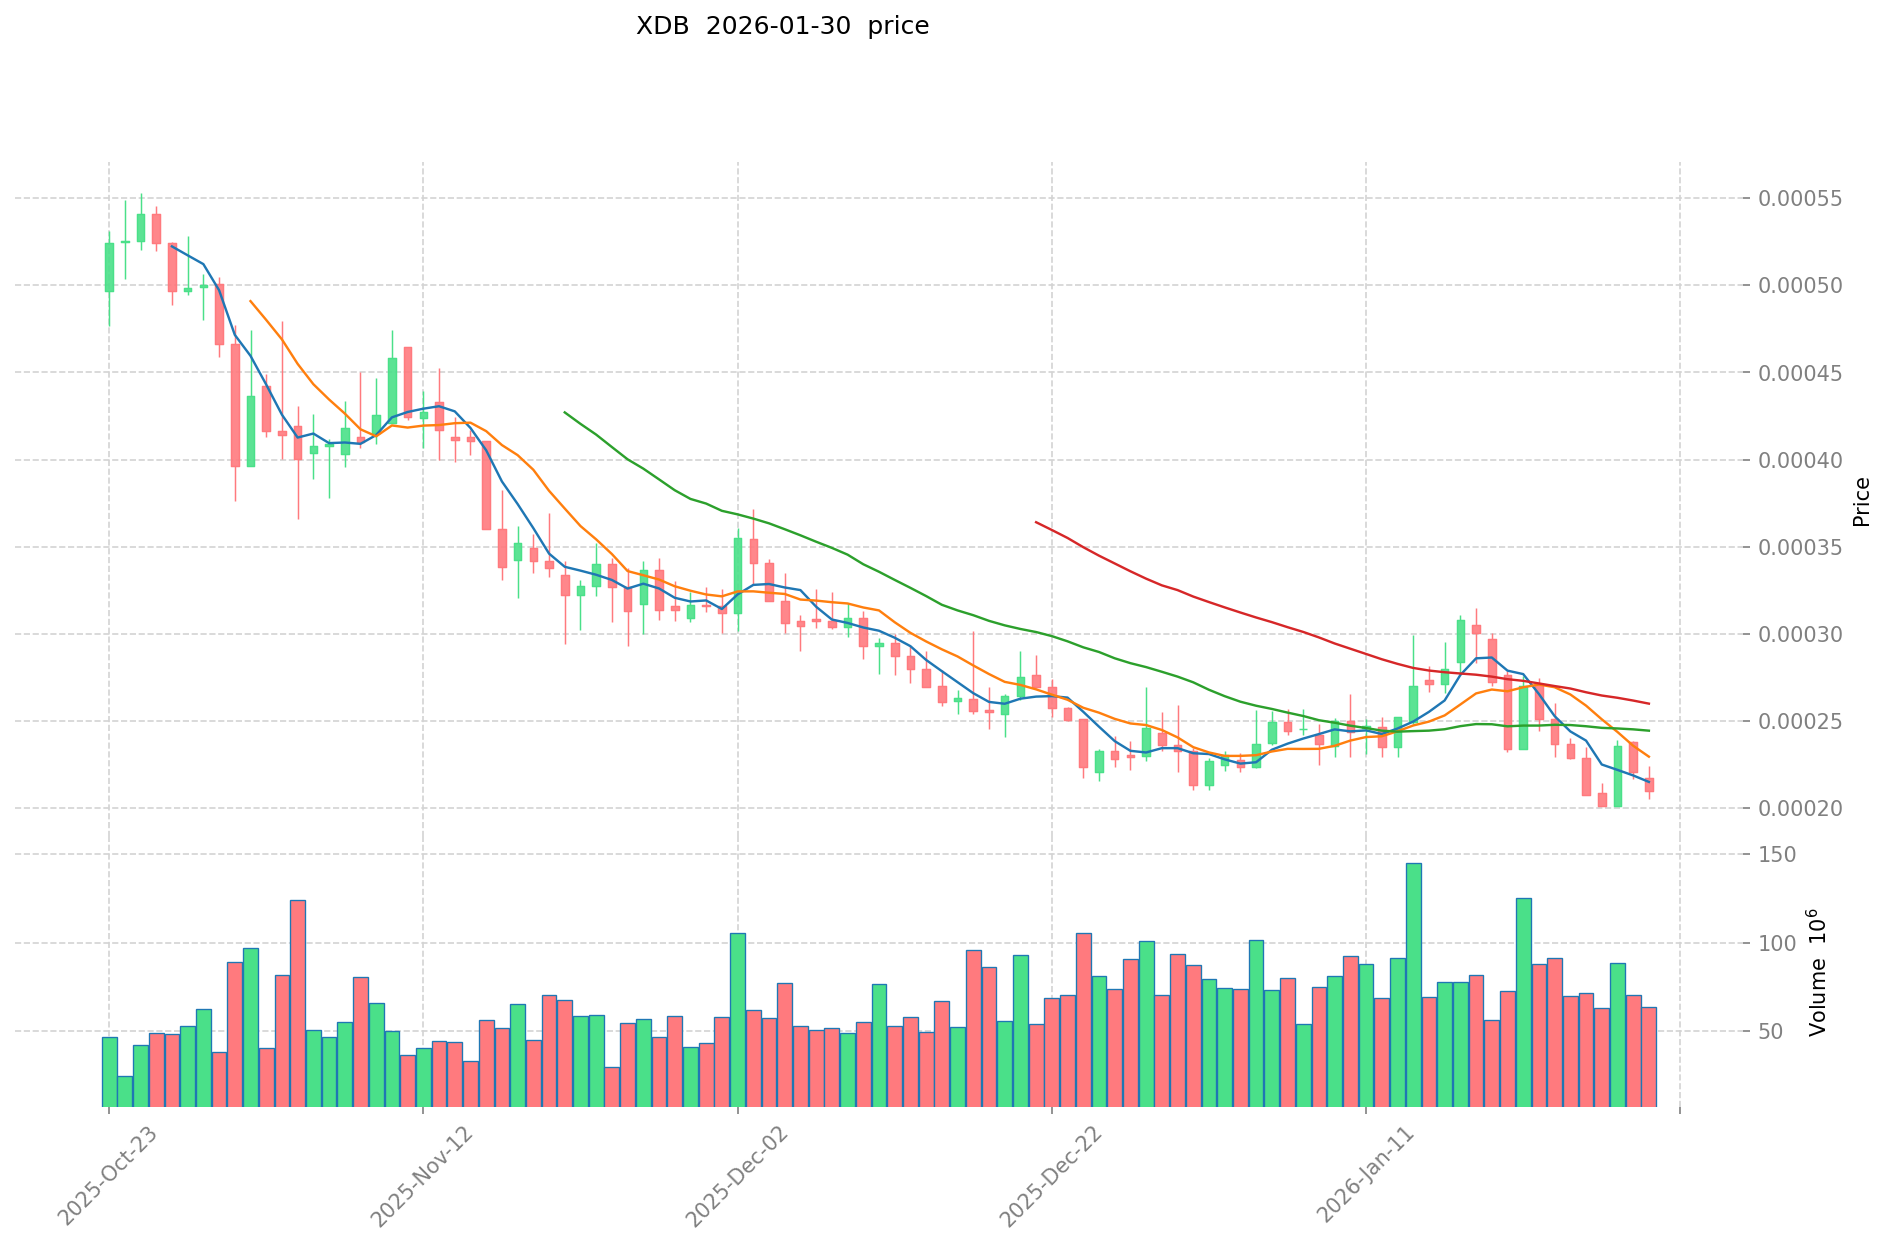
- 2021: XDB reached its all-time high of $0.850722 on November 22, 2021, during the broader cryptocurrency market rally.
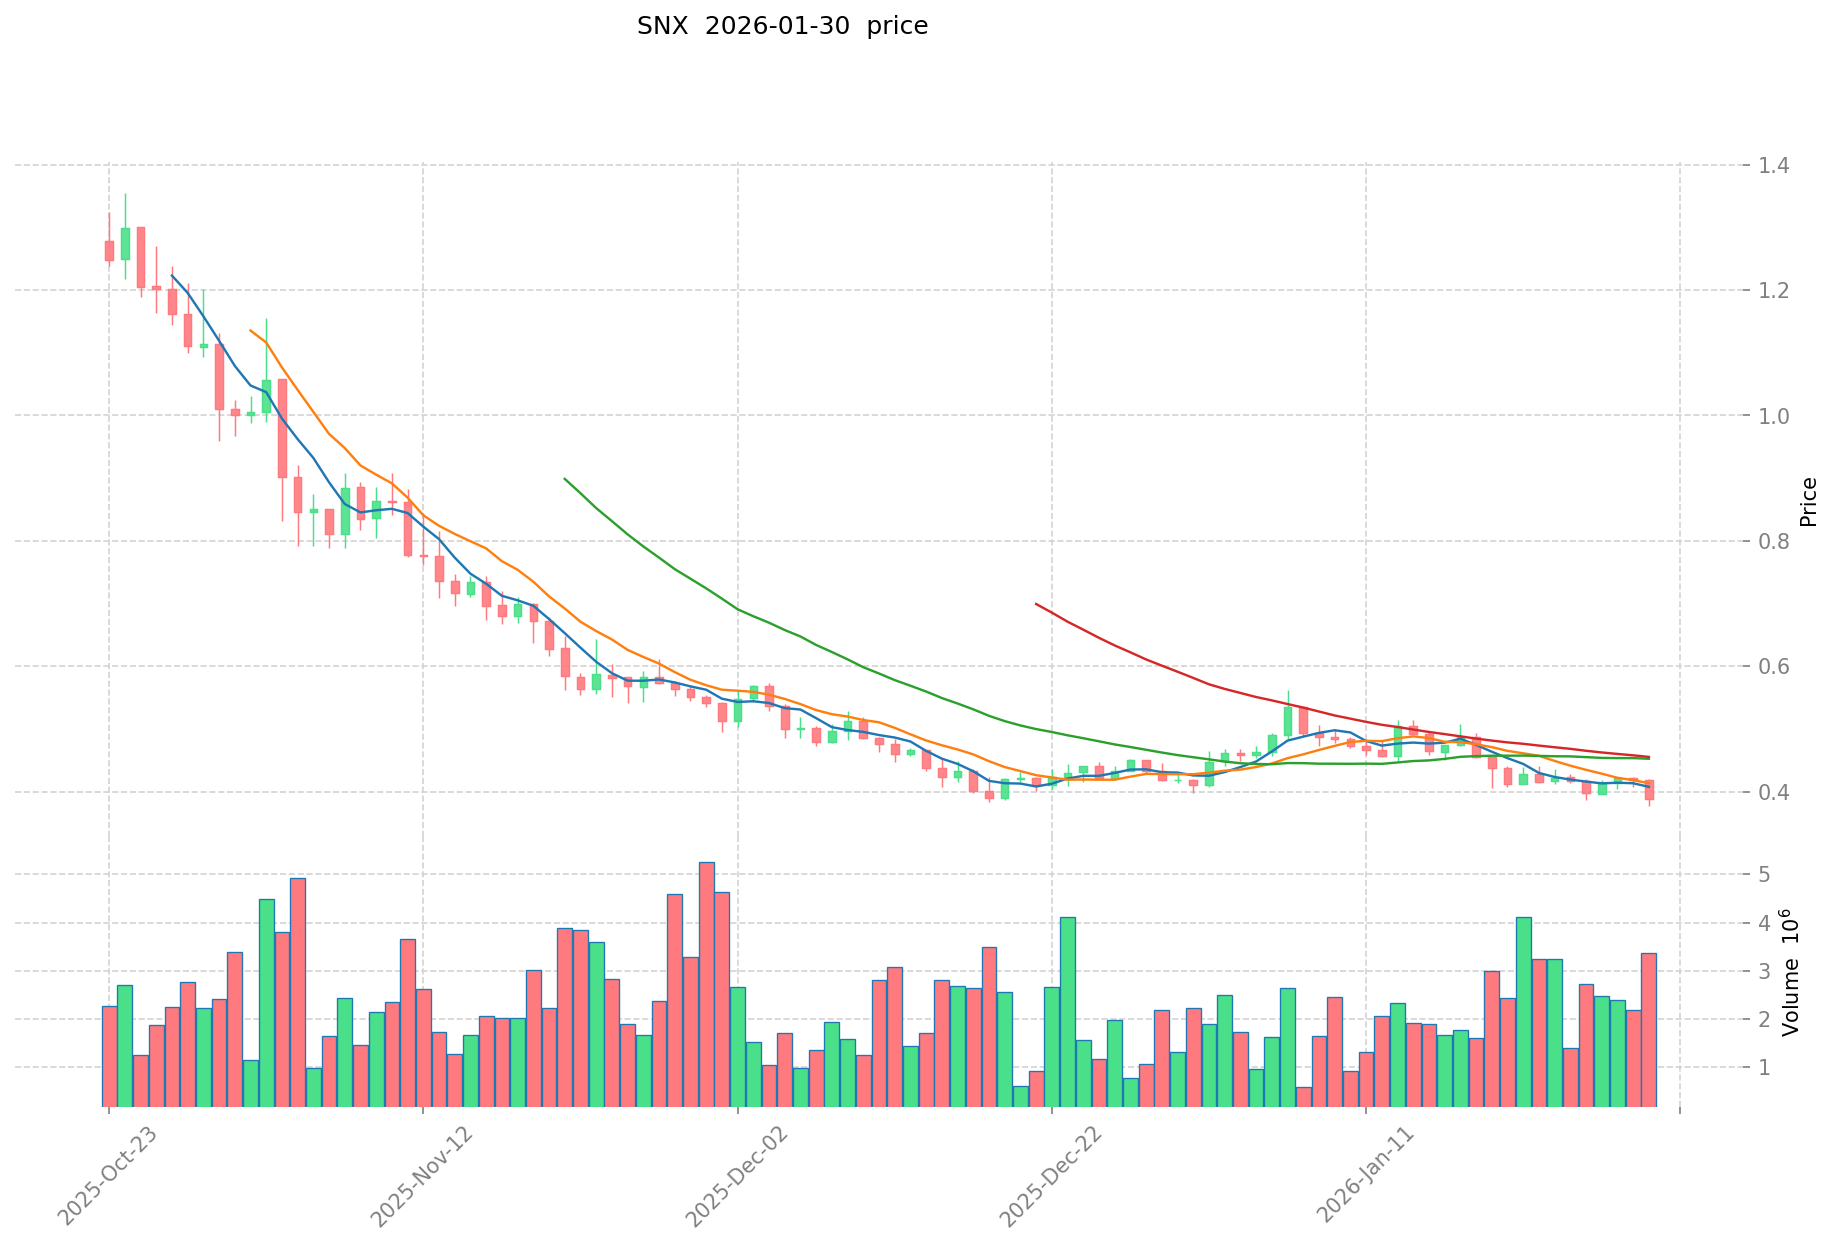
- 2021: SNX achieved its all-time high of $28.53 on February 14, 2021, driven by increased interest in decentralized finance (DeFi) protocols.
- Comparative Analysis: During the market correction period, XDB declined from its peak of $0.850722 to $0.00019499, while SNX experienced a decrease from $28.53 to $0.0347864.
Current Market Status (January 30, 2026)
- XDB Current Price: $0.0001967
- SNX Current Price: $0.389
- 24-Hour Trading Volume: XDB $13,910.06 vs SNX $1,539,910.85
- Market Sentiment Index (Fear & Greed Index): 16 (Extreme Fear)
View real-time prices:
II. Core Factors Affecting XDB vs SNX Investment Value
Supply Mechanism Comparison (Tokenomics)
Due to the absence of specific tokenomics data in the provided materials, a detailed comparative analysis of supply mechanisms between XDB and SNX cannot be conducted at this time.
Institutional Adoption and Market Application
Without concrete data regarding institutional holdings, enterprise adoption cases, or regulatory stances from different jurisdictions, a comprehensive assessment of institutional preference and practical applications for XDB versus SNX remains unavailable.
Technical Development and Ecosystem Building
The provided materials do not contain information about recent technical upgrades, development roadmaps, or ecosystem activities (such as DeFi integration, NFT support, payment solutions, or smart contract implementations) for either XDB or SNX.
Macroeconomic Environment and Market Cycles
In the absence of historical performance data under various macroeconomic conditions, comparative analysis regarding inflation resistance properties, sensitivity to monetary policy changes (interest rates, dollar index movements), or geopolitical factors affecting cross-border transaction demand cannot be meaningfully established for XDB and SNX.
III. 2026-2031 Price Forecast: XDB vs SNX
Short-term Forecast (2026)
- XDB: Conservative $0.000149 - $0.000199 | Optimistic $0.000199 - $0.000221
- SNX: Conservative $0.206 - $0.388 | Optimistic $0.388 - $0.442
Mid-term Forecast (2028-2029)
- XDB may enter a consolidation phase with projected price range of $0.000162 - $0.000318
- SNX may enter an expansion phase with projected price range of $0.314 - $0.714
- Key drivers: institutional capital inflows, ETF developments, ecosystem growth
Long-term Forecast (2030-2031)
- XDB: Base scenario $0.000146 - $0.000295 | Optimistic scenario $0.000295 - $0.000409
- SNX: Base scenario $0.345 - $0.739 | Optimistic scenario $0.739 - $0.990
View detailed price predictions for XDB and SNX
Disclaimer
XDB:
| Year |
Predicted High Price |
Predicted Average Price |
Predicted Low Price |
Price Change |
| 2026 |
0.000220779 |
0.0001989 |
0.000149175 |
1 |
| 2027 |
0.000287480115 |
0.0002098395 |
0.00017206839 |
6 |
| 2028 |
0.00026357939595 |
0.0002486598075 |
0.000161628874875 |
26 |
| 2029 |
0.000317588306139 |
0.000256119601725 |
0.000240752425621 |
30 |
| 2030 |
0.000301196651628 |
0.000286853953932 |
0.000146295516505 |
45 |
| 2031 |
0.000408695170864 |
0.00029402530278 |
0.000149952904417 |
49 |
SNX:
| Year |
Predicted High Price |
Predicted Average Price |
Predicted Low Price |
Price Change |
| 2026 |
0.442206 |
0.3879 |
0.205587 |
0 |
| 2027 |
0.55202049 |
0.415053 |
0.31544028 |
6 |
| 2028 |
0.5512318893 |
0.483536745 |
0.31429888425 |
24 |
| 2029 |
0.713990357667 |
0.51738431715 |
0.403559767377 |
33 |
| 2030 |
0.8619622723719 |
0.6156873374085 |
0.34478490894876 |
58 |
| 2031 |
0.990025238552868 |
0.7388248048902 |
0.598448091961062 |
89 |
IV. Investment Strategy Comparison: XDB vs SNX
Long-term vs Short-term Investment Strategies
- XDB: May suit investors interested in branded token economics and deflationary mechanisms through buyback and burn protocols, focusing on consumer digital asset transfer applications
- SNX: May suit investors seeking exposure to synthetic asset protocols and decentralized finance infrastructure development
Risk Management and Asset Allocation
- Conservative Investors: XDB 20-30% vs SNX 70-80%
- Aggressive Investors: XDB 40-50% vs SNX 50-60%
- Hedging Tools: stablecoin allocation, options strategies, cross-asset portfolio diversification
V. Potential Risk Comparison
Market Risk
- XDB: Lower trading volume ($13,910.06 as of January 30, 2026) may result in reduced liquidity and increased price volatility during market stress periods
- SNX: Despite higher trading volume ($1,539,910.85), synthetic asset protocols may face correlation risks with underlying asset performance and broader DeFi market sentiment
Technical Risk
- XDB: Scalability considerations for consumer digital asset transfer infrastructure, network stability under increased transaction loads
- SNX: Smart contract complexity in synthetic asset creation, potential security vulnerabilities in decentralized protocol architecture
Regulatory Risk
- Global regulatory approaches toward branded tokens and consumer digital assets may differ from synthetic asset protocols, potentially affecting operational compliance requirements and market access for both projects across different jurisdictions
VI. Conclusion: Which Is the Better Buy?
📌 Investment Value Summary:
- XDB Advantages: Deflationary buyback and burn mechanism, focus on consumer digital asset transfer with branded token economics
- SNX Advantages: Established presence in synthetic asset creation since 2018, broader DeFi protocol integration potential
✅ Investment Recommendations:
- Beginner Investors: Consider starting with smaller position sizes while studying the fundamental differences between branded token platforms and synthetic asset protocols
- Experienced Investors: Evaluate portfolio allocation based on risk tolerance, with potential emphasis on higher liquidity assets during current market conditions (Fear & Greed Index: 16 - Extreme Fear)
- Institutional Investors: Conduct comprehensive due diligence on protocol architecture, regulatory compliance frameworks, and ecosystem development trajectories
⚠️ Risk Warning: The cryptocurrency market exhibits significant volatility. This analysis does not constitute investment advice.
VII. FAQ
Q1: What are the main differences between XDB and SNX protocols?
XDB CHAIN focuses on consumer digital asset transfer through branded tokens (BCO), NFTs, and stablecoins with a deflationary buyback and burn mechanism, while SNX (Synthetix) enables creation and trading of synthetic assets representing various asset classes including fiat currencies, precious metals, and indices. XDB targets brand-consumer interactions launched in 2019, whereas SNX serves as a DeFi infrastructure protocol for synthetic assets established in 2018.
Q2: Which cryptocurrency has better liquidity between XDB and SNX?
SNX demonstrates significantly better liquidity with a 24-hour trading volume of $1,539,910.85 compared to XDB's $13,910.06 as of January 30, 2026. This substantial difference indicates that SNX offers approximately 110 times higher trading volume, making it easier to execute larger trades with minimal price impact and reduced slippage risk.
Q3: How do the historical price performances of XDB and SNX compare?
XDB reached its all-time high of $0.850722 on November 22, 2021, and has since declined to $0.0001967, representing a decrease of approximately 99.98%. SNX achieved its peak of $28.53 on February 14, 2021, and currently trades at $0.389, reflecting a decline of approximately 98.64%. Both assets experienced significant corrections during the broader cryptocurrency market downturn, though SNX demonstrated relatively higher price retention.
Q4: What is the projected price outlook for XDB and SNX through 2031?
According to conservative forecasts, XDB is projected to trade between $0.000146 - $0.000409 by 2031, with an average price around $0.000294. SNX is expected to reach $0.345 - $0.990 by 2031, with an average price near $0.739. The optimistic scenario suggests SNX could approach $0.990 while XDB may reach $0.000409, indicating SNX maintains a higher absolute price trajectory over the forecast period.
Q5: What allocation strategy should investors consider between XDB and SNX?
Conservative investors may consider a portfolio allocation of 20-30% XDB and 70-80% SNX to prioritize liquidity and established protocol infrastructure. Aggressive investors might allocate 40-50% to XDB and 50-60% to SNX for increased exposure to branded token economics potential. Both strategies should incorporate risk management tools including stablecoin reserves, options hedging, and cross-asset diversification based on individual risk tolerance and investment objectives.
Q6: What are the primary risks associated with investing in XDB versus SNX?
XDB faces liquidity risk due to lower trading volume, potentially resulting in higher price volatility and execution challenges during market stress periods. SNX carries smart contract complexity risks inherent to synthetic asset protocols and correlation risks with underlying asset performance. Both projects face regulatory uncertainty as global frameworks for branded tokens and synthetic assets continue to evolve across different jurisdictions.
Q7: How does the current market sentiment affect XDB and SNX investment decisions?
The current Fear & Greed Index stands at 16 (Extreme Fear) as of January 30, 2026, indicating heightened market pessimism. During such periods, higher liquidity assets like SNX may offer better risk-adjusted opportunities for portfolio entry or rebalancing, while lower liquidity assets like XDB may experience amplified volatility. Investors should consider dollar-cost averaging strategies and maintain adequate stablecoin reserves during extreme fear conditions to capitalize on potential market dislocations.
Q8: Which cryptocurrency better suits long-term versus short-term investment strategies?
SNX may be more suitable for both short-term and long-term strategies due to its higher liquidity, established DeFi protocol integration, and synthetic asset infrastructure supporting various trading strategies. XDB may appeal more to long-term investors interested in the emerging branded token economics sector and deflationary tokenomics through buyback and burn mechanisms. Short-term traders should prioritize SNX due to its substantially higher trading volume enabling more efficient entry and exit execution.
* The information is not intended to be and does not constitute financial advice or any other recommendation of any sort offered or endorsed by Gate.