This comprehensive investment comparison examines XEM versus BNB across multiple dimensions including historical price performance, market capitalization, institutional adoption, and ecosystem development. XEM, launched in 2015, positions itself as a blockchain infrastructure platform for digital asset management and decentralized authentication, while BNB, since 2017, serves as the native utility token of the Binance exchange ecosystem. The analysis evaluates tokenomics differences, supply mechanisms, technical infrastructure, and risk factors across market, technical, and regulatory dimensions. Current market data shows XEM trading at $0.0008998 with trading volume of $1,021,068.98, compared to BNB at $881 with $5,159,749.22 trading volume on Gate. The article provides detailed asset allocation strategies for conservative and aggressive investors, examines institutional adoption potential, and offers comparative risk assessment frameworks. Readers gain actionable insights into which cryptocurrency aligns be
Introduction: Investment Comparison Between XEM and BNB
In the cryptocurrency market, the comparison between XEM vs BNB has been a topic that investors cannot avoid. The two not only show significant differences in market cap ranking, application scenarios, and price performance, but also represent different crypto asset positioning.
XEM (XEM): Launched in 2015, it has gained market recognition through its positioning as a digital asset management platform capable of creating financial technology systems, logistics tracking systems, token issuance, notarization, and decentralized authentication.
BNB (BNB): Since its launch in 2017, it has been recognized as the fuel of the Binance ecosystem, ranking among the top cryptocurrencies globally by trading volume and market capitalization, supported by users in over 180 countries and regions.
This article will comprehensively analyze the investment value comparison of XEM vs BNB around historical price trends, supply mechanisms, institutional adoption, technical ecosystems, and future forecasts, attempting to answer investors' most concerned question:
"Which is the better buy right now?"
I. Historical Price Comparison and Current Market Status
XEM and BNB Historical Price Trends
-
2018: XEM reached a peak price of $1.87 in January 2018 during the broader cryptocurrency bull market, representing a period of heightened investor interest in the NEM blockchain platform.
-
2017: BNB launched through an Initial Coin Offering (ICO) in July 2017 at $0.15, establishing itself as a utility token within the Binance exchange ecosystem.
-
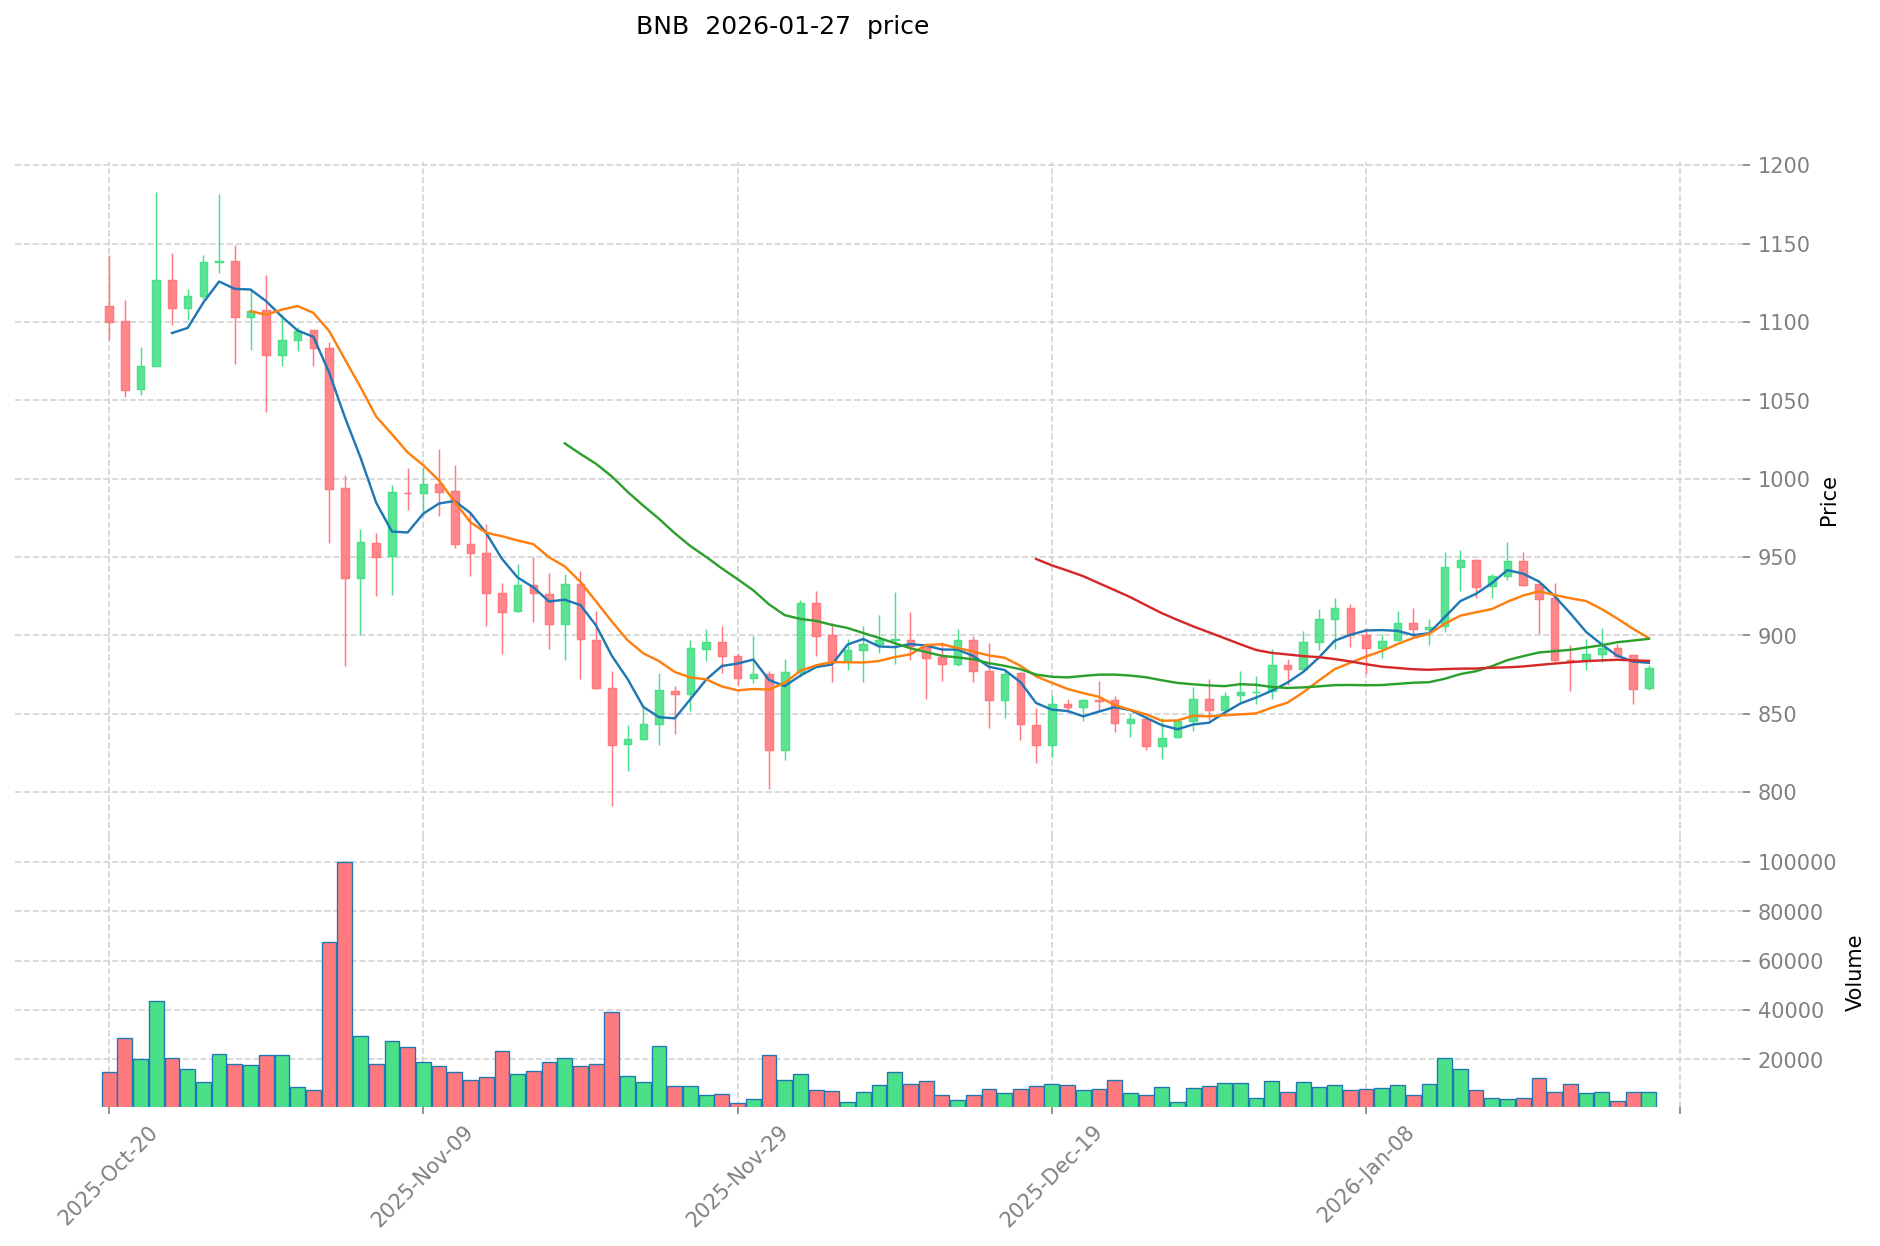
Comparative Analysis: During the 2018-2020 market correction cycle, XEM declined from its all-time high of $1.87 to a low of approximately $0.00008482, experiencing significant volatility. In contrast, BNB demonstrated relative resilience, maintaining its utility value within the expanding Binance ecosystem and reaching an all-time high of $1,369.99 in October 2025.
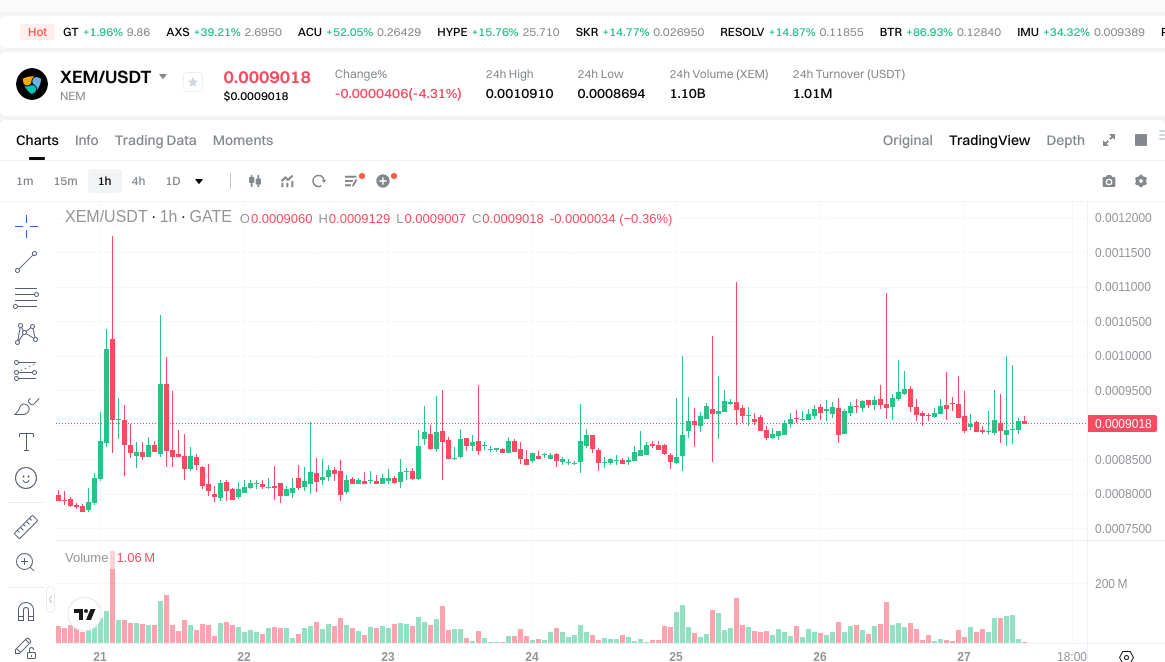
Current Market Status (January 27, 2026)
- XEM Current Price: $0.0008998
- BNB Current Price: $881
- 24-Hour Trading Volume: XEM $1,021,068.98 vs BNB $5,159,749.22
- Market Sentiment Index (Fear & Greed Index): 29 (Fear)
View real-time prices:
II. Core Factors Influencing XEM vs BNB Investment Value
Supply Mechanism Comparison (Tokenomics)
- BNB: The token operates within an ecosystem where its value correlation with the Binance exchange's success plays a significant role. BNB features use cases including reduced trading fees and broad utility applications across the Binance platform.
- XEM: The value proposition primarily stems from its underlying technology foundation and market acceptance levels within the NEM ecosystem.
- 📌 Historical Pattern: Supply mechanisms and platform utility models have shown influence on price cycles, with exchange-native tokens often reflecting trading platform performance metrics.
Institutional Adoption and Market Application
- Institutional Holdings: BNB demonstrates stronger ties to institutional trading activities through its direct connection to one of the major centralized exchanges, while XEM's institutional presence relates more to its technological infrastructure adoption.
- Enterprise Adoption: BNB serves multiple functions within the Binance ecosystem including fee reduction, token launches, and payment applications. XEM's enterprise use cases center around its blockchain technology capabilities.
- Regulatory Environment: Both assets face varying regulatory considerations across different jurisdictions, with exchange-based tokens and platform-specific cryptocurrencies subject to evolving policy frameworks.
Technology Development and Ecosystem Building
- BNB Technology: The token benefits from continuous platform development and expansion of use cases within the Binance ecosystem, including integration with various blockchain services.
- XEM Technology: Value derives from the NEM platform's technical features and its acceptance within specific market segments focused on blockchain infrastructure.
- Ecosystem Comparison: BNB maintains broader integration across DeFi protocols, NFT marketplaces, and payment systems through the Binance Smart Chain network. XEM's ecosystem development focuses on its core technological framework and specific application areas.
Macroeconomic Environment and Market Cycles
- Inflation Context: Digital assets generally respond to macroeconomic conditions differently based on their utility models and market positioning.
- Monetary Policy Impact: Interest rate adjustments and currency market dynamics affect cryptocurrency valuations through liquidity conditions and investor risk appetite shifts.
- Market Dynamics: Trading volumes and price movements reflect broader cryptocurrency market trends, with both assets showing sensitivity to overall market liquidity conditions and investor sentiment patterns.
III. 2026-2031 Price Forecast: XEM vs BNB
Short-term Forecast (2026)
- XEM: Conservative $0.000830 - $0.000902 | Optimistic $0.000902 - $0.000992
- BNB: Conservative $494 - $882 | Optimistic $882 - $1,244
Mid-term Forecast (2028-2029)
- XEM may enter a consolidation phase, with projected prices ranging from $0.000560 to $0.001361
- BNB may enter an expansion phase, with projected prices ranging from $995 to $1,682
- Key drivers: institutional capital inflows, ETF developments, ecosystem growth
Long-term Forecast (2030-2031)
- XEM: Baseline scenario $0.000718 - $0.001216 | Optimistic scenario $0.001206 - $0.002166
- BNB: Baseline scenario $1,437 - $1,596 | Optimistic scenario $1,597 - $2,267
View detailed price predictions for XEM and BNB
Disclaimer
XEM:
| Year |
Predicted High Price |
Predicted Average Price |
Predicted Low Price |
Price Change |
| 2026 |
0.00099198 |
0.0009018 |
0.000829656 |
0 |
| 2027 |
0.0011646747 |
0.00094689 |
0.0008143254 |
5 |
| 2028 |
0.0010874558205 |
0.00105578235 |
0.0005595646455 |
17 |
| 2029 |
0.001360956238267 |
0.00107161908525 |
0.001018038130987 |
19 |
| 2030 |
0.001690639849844 |
0.001216287661758 |
0.000717609720437 |
35 |
| 2031 |
0.002165660996144 |
0.001453463755801 |
0.001206374917315 |
61 |
BNB:
| Year |
Predicted High Price |
Predicted Average Price |
Predicted Low Price |
Price Change |
| 2026 |
1244.043 |
882.3 |
494.088 |
0 |
| 2027 |
1392.754665 |
1063.1715 |
733.588335 |
20 |
| 2028 |
1682.309423025 |
1227.9630825 |
994.650096825 |
39 |
| 2029 |
1644.303965621625 |
1455.1362527625 |
1004.044014406125 |
65 |
| 2030 |
1642.70331574358625 |
1549.7201091920625 |
1487.73130482438 |
75 |
| 2031 |
2266.620631704310612 |
1596.211712467824375 |
1436.590541221041937 |
81 |
IV. Investment Strategy Comparison: XEM vs BNB
Long-term vs Short-term Investment Strategies
- XEM: May appeal to investors interested in blockchain infrastructure technology and platform development opportunities, with focus on its technical foundation within specific market segments.
- BNB: May appeal to investors seeking exposure to exchange ecosystem growth and utility-driven value models, with correlation to trading platform performance metrics.
Risk Management and Asset Allocation
- Conservative Investors: XEM 20-30% vs BNB 70-80% allocation patterns reflect different risk-return profiles, with BNB showing stronger market liquidity characteristics.
- Aggressive Investors: XEM 40-50% vs BNB 50-60% allocation approaches balance higher volatility exposure with established platform utility.
- Hedging Tools: Stablecoin positions, options strategies, and cross-asset diversification methods help manage portfolio volatility across different market conditions.
V. Potential Risk Comparison
Market Risk
- XEM: Price movements show sensitivity to broader cryptocurrency market cycles and adoption trends within its specific technological niche, with trading volumes of $1,021,068.98 reflecting current market activity levels.
- BNB: Value correlation with exchange platform performance creates exposure to trading volume fluctuations and competitive dynamics within the centralized exchange sector, with 24-hour trading volumes of $5,159,749.22.
Technical Risk
- XEM: Considerations include platform scalability parameters and network stability factors related to its blockchain infrastructure implementation.
- BNB: Technical considerations relate to ecosystem integration complexity and platform dependency factors within the broader Binance network architecture.
Regulatory Risk
- Global regulatory frameworks continue evolving with different approaches toward exchange-based tokens and platform-specific cryptocurrencies, creating varying compliance considerations across jurisdictions for both assets.
VI. Conclusion: Which Is the Better Buy?
📌 Investment Value Summary:
- XEM Characteristics: Technology-focused positioning with blockchain infrastructure applications, current price point of $0.0008998, and projected price ranges from $0.000830 to $0.002166 across the 2026-2031 forecast period.
- BNB Characteristics: Exchange ecosystem integration with multiple utility functions, current price of $881, all-time high of $1,369.99 in October 2025, and projected price ranges from $494 to $2,267 across the 2026-2031 forecast period.
✅ Investment Considerations:
- Beginning Investors: Focus on understanding distinct value propositions and risk profiles, with consideration of market liquidity differences and ecosystem maturity levels between the two assets.
- Experienced Investors: Evaluate allocation strategies based on portfolio objectives, with attention to correlation patterns with broader market cycles and specific platform developments.
- Institutional Investors: Assess regulatory compliance frameworks, liquidity requirements, and ecosystem integration capabilities within existing investment mandates.
⚠️ Risk Disclosure: Cryptocurrency markets demonstrate substantial price volatility. This analysis does not constitute investment advice. Market conditions, regulatory developments, and technological factors may significantly impact asset valuations.
VII. FAQ
Q1: What are the main differences between XEM and BNB's market positioning?
XEM positions itself as a blockchain infrastructure platform focused on digital asset management, logistics tracking, and decentralized authentication systems, while BNB serves as the native utility token of the Binance ecosystem with applications in trading fee reduction, token launches, and payment systems. XEM's value derives from its technological foundation and adoption within specific blockchain infrastructure segments, whereas BNB's value correlates directly with Binance exchange performance and its broader ecosystem integration across DeFi protocols, NFT marketplaces, and payment networks.
Q2: How do the supply mechanisms of XEM and BNB differ?
BNB operates within a dynamic ecosystem where its value is closely tied to the Binance exchange's success, featuring use cases including reduced trading fees and broad utility applications across the platform. XEM's value proposition primarily stems from its underlying technology foundation and market acceptance levels within the NEM ecosystem. Historically, supply mechanisms and platform utility models have influenced price cycles, with exchange-native tokens like BNB often reflecting trading platform performance metrics more directly than technology-focused tokens like XEM.
Q3: What are the current price and trading volume differences between XEM and BNB?
As of January 27, 2026, XEM trades at $0.0008998 with a 24-hour trading volume of $1,021,068.98, while BNB trades at $881 with a 24-hour trading volume of $5,159,749.22. BNB demonstrates significantly higher trading volume, reflecting greater market liquidity and broader investor participation. BNB reached an all-time high of $1,369.99 in October 2025, while XEM peaked at $1.87 in January 2018, showing substantial differences in price performance trajectories and market capitalization levels.
Q4: What are the price forecasts for XEM and BNB through 2031?
For 2026, XEM forecasts range from $0.000830 to $0.000992 (conservative to optimistic scenarios), while BNB ranges from $494 to $1,244. By 2031, XEM projects prices between $0.001206 and $0.002166 under optimistic scenarios, representing potential increases from current levels. BNB's 2031 forecasts range from $1,437 to $2,267, with optimistic scenarios suggesting continued ecosystem expansion. Mid-term projections (2028-2029) indicate XEM may enter consolidation phases ($0.000560 to $0.001361) while BNB may experience expansion ($995 to $1,682), driven by institutional capital inflows and ecosystem growth.
Q5: What asset allocation strategies are recommended for different investor types?
Conservative investors may consider allocations of 20-30% XEM versus 70-80% BNB, reflecting BNB's stronger market liquidity characteristics and established platform utility. Aggressive investors might pursue 40-50% XEM versus 50-60% BNB allocations, balancing higher volatility exposure with utility-driven value models. These allocation patterns reflect different risk-return profiles, with BNB offering correlation to exchange platform performance and XEM providing exposure to blockchain infrastructure technology. Risk management approaches should incorporate stablecoin positions, options strategies, and cross-asset diversification across different market conditions.
Q6: What are the primary risks associated with investing in XEM versus BNB?
XEM faces market risks related to broader cryptocurrency cycles and adoption trends within its technological niche, with technical considerations including platform scalability and network stability factors. BNB's risks include value correlation with Binance exchange performance, exposure to trading volume fluctuations, and competitive dynamics within the centralized exchange sector. Both assets face evolving regulatory frameworks, with exchange-based tokens and platform-specific cryptocurrencies subject to varying compliance considerations across different jurisdictions. Technical risks for BNB relate to ecosystem integration complexity and platform dependency factors within the Binance network architecture.
Q7: Which cryptocurrency offers better institutional adoption potential?
BNB demonstrates stronger ties to institutional trading activities through its direct connection to one of the major centralized exchanges, with multiple utility functions including fee reduction, token launches, and payment applications across the Binance ecosystem. XEM's institutional presence relates more to technological infrastructure adoption, with enterprise use cases centered around blockchain technology capabilities such as financial technology systems, logistics tracking, and token issuance. The broader integration of BNB across DeFi protocols, NFT marketplaces, and payment systems through Binance Smart Chain provides more extensive institutional touchpoints compared to XEM's focus on core technological framework and specific application areas.
Q8: How do macroeconomic conditions affect XEM and BNB differently?
Both assets show sensitivity to overall market liquidity conditions and investor sentiment patterns, though through different mechanisms. BNB's value reflects trading platform performance metrics and is influenced by cryptocurrency market trading volumes, making it responsive to shifts in investor risk appetite and market liquidity. XEM's price movements correlate with adoption trends within blockchain infrastructure segments and broader cryptocurrency market cycles. Interest rate adjustments and monetary policy changes affect both assets through liquidity conditions, though BNB's direct connection to exchange trading activity may create more immediate responses to macroeconomic shifts affecting trading volumes and platform usage patterns.
* The information is not intended to be and does not constitute financial advice or any other recommendation of any sort offered or endorsed by Gate.