This comprehensive analysis compares XION and HBAR blockchain platforms, examining their scalability, adoption potential, and investment value for 2024 and beyond. XION, a walletless Layer 1 blockchain launched in 2023, focuses on chain abstraction for mainstream adoption, while HBAR, operational since 2020, utilizes hashgraph consensus for enterprise-grade distributed ledger performance. The article evaluates price history trends, current market conditions, tokenomics, technical ecosystems, and provides price forecasts through 2031. Investors gain insights into risk management strategies, comparing conservative to aggressive allocation approaches, understanding market risks, technical considerations, and regulatory factors. Whether you're a novice or experienced investor, this guide addresses which platform better suits your investment objectives through real-time pricing data available on Gate exchange and detailed comparative analysis.
Introduction: Investment Comparison Between XION and HBAR
In the cryptocurrency market, the comparison between XION vs HBAR continues to be a topic of interest for investors. The two projects differ significantly in terms of market cap ranking, application scenarios, and price performance, representing distinct positioning within the crypto asset landscape.
XION (XION): Launched in 2023, this project positions itself as the first walletless Layer 1 blockchain designed to enable mainstream adoption through chain abstraction.
Hedera (HBAR): Since its launch in 2020, Hedera has established itself as a fast, secure public ledger network utilizing hashgraph consensus, supporting decentralized applications and payment models.
This article will comprehensively analyze the investment value comparison between XION vs HBAR, covering historical price trends, supply mechanisms, institutional adoption, technical ecosystems, and future projections, attempting to address investors' most pressing question:
"Which is the better buy right now?"
I. Price History Comparison and Market Status
Price History Trends of XION (Coin A) and HBAR (Coin B)
- 2020: HBAR experienced significant volatility, reaching its historical low of $0.00986111 on January 3, 2020, reflecting early-stage market uncertainty.
- 2021: HBAR saw notable growth, achieving its all-time high of $0.569229 on September 15, 2021, driven by increased adoption and network development.
- 2024: XION reached its historical high of $11.9999 on November 14, 2024, following its mainnet launch and initial market enthusiasm.
- 2026: XION recorded its historical low of $0.1512 on January 21, 2026, indicating substantial price correction from its peak.
- Comparative Analysis: During the recent market cycle, XION declined from $11.9999 to $0.1512, representing significant downward movement, while HBAR experienced a decrease from $0.569229 to its current levels, showing relatively more stable price action over a longer timeframe.
Current Market Situation (2026-01-25)
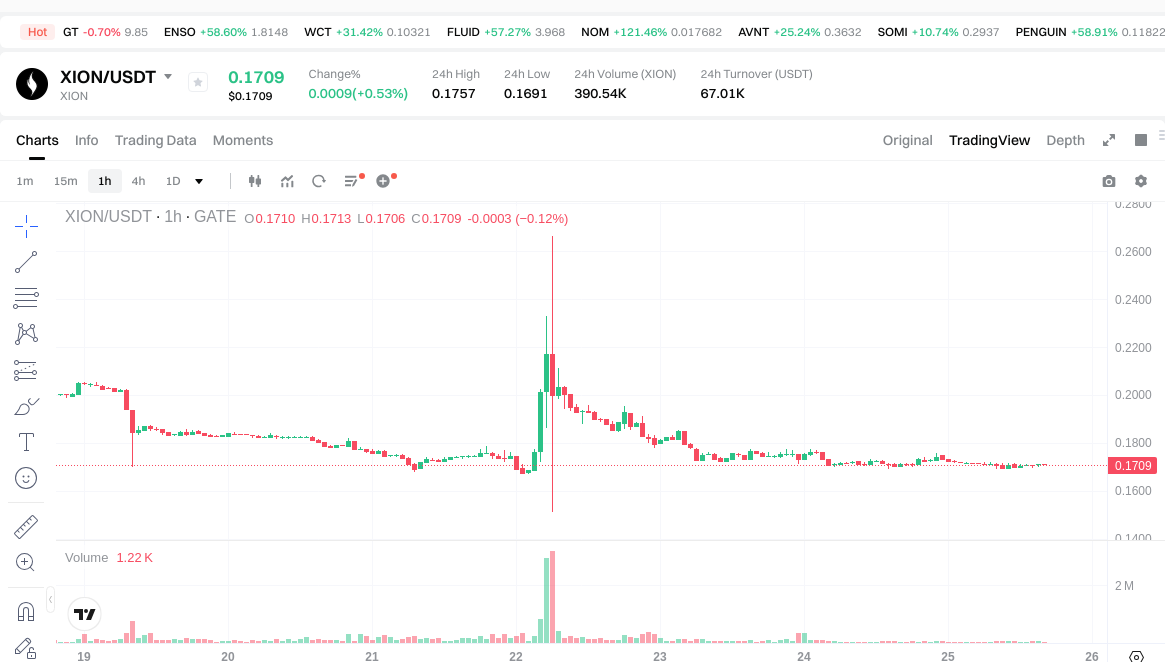
- XION Current Price: $0.1712
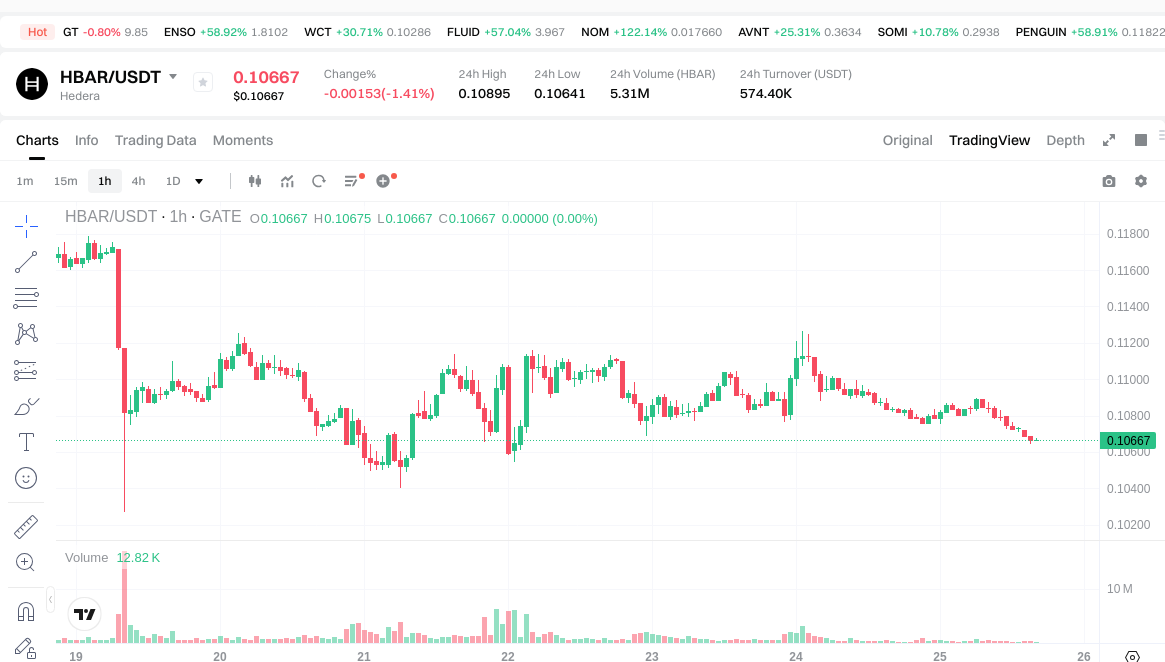
- HBAR Current Price: $0.10669
- 24-Hour Trading Volume: XION $67,029.96 vs HBAR $577,433.24
- Market Sentiment Index (Fear & Greed Index): 25 (Extreme Fear)
View real-time prices:
II. Core Factors Affecting XION vs HBAR Investment Value
Supply Mechanism Comparison (Tokenomics)
Due to insufficient reference materials, detailed supply mechanism information for XION and HBAR cannot be provided at this time. Supply mechanisms typically include factors such as total supply cap, inflation rate, token distribution schedule, and deflationary features, which may influence long-term price dynamics.
Institutional Adoption and Market Application
Institutional Holdings: Current reference materials do not provide sufficient data on institutional holdings for either XION or HBAR.
Enterprise Adoption: Information regarding enterprise-level adoption of XION and HBAR in cross-border payments, settlements, or institutional investment portfolios is not available in the provided materials.
National Policies: Regulatory attitudes toward XION and HBAR across different jurisdictions are not covered in the current reference materials.
Technology Development and Ecosystem Building
XION Technology Upgrades: Reference materials do not contain information about recent or planned technical upgrades for XION.
HBAR Technology Development: Information regarding HBAR's technical development roadmap is not available in the provided materials.
Ecosystem Comparison: Data comparing DeFi, NFT, payment solutions, and smart contract implementations between XION and HBAR ecosystems is not present in the reference materials.
Macroeconomic Environment and Market Cycles
Performance Under Inflation: Reference materials do not provide analysis on how XION or HBAR have performed during inflationary periods or their potential anti-inflation properties.
Macroeconomic Monetary Policy: The impact of interest rate changes, US Dollar Index movements, or other monetary policy factors on XION and HBAR is not discussed in the available materials.
Geopolitical Factors: Information regarding how cross-border transaction demand or international geopolitical situations affect XION and HBAR is not available in the current reference materials.
III. 2026-2031 Price Forecast: XION vs HBAR
Short-term Forecast (2026)
- XION: Conservative $0.087-$0.171 | Optimistic $0.171-$0.222
- HBAR: Conservative $0.093-$0.107 | Optimistic $0.107-$0.114
Mid-term Forecast (2028-2029)
- XION may enter a growth phase, with projected price range of $0.139-$0.381 by 2029
- HBAR may enter a consolidation phase, with projected price range of $0.102-$0.179 by 2029
- Key drivers: institutional capital flows, ETF developments, ecosystem expansion
Long-term Forecast (2030-2031)
- XION: Base scenario $0.231-$0.321 | Optimistic scenario $0.321-$0.484
- HBAR: Base scenario $0.130-$0.160 | Optimistic scenario $0.160-$0.255
View detailed price forecasts for XION and HBAR
Disclaimer
XION:
| Year |
Predicted High Price |
Predicted Average Price |
Predicted Low Price |
Price Change |
| 2026 |
0.22217 |
0.1709 |
0.087159 |
0 |
| 2027 |
0.27318365 |
0.196535 |
0.11988635 |
14 |
| 2028 |
0.2865283765 |
0.234859325 |
0.13856700175 |
37 |
| 2029 |
0.380613022095 |
0.26069385075 |
0.2163758961225 |
52 |
| 2030 |
0.4232625360777 |
0.3206534364225 |
0.2308704742242 |
87 |
| 2031 |
0.48354538212513 |
0.3719579862501 |
0.345920927212593 |
117 |
HBAR:
| Year |
Predicted High Price |
Predicted Average Price |
Predicted Low Price |
Price Change |
| 2026 |
0.1141797 |
0.10671 |
0.0928377 |
0 |
| 2027 |
0.1380560625 |
0.11044485 |
0.081729189 |
3 |
| 2028 |
0.178920657 |
0.12425045625 |
0.101885374125 |
16 |
| 2029 |
0.16825996785375 |
0.151585556625 |
0.13339528983 |
42 |
| 2030 |
0.201502680421612 |
0.159922762239375 |
0.129537437413893 |
49 |
| 2031 |
0.254804937075996 |
0.180712721330493 |
0.137341668211175 |
69 |
IV. Investment Strategy Comparison: XION vs HBAR
Long-term vs Short-term Investment Strategies
- XION: May appeal to investors focused on emerging Layer 1 blockchain infrastructure and chain abstraction technology, particularly those with higher risk tolerance for early-stage projects
- HBAR: May suit investors seeking exposure to established distributed ledger technology with a longer operational track record in enterprise-focused applications
Risk Management and Asset Allocation
- Conservative Investors: XION 20-30% vs HBAR 70-80%
- Aggressive Investors: XION 50-60% vs HBAR 40-50%
- Hedging Tools: Stablecoin allocation, options strategies, cross-asset portfolio diversification
V. Potential Risk Comparison
Market Risks
- XION: Recent price volatility from $11.9999 to $0.1512 indicates substantial downside exposure; limited historical data may increase uncertainty in price behavior assessment
- HBAR: Extended market presence since 2020 provides more historical reference points; experienced significant fluctuations between $0.00986111 and $0.569229
Technical Risks
- XION: Scalability challenges common to emerging Layer 1 solutions; network stability testing in early operational phases
- HBAR: Hashgraph consensus mechanism maturity considerations; network performance under varying transaction loads
Regulatory Risks
- Global regulatory frameworks continue to evolve for both enterprise-focused distributed ledgers and newer blockchain infrastructure projects, potentially affecting operational parameters and adoption trajectories differently
VI. Conclusion: Which Is the Better Buy?
📌 Investment Value Summary:
- XION Considerations: Represents exposure to newer chain abstraction technology and walletless blockchain architecture; higher volatility profile with potential for growth in emerging use cases
- HBAR Considerations: Offers participation in established hashgraph technology with longer operational history; relatively broader recognition in enterprise distributed ledger applications
✅ Investment Considerations:
- Novice Investors: Consider starting with smaller position sizes in either asset; prioritize understanding fundamental technology differences and risk profiles before allocation
- Experienced Investors: May evaluate portfolio diversification across both assets based on individual risk tolerance, technical assessment, and market cycle positioning
- Institutional Investors: Conduct comprehensive due diligence on technology maturity, regulatory compliance frameworks, and ecosystem development metrics for both projects
⚠️ Risk Disclosure: Cryptocurrency markets exhibit high volatility. This content does not constitute investment advice. Investors should conduct independent research and consult qualified financial advisors before making investment decisions.
VII. FAQ
Q1: What is the main difference between XION and HBAR's underlying technology?
XION is a walletless Layer 1 blockchain focused on chain abstraction for mainstream adoption, while HBAR utilizes hashgraph consensus technology as a distributed ledger platform. XION, launched in 2023, represents a newer approach to blockchain infrastructure by eliminating the traditional wallet requirement and abstracting blockchain complexity for end users. In contrast, HBAR (Hedera), operational since 2020, employs hashgraph consensus mechanism—a directed acyclic graph (DAG) structure—designed to provide fast, secure transaction processing for enterprise applications and decentralized systems. The fundamental architectural difference lies in XION's focus on user experience simplification versus HBAR's emphasis on enterprise-grade distributed ledger performance.
Q2: Which cryptocurrency has shown greater price stability historically?
HBAR has demonstrated relatively greater price stability over a longer operational timeframe compared to XION. HBAR's price fluctuations occurred between $0.00986111 (January 2020 low) and $0.569229 (September 2021 high) across multiple years, providing more historical reference points for price behavior analysis. Conversely, XION experienced extreme volatility within a shorter period, declining from its all-time high of $11.9999 (November 2024) to $0.1512 (January 2026)—representing a decline of approximately 98.7%. This substantial correction reflects XION's early-stage market dynamics and limited operational history, whereas HBAR's extended track record offers more data for assessing price patterns across different market cycles.
Q3: What is the current market sentiment for both cryptocurrencies?
As of January 25, 2026, the overall cryptocurrency market sentiment stands at 25 on the Fear & Greed Index, indicating "Extreme Fear." This macro-level sentiment affects both XION and HBAR, though their individual responses differ based on specific factors. XION currently trades at $0.1712 with 24-hour trading volume of $67,029.96, while HBAR trades at $0.10669 with significantly higher trading volume of $577,433.24. The substantially higher trading volume for HBAR suggests greater liquidity and market participation, which may provide more stability during periods of extreme market fear. Both assets are trading well below their historical peaks, reflecting the broader bearish sentiment affecting cryptocurrency markets during this period.
Q4: What are the projected price ranges for XION and HBAR by 2031?
Based on forecasting models, XION shows a wider projected range with base scenario estimates of $0.231-$0.321 and optimistic scenario of $0.321-$0.484 by 2031, representing potential growth of 117% from 2026 levels. HBAR's projections indicate base scenario of $0.130-$0.160 and optimistic scenario of $0.160-$0.255 by 2031, representing potential growth of 69% from 2026 levels. The forecasts suggest XION may experience higher percentage growth potential alongside commensurately higher volatility, while HBAR may follow a more gradual appreciation trajectory. These projections depend on numerous variables including ecosystem development, institutional adoption, technological upgrades, and macroeconomic conditions. Investors should note these are model-based estimates subject to substantial uncertainty and market dynamics.
Q5: How should different investor types approach XION vs HBAR allocation?
Investment allocation strategies vary significantly based on risk tolerance and investment objectives. Conservative investors might consider a portfolio weighting of 20-30% XION versus 70-80% HBAR, prioritizing the longer operational track record and established enterprise adoption of HBAR while maintaining limited exposure to XION's emerging technology. Aggressive investors may adopt a 50-60% XION versus 40-50% HBAR allocation, accepting higher volatility in exchange for potentially greater upside from XION's earlier development stage. Novice investors should begin with smaller position sizes in either asset, focusing first on understanding the fundamental technological differences, risk profiles, and market dynamics before committing significant capital. All investors should implement appropriate risk management including stablecoin allocation, portfolio diversification across asset classes, and potentially utilizing hedging instruments based on their sophistication level.
Q6: What are the primary risks associated with investing in XION versus HBAR?
XION's primary risks include extreme price volatility evidenced by its 98.7% decline from peak, limited operational history providing less data for risk assessment, potential scalability challenges common to emerging Layer 1 solutions, and network stability uncertainties during early operational phases. HBAR's main risks involve hashgraph consensus mechanism maturity considerations, network performance variability under different transaction loads, and potential competitive pressures from other enterprise-focused distributed ledger technologies. Both assets face evolving regulatory frameworks that may impact operational parameters differently—XION as a newer blockchain infrastructure project and HBAR as an enterprise-focused distributed ledger. Market risk affects both assets, though HBAR's longer operational history provides more reference points for understanding behavior during various market cycles, while XION's recent launch offers limited historical context for stress-testing price action.
Q7: What information is currently unavailable for comprehensive XION vs HBAR comparison?
Several critical data points remain unavailable in current reference materials, limiting comprehensive investment analysis. These include detailed tokenomics information such as total supply caps, inflation rates, token distribution schedules, and deflationary mechanisms for both assets. Institutional holdings data, enterprise adoption metrics in cross-border payments or settlements, and specific regulatory attitudes across different jurisdictions are not documented. Technical development roadmaps, recent or planned upgrades, and ecosystem comparisons covering DeFi, NFT, payment solutions, and smart contract implementations lack sufficient detail. Additionally, performance analysis during inflationary periods, responses to macroeconomic monetary policy changes, and impacts of geopolitical factors on adoption are not covered in available materials. Investors should conduct additional independent research to obtain this information before making investment decisions.
Q8: What drives the current trading volume difference between XION and HBAR?
As of January 25, 2026, HBAR's 24-hour trading volume of $577,433.24 significantly exceeds XION's $67,029.96—approximately 8.6 times higher. This substantial difference reflects several factors: HBAR's longer market presence since 2020 has enabled broader exchange listings, larger holder base, and established trading patterns among market participants. HBAR's focus on enterprise applications may attract institutional trading activity requiring higher liquidity. Conversely, XION's recent launch in 2023 and subsequent price correction may have reduced trader interest and market-making activity. Higher trading volume generally indicates better liquidity, tighter bid-ask spreads, and reduced slippage for larger transactions, which may favor HBAR for investors prioritizing ease of entry and exit. However, lower trading volume in XION may present both risks (liquidity constraints) and opportunities (potential for price discovery as adoption develops) depending on investment timeframe and strategy.
* The information is not intended to be and does not constitute financial advice or any other recommendation of any sort offered or endorsed by Gate.


