This comprehensive comparison analyzes Tezos (XTZ) and Basic Attention Token (BAT) as investment opportunities in 2024-2026, examining their distinct blockchain architectures, tokenomics, and market positioning. XTZ operates as a self-amending Layer 1 platform with Proof-of-Stake consensus and on-chain governance, while BAT functions as an ERC-20 token focused on browser-based advertising within the Brave ecosystem. The article evaluates historical price trends, supply mechanisms, institutional adoption patterns, and technical development trajectories, presenting forecasts indicating XTZ potential growth to $0.75-$1.28 by 2031 versus BAT's $0.24-$0.44 range. Investment recommendations differentiate between conservative allocations favoring BAT's fixed supply model and aggressive strategies emphasizing XTZ's DeFi and NFT ecosystem exposure. Risk analysis addresses market volatility, technical scalability, and regulatory considerations specific to each platform's use case and competitive landscape.
Introduction: XTZ Investment Value, Price Prediction, and Risk Analysis
In the cryptocurrency market, Tezos (XTZ) has emerged as a distinctive blockchain platform since its launch in 2017. Unlike traditional blockchain networks, XTZ positions itself as a self-amending decentralized blockchain that simplifies formal verification through a digital commonwealth governance model. This mathematical approach to transaction code accuracy enhances smart contract security and represents a unique value proposition in the crypto ecosystem.
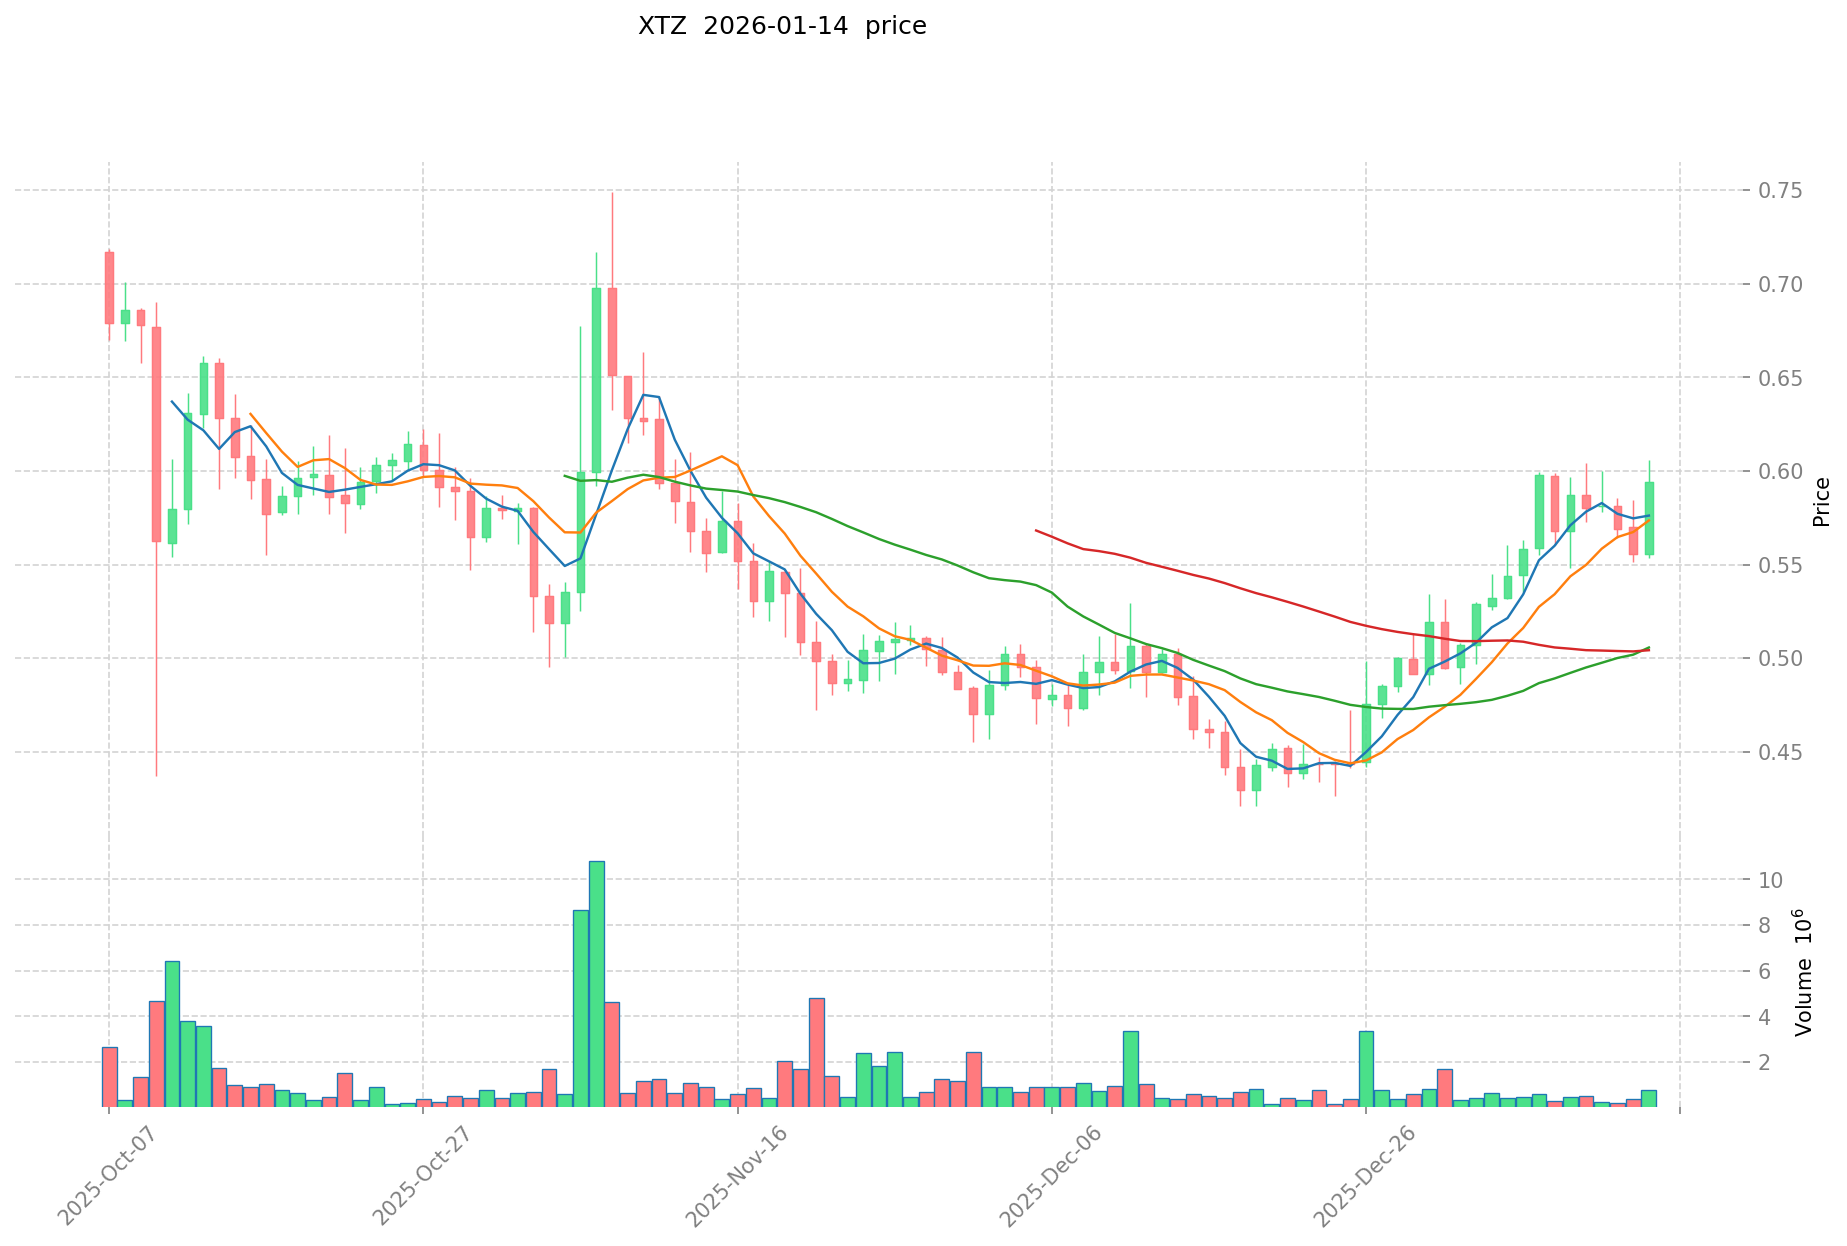
As of January 14, 2026, XTZ is ranked 117th by market capitalization with a circulating supply of approximately 1.07 billion tokens out of a total supply of 1.09 billion tokens. The current price stands at $0.5813, showing a 20.75% increase over the past 30 days. However, the token has experienced significant volatility over its lifetime, with historical data showing fluctuations between $0.350476 and $9.12.
XTZ distinguishes itself through its modular architecture, which allows it to absorb advantageous features from various blockchain-based ledgers. The platform implements conventional blockchain operations as functional modules, processing network layer tasks through its network shell. This design enables representation of other blockchain protocols including Bitcoin, Ethereum, and Cryptonote within the Tezos ecosystem.
This article will examine multiple dimensions of XTZ investment considerations, including historical price trends, supply mechanisms, technical ecosystem development, and market positioning. We will analyze the factors that may influence XTZ's future performance and explore the risks and opportunities associated with this asset.
"What factors should investors consider when evaluating XTZ's investment potential in the current market environment?"
I. Historical Price Comparison and Current Market Status
XTZ and BAT Historical Price Trends
- 2021: XTZ experienced notable price activity, with its price influenced by various market developments throughout the year.
- 2021: BAT saw price movements related to ecosystem developments, with its value fluctuating during the same period.
- Comparative analysis: During the 2021-2022 market cycle, XTZ moved from a higher valuation level to lower price points, while BAT exhibited similar downward trending patterns during comparable timeframes.
Current Market Status (2026-01-14)
- XTZ current price: $0.5813
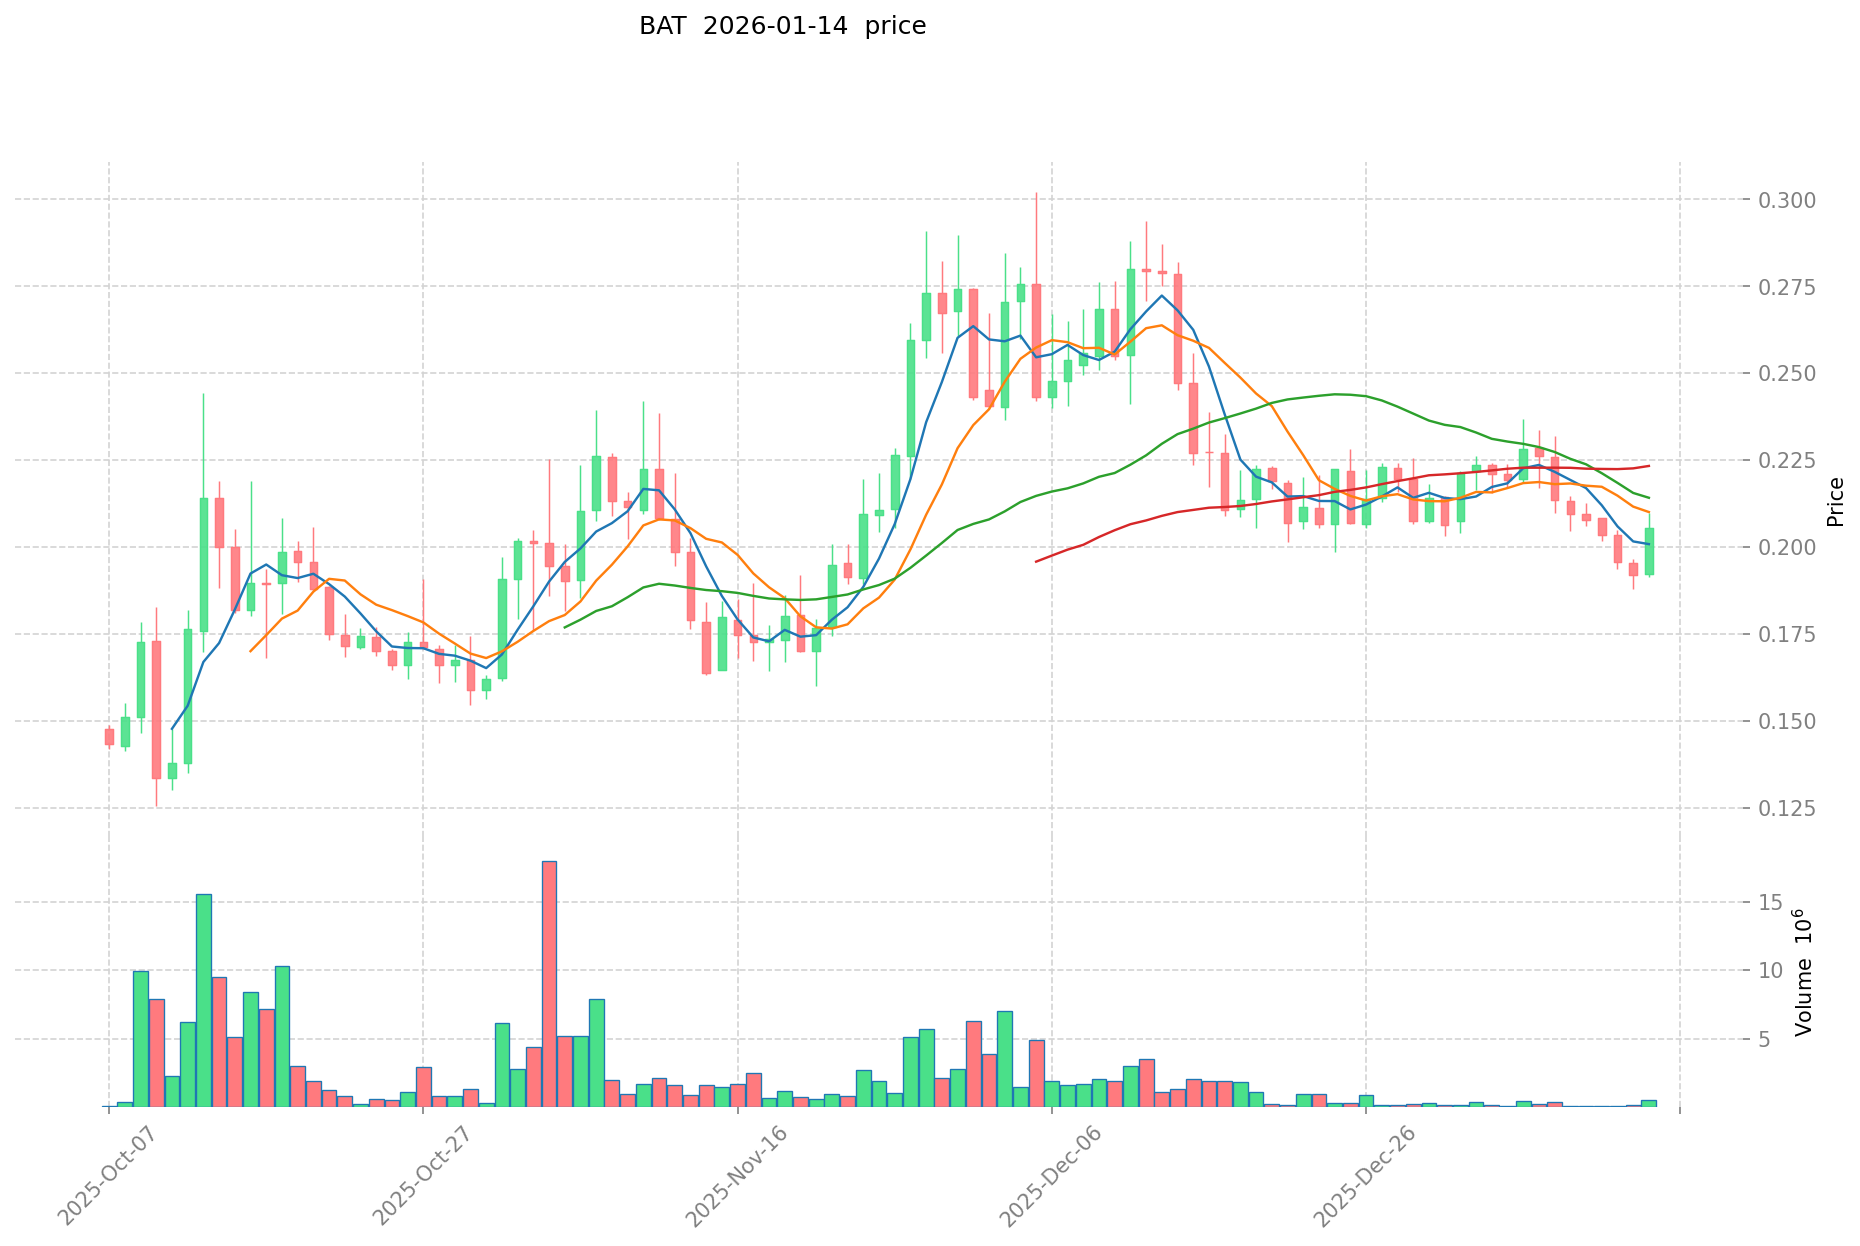
- BAT current price: $0.2039
- 24-hour trading volume: XTZ $490,198.06 vs BAT $256,763.94
- Market Sentiment Index (Fear & Greed Index): 48 (Neutral)
Click to view real-time prices:
II. Core Factors Influencing XTZ vs BAT Investment Value
Supply Mechanism Comparison (Tokenomics)
- XTZ: Operates under a Proof-of-Stake consensus mechanism with ongoing token issuance through staking rewards, creating an inflationary supply model that incentivizes network participation.
- BAT: Features a fixed supply model with tokens distributed through the Brave browser ecosystem, designed to facilitate advertising transactions between users, advertisers, and publishers.
- 📌 Historical Pattern: Supply mechanisms influence price cycles through different incentive structures, with inflationary models potentially diluting value over time while fixed supply models may experience scarcity-driven price dynamics.
Institutional Adoption and Market Applications
- Institutional Holdings: XTZ has gained attention through partnerships with enterprises, while BAT's adoption remains primarily focused on browser-based advertising applications.
- Enterprise Adoption: XTZ partnerships include collaborations with Ubisoft and Red Bull Racing Honda, expanding its presence in gaming and sports sectors. BAT's enterprise adoption centers on integration with mainstream media and digital advertising platforms.
- Regulatory Environment: Both assets operate within evolving regulatory frameworks that vary across jurisdictions, with institutional adoption influenced by compliance requirements and legal clarity.
Technical Development and Ecosystem Building
- XTZ Technical Development: Built on the Tezos blockchain with Proof-of-Stake consensus mechanism, supporting smart contract functionality and emphasizing on-chain governance efficiency.
- BAT Technical Development: Functions as an ERC-20 token within the Ethereum ecosystem, integrated into the Brave browser for decentralized advertising transactions.
- Ecosystem Comparison: XTZ positions itself as a Layer 1 smart contract platform with applications in DeFi and NFT sectors. BAT maintains a focused ecosystem centered on browser-based advertising and content monetization, with limited expansion into broader DeFi applications.
Macroeconomic Environment and Market Cycles
- Performance in Inflationary Environments: The relationship between these assets and inflation protection characteristics depends on multiple market factors and adoption patterns.
- Macroeconomic Monetary Policy: Interest rate changes and US dollar index movements affect crypto asset valuations through risk appetite shifts and capital flow dynamics.
- Geopolitical Factors: Cross-border transaction demand and international developments influence broader crypto market sentiment, with impact varying based on specific use cases and regional adoption patterns.
III. 2026-2031 Price Forecast: XTZ vs BAT
Short-term Forecast (2026)
- XTZ: Conservative $0.47-$0.58 | Optimistic $0.58-$0.62
- BAT: Conservative $0.14-$0.21 | Optimistic $0.21-$0.26
Mid-term Forecast (2028-2029)
- XTZ may enter a growth phase, with projected price range of $0.60-$0.99
- BAT may enter a consolidation phase, with projected price range of $0.16-$0.38
- Key drivers: institutional capital flows, ETF developments, ecosystem expansion
Long-term Forecast (2030-2031)
- XTZ: Baseline scenario $0.75-$1.07 | Optimistic scenario $1.07-$1.28
- BAT: Baseline scenario $0.24-$0.39 | Optimistic scenario $0.39-$0.44
View detailed price predictions for XTZ and BAT
Disclaimer: Price predictions are based on historical data analysis and market trends. Cryptocurrency markets are highly volatile and subject to various risk factors. These forecasts do not constitute investment advice, and actual prices may differ significantly from projections.
XTZ:
| Year |
Predicted High Price |
Predicted Average Price |
Predicted Low Price |
Price Change |
| 2026 |
0.619676 |
0.5846 |
0.46768 |
0 |
| 2027 |
0.87912148 |
0.602138 |
0.38536832 |
3 |
| 2028 |
0.8369116062 |
0.74062974 |
0.5999100894 |
27 |
| 2029 |
0.985963341375 |
0.7887706731 |
0.646791951942 |
35 |
| 2030 |
1.251187480204875 |
0.8873670072375 |
0.7453882860795 |
52 |
| 2031 |
1.283132692465425 |
1.069277243721187 |
0.983735064223492 |
83 |
BAT:
| Year |
Predicted High Price |
Predicted Average Price |
Predicted Low Price |
Price Change |
| 2026 |
0.256875 |
0.2055 |
0.13974 |
0 |
| 2027 |
0.261241875 |
0.2311875 |
0.21731625 |
13 |
| 2028 |
0.3447005625 |
0.2462146875 |
0.1575774 |
20 |
| 2029 |
0.38114033625 |
0.295457625 |
0.16841084625 |
44 |
| 2030 |
0.43640568500625 |
0.338298980625 |
0.26049021508125 |
65 |
| 2031 |
0.398972902800093 |
0.387352332815625 |
0.240158446345687 |
89 |
IV. Investment Strategy Comparison: XTZ vs BAT
Long-term vs Short-term Investment Strategies
- XTZ: Suitable for investors focused on smart contract platform potential and on-chain governance mechanisms, with positioning in DeFi and NFT ecosystem expansion.
- BAT: Suitable for investors seeking exposure to browser-based advertising models and content monetization use cases within a focused application scope.
Risk Management and Asset Allocation
- Conservative investors: XTZ 30-40% vs BAT 60-70%
- Aggressive investors: XTZ 60-70% vs BAT 30-40%
- Hedging tools: stablecoin allocation, options strategies, cross-asset portfolio diversification
V. Potential Risk Comparison
Market Risks
- XTZ: Exposure to smart contract platform competition, price volatility influenced by staking reward dynamics and inflationary supply mechanisms, market sentiment shifts affecting Layer 1 blockchain valuations.
- BAT: Concentration risk tied to Brave browser adoption rates, limited ecosystem diversification beyond advertising applications, price sensitivity to digital advertising market trends.
Technical Risks
- XTZ: Scalability considerations in network expansion, on-chain governance complexity, competition from alternative Layer 1 platforms.
- BAT: Dependency on Ethereum network performance, limited technical innovation beyond core advertising functionality, adoption barriers in mainstream advertising markets.
Regulatory Risks
- Global regulatory developments affect both assets differently based on their functional classifications. XTZ faces regulatory considerations related to smart contract platforms and staking mechanisms. BAT encounters regulatory scrutiny concerning advertising frameworks and data privacy regulations across jurisdictions.
VI. Conclusion: Which Is the Better Buy?
📌 Investment Value Summary:
- XTZ advantages: Self-amending blockchain architecture with on-chain governance capabilities, partnerships spanning gaming and sports sectors, positioning in DeFi and NFT ecosystems, Proof-of-Stake consensus mechanism supporting network participation incentives.
- BAT advantages: Focused use case in browser-based advertising with Brave browser integration, fixed supply model providing tokenomic clarity, established presence in digital content monetization space.
✅ Investment Recommendations:
- Beginner investors: Consider diversified exposure with emphasis on understanding supply mechanisms and ecosystem fundamentals. Focus on learning about Proof-of-Stake dynamics for XTZ and advertising token economics for BAT before allocation decisions.
- Experienced investors: Evaluate portfolio positioning based on smart contract platform exposure versus advertising sector allocation. Consider XTZ for Layer 1 blockchain diversification and BAT for niche advertising application exposure.
- Institutional investors: Assess regulatory compliance frameworks in relevant jurisdictions, analyze partnership developments and ecosystem growth metrics, consider allocation based on portfolio strategy alignment with smart contract infrastructure or advertising technology sectors.
⚠️ Risk Disclaimer: Cryptocurrency markets exhibit high volatility characteristics. This content does not constitute investment advice. Market conditions, regulatory environments, and technical developments may impact asset performance. Conduct thorough research and consider risk tolerance before making investment decisions.
VII. FAQ
Q1: What are the fundamental differences between XTZ and BAT's blockchain architectures?
XTZ operates as a self-amending Layer 1 blockchain with Proof-of-Stake consensus and on-chain governance, while BAT functions as an ERC-20 token on Ethereum focused solely on browser-based advertising. XTZ employs a modular architecture through its network shell that processes blockchain operations as functional modules, enabling representation of other protocols including Bitcoin and Ethereum. This design supports smart contracts, DeFi applications, and NFT ecosystems with formal verification capabilities. Conversely, BAT maintains a narrower technical scope, serving as a utility token within the Brave browser ecosystem to facilitate transactions between users, advertisers, and publishers without broader blockchain infrastructure ambitions.
Q2: How do the supply mechanisms of XTZ and BAT impact long-term investment considerations?
XTZ utilizes an inflationary supply model through staking rewards, while BAT features a fixed supply cap. The XTZ model generates approximately 1.07 billion circulating tokens from 1.09 billion total supply as of January 2026, with ongoing issuance incentivizing network participation but potentially diluting value over time. BAT's fixed supply creates scarcity-driven price dynamics without continuous dilution. For long-term investors, XTZ's inflationary mechanism requires monitoring staking participation rates and network growth to assess whether adoption outpaces token issuance, whereas BAT's fixed supply provides tokenomic clarity but limits growth incentives through supply expansion.
Q3: Which asset offers better risk-adjusted returns for conservative investors?
BAT may present more suitable characteristics for conservative investors seeking 60-70% portfolio allocation. BAT's fixed supply model eliminates inflation-related dilution concerns, and its focused use case within browser-based advertising provides clearer evaluation metrics compared to XTZ's broader but more competitive smart contract platform positioning. However, BAT carries concentration risk tied to Brave browser adoption rates and limited ecosystem diversification. Conservative investors should consider BAT's narrower application scope against XTZ's exposure to Layer 1 platform competition, scalability challenges, and governance complexity when assessing risk-adjusted return profiles.
Q4: What institutional adoption factors differentiate XTZ from BAT?
XTZ demonstrates broader institutional partnerships spanning gaming (Ubisoft) and sports sectors (Red Bull Racing Honda), positioning itself within enterprise blockchain infrastructure adoption trends. BAT's institutional presence centers on digital advertising platform integrations and mainstream media partnerships related to its browser-based functionality. XTZ's enterprise adoption focuses on smart contract capabilities and blockchain infrastructure applications, while BAT targets advertising technology implementations. Institutional investors evaluating these assets should assess alignment with portfolio strategies emphasizing either blockchain infrastructure diversification (XTZ) or advertising technology sector exposure (BAT), considering respective regulatory compliance frameworks.
Q5: How do 2026-2031 price forecasts reflect different growth trajectories?
Price forecasts indicate XTZ entering a growth phase with mid-term (2028-2029) projections of $0.60-$0.99 and long-term (2030-2031) baseline scenarios of $0.75-$1.07, representing potential 83% price appreciation by 2031. BAT projections show consolidation patterns with mid-term ranges of $0.16-$0.38 and long-term baseline scenarios of $0.24-$0.39, indicating 89% potential appreciation but from lower absolute price levels. These trajectories reflect XTZ's positioning in expanding DeFi and NFT ecosystems versus BAT's concentration in browser advertising markets. Investors should recognize that cryptocurrency price predictions carry significant uncertainty due to market volatility, regulatory developments, and adoption variables.
Q6: What technical risks should investors monitor for each asset?
XTZ faces scalability considerations in network expansion, on-chain governance complexity requiring stakeholder coordination, and competition from alternative Layer 1 platforms like Ethereum, Solana, and Cardano. BAT's technical risks include dependency on Ethereum network performance affecting transaction costs and speeds, limited technical innovation beyond core advertising functionality, and adoption barriers in mainstream advertising markets dominated by established players. XTZ investors should monitor network upgrade implementations and developer activity metrics, while BAT investors should track Brave browser user growth rates and integration developments with major advertising platforms.
Q7: How do macroeconomic factors differently impact XTZ versus BAT valuations?
Macroeconomic monetary policy affects both assets through risk appetite shifts and capital flow dynamics, but impacts manifest differently based on their market positioning. XTZ's smart contract platform characteristics expose it to institutional capital flows into blockchain infrastructure during risk-on environments and DeFi sector expansion trends. BAT's advertising-focused application ties its performance to digital advertising market health and consumer spending patterns affecting publisher revenues. Interest rate changes influence both through crypto market sentiment, but XTZ's broader ecosystem positioning may exhibit higher correlation with general Layer 1 platform cycles, while BAT demonstrates sensitivity to advertising industry-specific economic conditions.
Q8: What allocation strategies balance exposure between XTZ and BAT?
Aggressive investors seeking smart contract platform exposure may consider 60-70% XTZ allocation versus 30-40% BAT to capitalize on DeFi and NFT ecosystem expansion potential. Conservative investors prioritizing risk mitigation might allocate 30-40% XTZ and 60-70% BAT, emphasizing BAT's fixed supply clarity and focused use case. Diversified strategies should incorporate stablecoin allocations for liquidity management and consider cross-asset portfolio diversification beyond these two tokens. Experienced investors may implement dynamic rebalancing based on ecosystem development metrics, partnership announcements, and regulatory clarity developments affecting each asset's respective sectors.
* The information is not intended to be and does not constitute financial advice or any other recommendation of any sort offered or endorsed by Gate.