Explore the strategic comparison between YFII and OP in the DeFi market, focusing on yield farming vs. Ethereum Layer 2 scaling solutions. The article analyzes price trends, supply tokenomics, institutional interest, and technical development to guide investors in choosing the better buy. Addressing key investment concerns, it provides expert insights into risk management and asset allocation strategies. Suitable for both new and seasoned investors seeking clarity on market dynamics and future growth potential. Stay informed on price predictions with real-time updates from Gate, fostering well-rounded investment decisions.
Introduction: YFII vs OP Investment Comparison
In the cryptocurrency market, the comparison between YFII and OP has always been an unavoidable topic for investors. The two not only show significant differences in market cap ranking, application scenarios, and price performance, but also represent different cryptocurrency asset positions.
YFII (YFII): Since its launch in 2020, it has gained market recognition for its aggregated yield farming platform.
OP (OP): Introduced in 2022, it has been hailed as a low-cost, lightning-fast Ethereum Layer 2 blockchain solution.
This article will provide a comprehensive analysis of the investment value comparison between YFII and OP, focusing on historical price trends, supply mechanisms, institutional adoption, technological ecosystems, and future predictions, attempting to answer the question investors care about most:
"Which is the better buy right now?"
I. Price History Comparison and Current Market Status
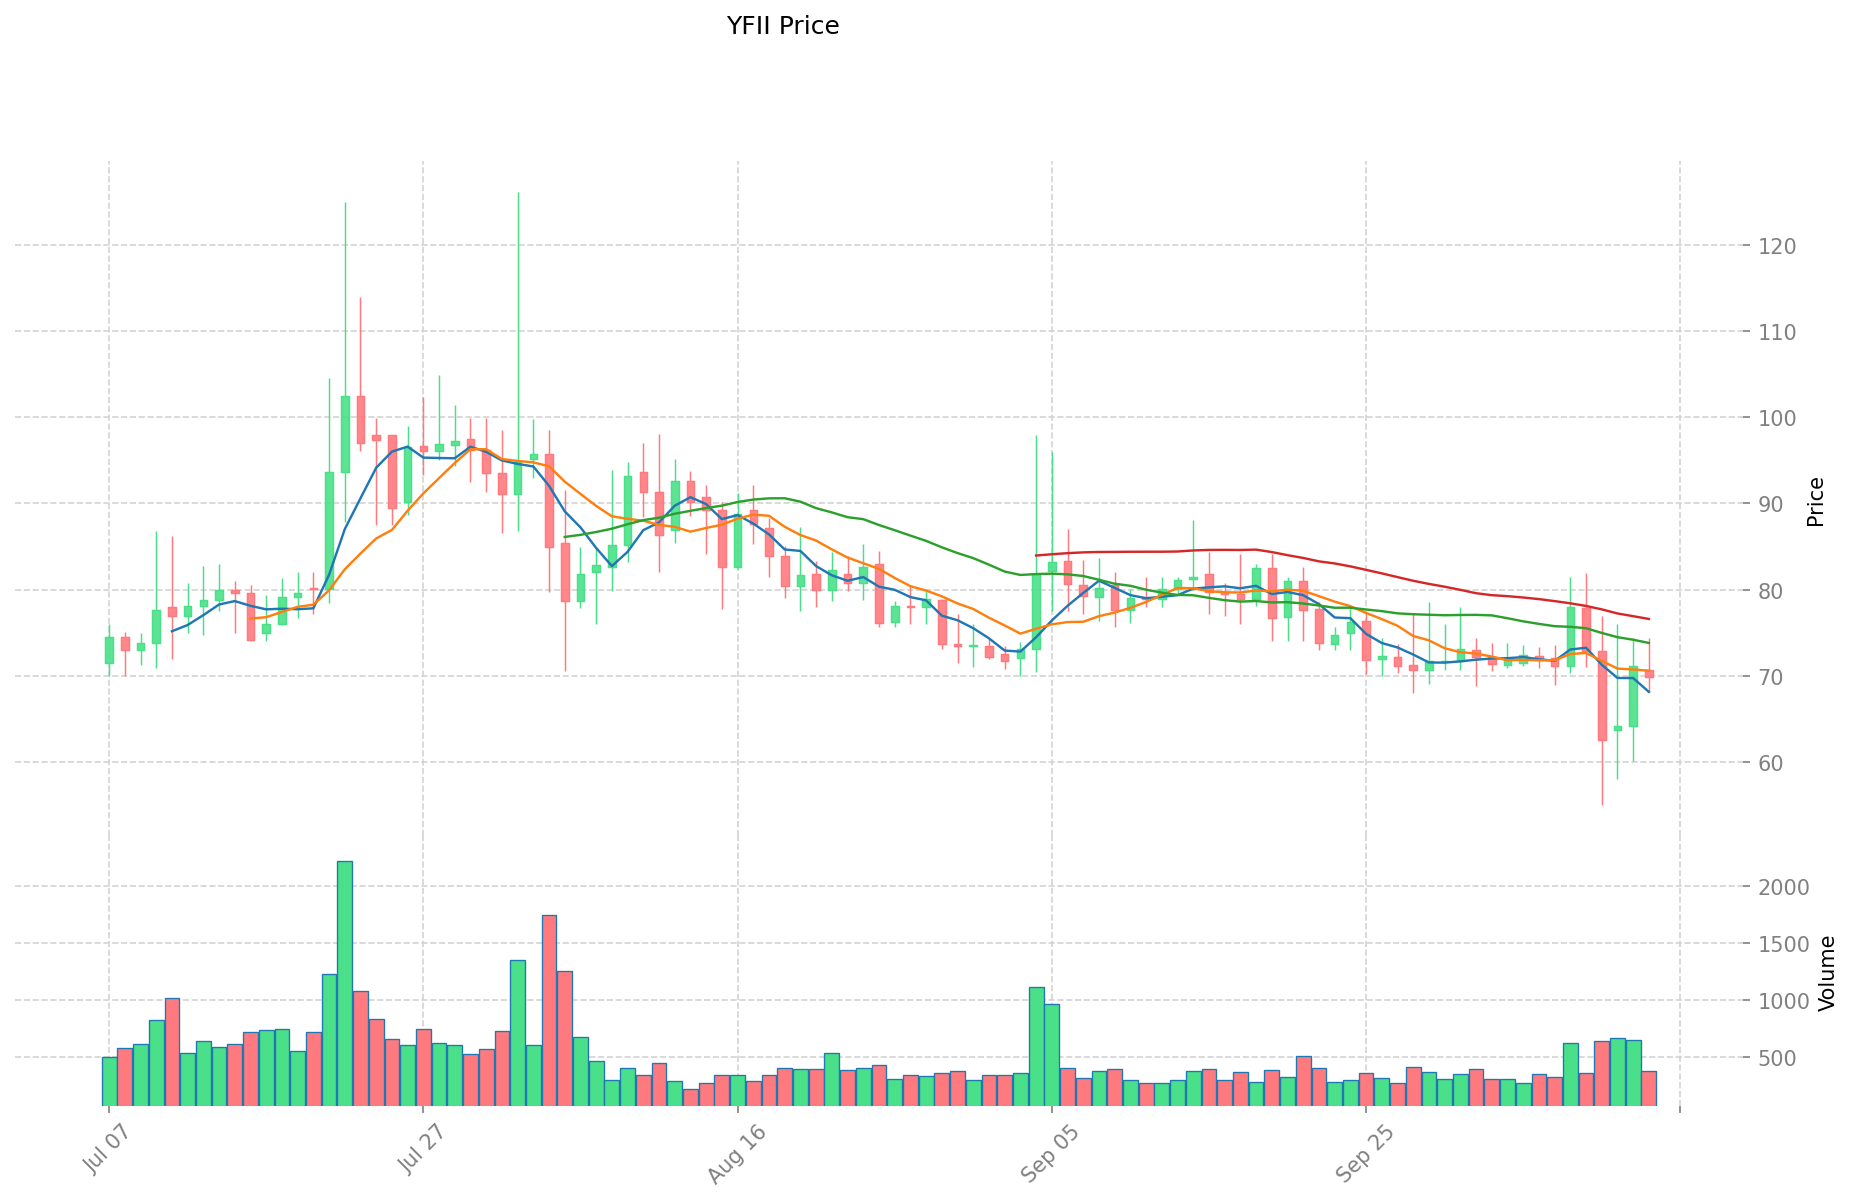
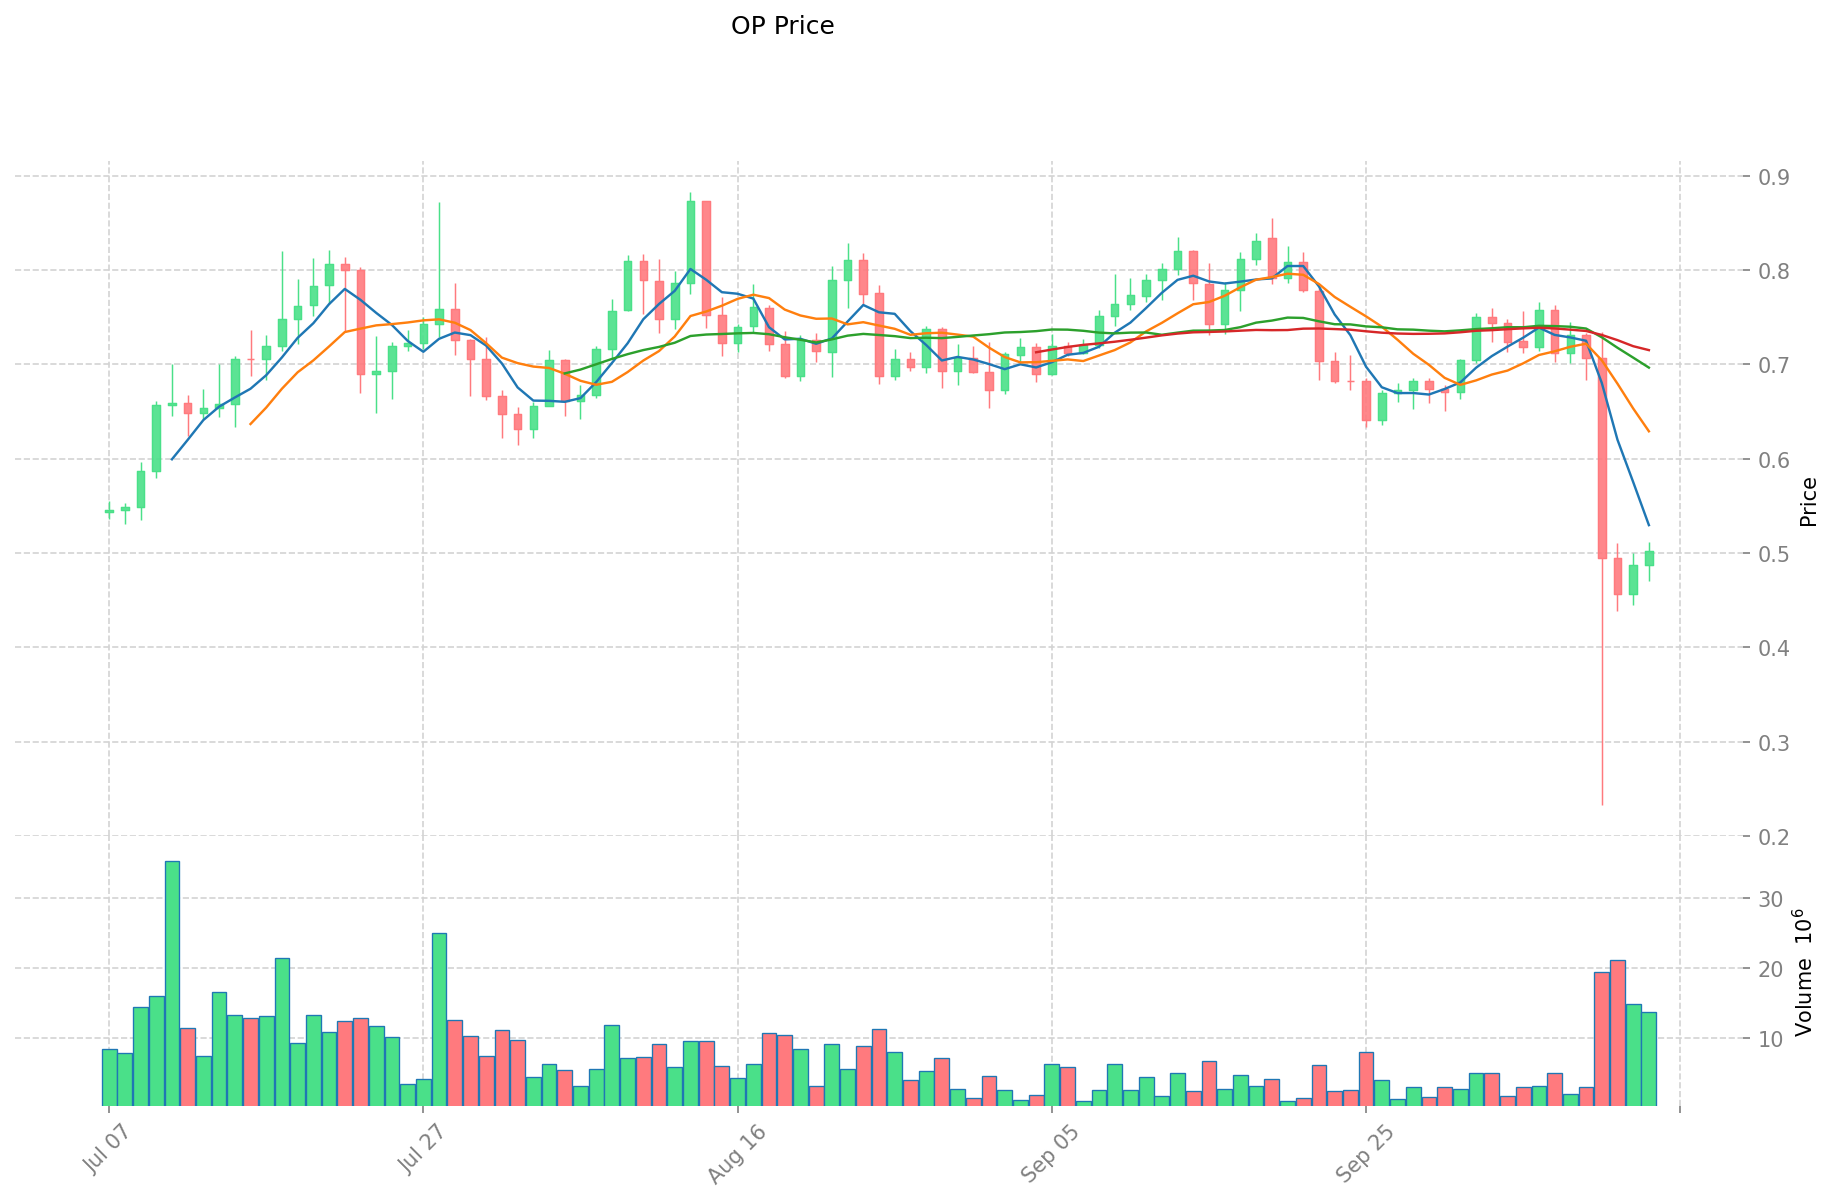
YFII (Coin A) and OP (Coin B) Historical Price Trends
- 2020: YFII reached its all-time high of $9,251.7 on September 2, 2020.
- 2024: OP achieved its all-time high of $4.84 on March 6, 2024.
- Comparative Analysis: YFII has fallen from its peak of $9,251.7 to a current price of $69.94, while OP has declined from its high of $4.84 to $0.5025.
Current Market Situation (2025-10-14)
- YFII current price: $69.94
- OP current price: $0.5025
- 24-hour trading volume: YFII $26,204.54 vs OP $6,626,739.87
- Market Sentiment Index (Fear & Greed Index): 38 (Fear)
Click to view real-time prices:
- Check YFII current price Market Price
- Check OP current price Market Price
II. Core Factors Affecting Investment Value of YFII vs OP
Supply Mechanism Comparison (Tokenomics)
-
YFII: Limited supply of 60,000 tokens with deflationary characteristics; no new tokens are minted
-
OP: Initial supply of 4.29 billion tokens with gradual distribution over time through ecosystem grants, airdrops, and governance allocations
-
📌 Historical Pattern: Fixed supply tokens like YFII tend to experience higher volatility during bull markets due to limited supply, while tokens with distribution schedules like OP typically show more gradual price action tied to ecosystem expansion.
Institutional Adoption and Market Applications
- Institutional Holdings: OP has garnered more significant institutional interest, with backing from a16z and other major venture capital firms supporting the Optimism ecosystem
- Enterprise Adoption: OP has broader enterprise adoption through its Layer 2 scaling solution for Ethereum, while YFII has limited enterprise applications beyond yield farming
- Regulatory Attitudes: Both tokens face regulatory uncertainty, but OP's infrastructure focus may position it more favorably than YFII's DeFi yield optimization approach in evolving regulatory frameworks
Technical Development and Ecosystem Building
- YFII Technical Development: Limited recent development activity with focus on maintaining yield optimization strategies
- OP Technical Development: Continuous development of Optimism's Layer 2 scaling solution with the OP Stack, focusing on improving transaction throughput and reducing costs for Ethereum
- Ecosystem Comparison: OP has a much more robust ecosystem with hundreds of applications built on Optimism's Layer 2 solution across DeFi, NFTs, and gaming, while YFII's ecosystem remains primarily focused on yield farming with diminishing developer activity
Macroeconomic Factors and Market Cycles
- Inflation Performance: Neither token has proven strong anti-inflationary properties, but OP's utility in reducing Ethereum gas fees could provide indirect value during high transaction cost periods
- Macroeconomic Monetary Policy: Both tokens are affected by risk-on/risk-off sentiment, with YFII showing higher correlation to general crypto market movements
- Geopolitical Factors: OP's infrastructure role in scaling Ethereum provides more utility during periods of high blockchain congestion, whereas YFII lacks specific geopolitical advantages
III. 2025-2030 Price Prediction: YFII vs OP
Short-term Prediction (2025)
- YFII: Conservative $67.14 - $69.94 | Optimistic $69.94 - $73.44
- OP: Conservative $0.37 - $0.51 | Optimistic $0.51 - $0.52
Mid-term Prediction (2027)
- YFII may enter a growth phase, with prices estimated at $51.92 - $109.18
- OP may enter a growth phase, with prices estimated at $0.47 - $0.70
- Key drivers: Institutional fund inflows, ETFs, ecosystem development
Long-term Prediction (2030)
- YFII: Base scenario $54.91 - $103.61 | Optimistic scenario $103.61 - $129.51
- OP: Base scenario $0.57 - $0.79 | Optimistic scenario $0.79 - $0.87
View detailed price predictions for YFII and OP
Disclaimer: The information provided is for informational purposes only and should not be considered as financial advice. Cryptocurrency markets are highly volatile and unpredictable. Always conduct your own research before making any investment decisions.
YFII:
| 年份 |
预测最高价 |
预测平均价格 |
预测最低价 |
涨跌幅 |
| 2025 |
73.437 |
69.94 |
67.1424 |
0 |
| 2026 |
81.008005 |
71.6885 |
51.61572 |
2 |
| 2027 |
109.178001075 |
76.3482525 |
51.9168117 |
9 |
| 2028 |
96.473651859 |
92.7631267875 |
63.0789262155 |
32 |
| 2029 |
112.5958832946675 |
94.61838932325 |
49.20156244809 |
35 |
| 2030 |
129.508920386198437 |
103.60713630895875 |
54.911782243748137 |
48 |
OP:
| 年份 |
预测最高价 |
预测平均价格 |
预测最低价 |
涨跌幅 |
| 2025 |
0.521077 |
0.5059 |
0.369307 |
0 |
| 2026 |
0.67780482 |
0.5134885 |
0.426195455 |
2 |
| 2027 |
0.7028630588 |
0.59564666 |
0.4705608614 |
18 |
| 2028 |
0.668732505182 |
0.6492548594 |
0.590821922054 |
29 |
| 2029 |
0.92918109203031 |
0.658993682291 |
0.42834589348915 |
31 |
| 2030 |
0.865555252005113 |
0.794087387160655 |
0.571742918755671 |
57 |
IV. Investment Strategy Comparison: YFII vs OP
Long-term vs Short-term Investment Strategy
- YFII: Suitable for investors focused on yield farming and DeFi opportunities
- OP: Suitable for investors interested in Ethereum scaling solutions and Layer 2 ecosystem growth
Risk Management and Asset Allocation
- Conservative investors: YFII: 20% vs OP: 80%
- Aggressive investors: YFII: 40% vs OP: 60%
- Hedging tools: Stablecoin allocation, options, cross-token portfolio
V. Potential Risk Comparison
Market Risk
- YFII: High volatility due to limited supply and declining interest in yield farming
- OP: Dependent on Ethereum's success and adoption of Layer 2 solutions
Technical Risk
- YFII: Limited ongoing development, potential for smart contract vulnerabilities
- OP: Scalability challenges, network stability during high traffic periods
Regulatory Risk
- Global regulatory policies may have a more significant impact on YFII due to its DeFi focus, while OP's infrastructure role may be viewed more favorably
VI. Conclusion: Which Is the Better Buy?
📌 Investment Value Summary:
- YFII advantages: Limited supply, potential for high volatility in bull markets
- OP advantages: Strong institutional backing, growing ecosystem, utility in Ethereum scaling
✅ Investment Advice:
- New investors: Consider a smaller allocation to OP as part of a diversified portfolio
- Experienced investors: Balanced approach with higher weight towards OP, monitoring YFII for short-term opportunities
- Institutional investors: Focus on OP for its ecosystem growth and potential long-term value in Ethereum scaling
⚠️ Risk Warning: Cryptocurrency markets are highly volatile, and this article does not constitute investment advice.
None
VII. FAQ
Q1: What are the main differences between YFII and OP?
A: YFII is a yield farming platform with a limited token supply, while OP is an Ethereum Layer 2 scaling solution with a larger, gradually distributed token supply. OP has broader enterprise adoption and a more robust ecosystem, while YFII focuses primarily on DeFi yield optimization.
Q2: Which token has shown better price performance historically?
A: YFII reached a higher all-time high of $9,251.7 in 2020, compared to OP's all-time high of $4.84 in 2024. However, YFII has experienced a more significant price decline since its peak, while OP has shown more stability in recent market conditions.
Q3: How do the future price predictions for YFII and OP compare?
A: Long-term predictions for 2030 suggest YFII could reach $54.91 - $129.51, while OP is projected to reach $0.57 - $0.87. OP is expected to have more consistent growth, while YFII may experience higher volatility.
Q4: What are the key factors affecting the investment value of YFII and OP?
A: Key factors include supply mechanisms, institutional adoption, technical development, ecosystem building, and macroeconomic factors. OP generally shows stronger performance in these areas, particularly in institutional backing and ecosystem growth.
Q5: How should investors allocate their portfolio between YFII and OP?
A: Conservative investors might consider allocating 20% to YFII and 80% to OP, while more aggressive investors could opt for a 40% YFII and 60% OP split. The exact allocation should be based on individual risk tolerance and investment goals.
Q6: What are the main risks associated with investing in YFII and OP?
A: Both tokens face market volatility and regulatory risks. YFII has additional risks due to limited ongoing development and declining interest in yield farming. OP faces risks related to Ethereum's success and potential scalability challenges.
Q7: Which token is considered a better buy for different types of investors?
A: For new investors, OP may be a better choice due to its stronger ecosystem and institutional backing. Experienced investors might consider a balanced approach with a higher weight towards OP. Institutional investors may focus more on OP for its potential long-term value in Ethereum scaling.
* The information is not intended to be and does not constitute financial advice or any other recommendation of any sort offered or endorsed by Gate.


