This comprehensive analysis compares ZBCN and CRO, two distinct blockchain networks serving different market segments. ZBCN, a decentralized payment streaming infrastructure launched in April 2022, focuses on instant payment solutions with a market cap of $274.9 million. CRO, an established ecosystem partner of Crypto.com since December 2018, boasts $3.9 billion market capitalization serving over 100 million users across DeFi and gaming. The article examines historical price trends, current market status, tokenomics, institutional adoption, technology development, and price predictions through 2031. ZBCN demonstrated recovery from August 2024 lows, while CRO declined from 2021 peaks. Detailed investment strategies address conservative and aggressive investors, risk management frameworks, and regulatory considerations. Comparative analysis reveals CRO's liquidity advantages and institutional backing versus ZBCN's growth potential in emerging payment infrastructure.
Introduction: Investment Comparison Between ZBCN and CRO
In the cryptocurrency market, the comparison between ZBCN vs CRO has become an ongoing topic among investors. The two differ significantly in market cap ranking, application scenarios, and price performance, representing distinct positioning within the crypto asset landscape.
Zebec Protocol (ZBCN): Launched in April 2022, it has gained market recognition through its decentralized infrastructure network designed to enable seamless real-world value flow, focusing on instant payment streaming and financial accessibility.
Cronos (CRO): Since its launch in December 2018, it has established itself as a leading blockchain ecosystem, partnering with Crypto.com and representing an addressable user base exceeding one hundred million people globally, with emphasis on DeFi and gaming.
This article will comprehensively analyze the investment value comparison between ZBCN vs CRO across historical price trends, supply mechanisms, institutional adoption, technical ecosystems, and future predictions, attempting to answer investors' most pressing question:
"Which is the better buy right now?"
I. Historical Price Comparison and Current Market Status
Historical Price Trends of ZBCN (Coin A) and CRO (Coin B)
- 2024: ZBCN experienced notable volatility, with its price reaching a historical low of $0.000686 in August 2024, reflecting market pressures during this period.
- 2025: ZBCN showed recovery momentum, recording a historical high of $0.007193 in May 2025, representing significant growth from its previous low point.
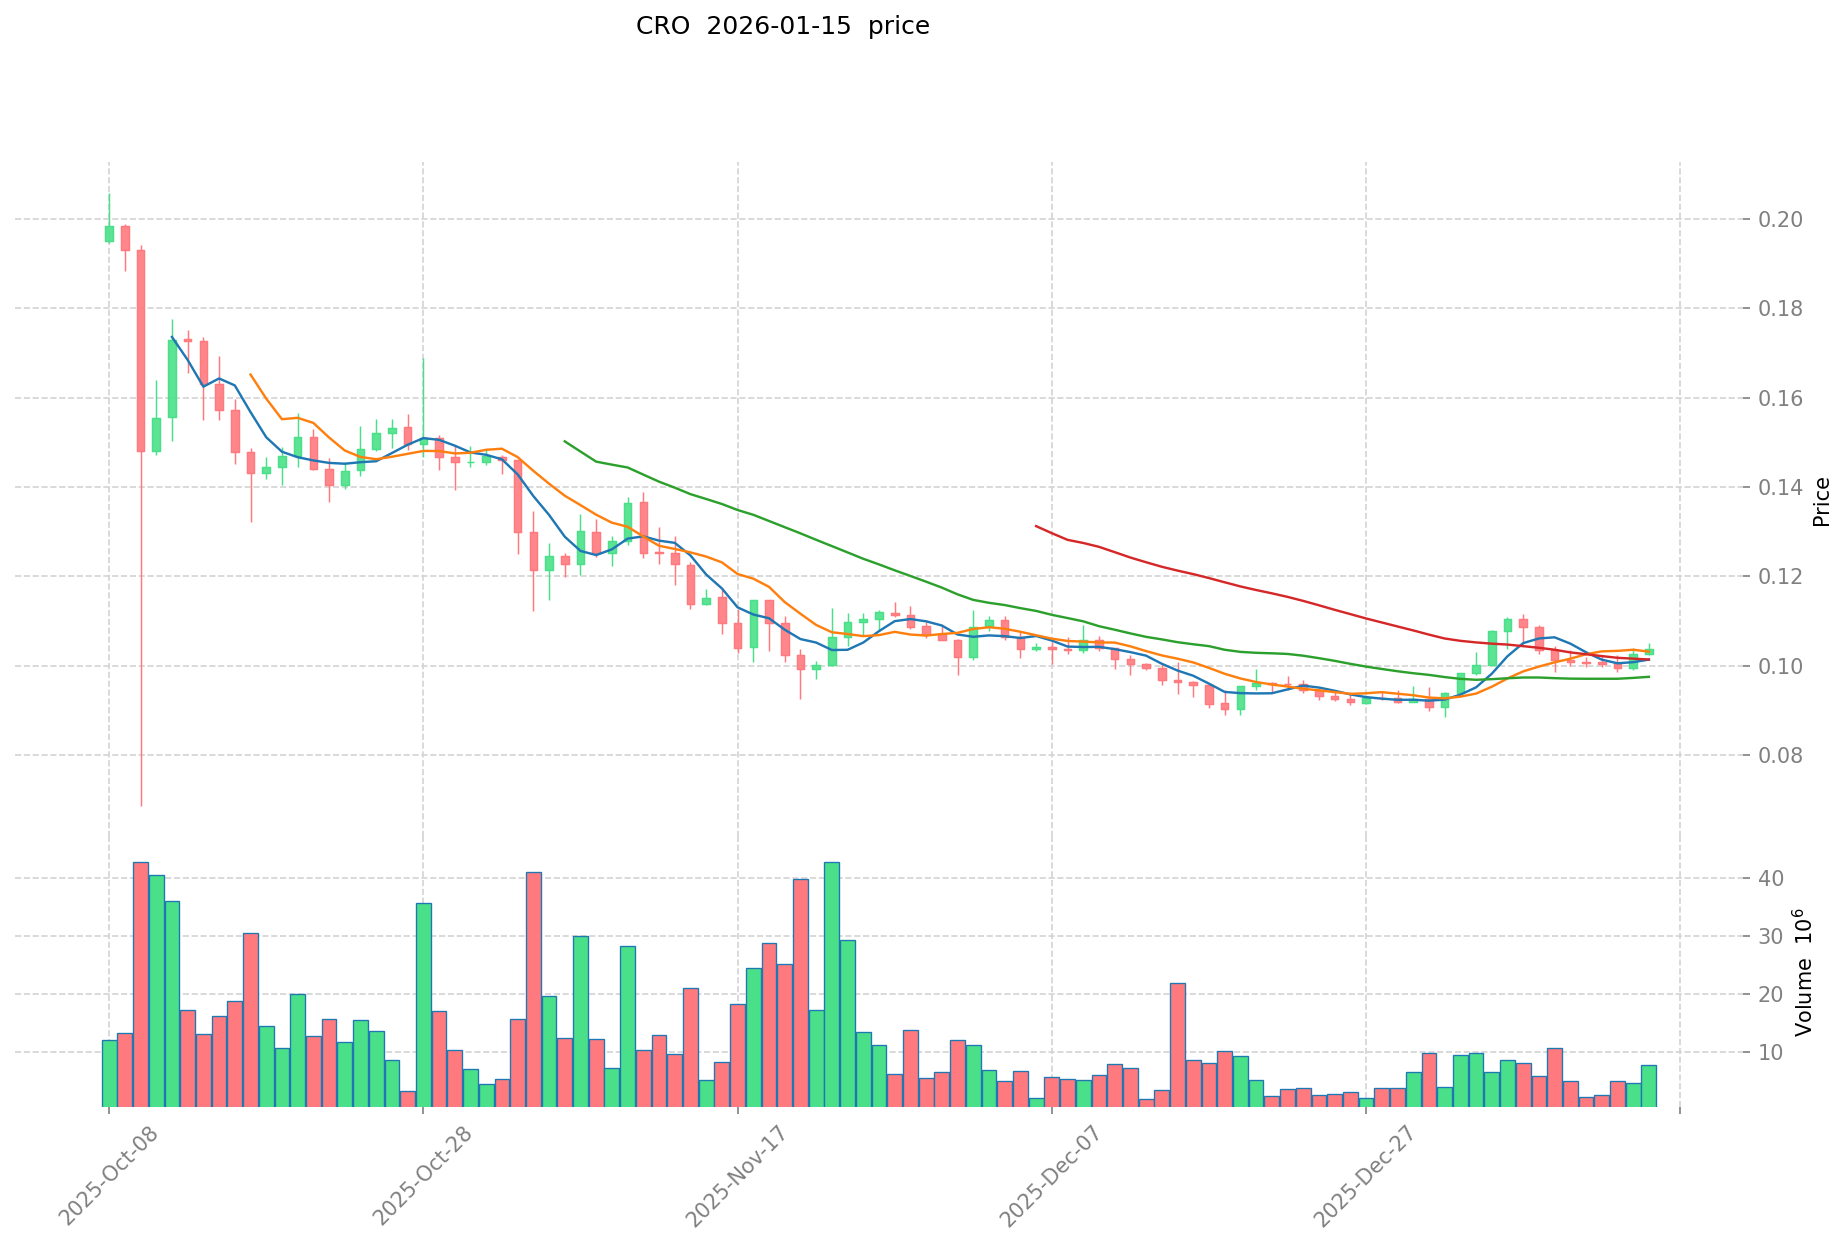
- 2021: CRO reached its historical peak at $0.965407 in November 2021, driven by the broader cryptocurrency market surge and increased adoption of the Crypto.com ecosystem.
- 2019: CRO experienced its historical low of $0.0121196 in February 2019, during the early stages of the project's development.
- Comparative Analysis: During the 2024-2025 market cycle, ZBCN demonstrated recovery from its low of $0.000686 to reach $0.007193, representing substantial percentage growth. In contrast, CRO has experienced a downward trend from its 2021 peak of $0.965407, currently trading significantly below historical highs, reflecting different market trajectories for the two assets.
Current Market Status (2026-01-15)
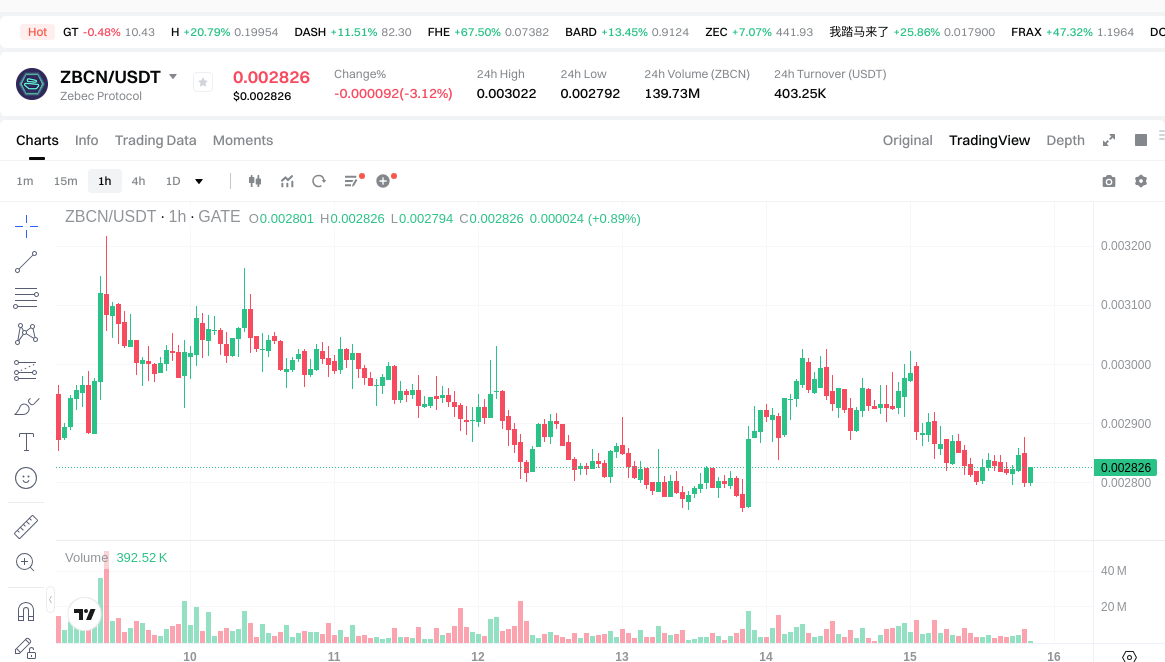
- ZBCN Current Price: $0.002837
- CRO Current Price: $0.10224
- 24-Hour Trading Volume: ZBCN $405,757.68 vs CRO $738,967.06
- Market Capitalization: ZBCN $274,933,825.55 vs CRO $3,948,153,227.84
- Market Sentiment Index (Fear & Greed Index): 61 (Greed)
View real-time prices:
II. Core Factors Influencing ZBCN vs CRO Investment Value
Supply Mechanism Comparison (Tokenomics)
- ZBCN: Supply mechanism details are not available in the provided materials
- CRO: Supply mechanism details are not available in the provided materials
- 📌 Historical Pattern: Token supply mechanisms can significantly influence price cycles through controlled release schedules and demand-supply dynamics
Institutional Adoption and Market Applications
- Institutional Holdings: The CRO industry has attracted significant attention from capital markets, with multiple CRO enterprises successfully going public over the past decade and demonstrating strong international business expansion
- Enterprise Adoption: CRO services have become deeply integrated into pharmaceutical research and development chains globally. China's CRO industry reached a market scale of 101.4 billion yuan in 2023, with an annual compound growth rate exceeding 19%. Leading companies have established local business development teams and logistics distribution systems in Europe, Japan, and other regions
- National Policies: Government support has been a crucial driver for CRO industry development. Policy optimization including streamlined review and approval processes, and draft regulations on innovative drug pricing autonomy have provided broader market opportunities. Multiple cities including Beijing and Shanghai have released supportive policies for high-quality innovative drug development
Technology Development and Ecosystem Building
- ZBCN Technology Upgrades: Technology development details are not available in the provided materials
- CRO Technology Development: The industry is advancing through AI integration, with companies establishing AI-powered one-stop innovative drug preclinical R&D service platforms. AI technology has improved compound screening efficiency and shortened development cycles. Companies are focusing on cutting-edge research needs and exploring frontier technologies to ensure future service capabilities for novel drug types
- Ecosystem Comparison: The CRO ecosystem spans the entire pharmaceutical lifecycle, including drug discovery, preclinical research, clinical trials (Phase I-IV), registration applications, and post-market monitoring. The industry covers multiple interdisciplinary fields including laboratory chemistry, biological sciences, drug safety evaluation, and clinical research. Some companies serve over 11,000 scientific research users globally with compound libraries exceeding 132,000 varieties
Macroeconomic and Market Cycles
- Performance in Inflationary Environments: The CRO industry demonstrates resilience through its knowledge-intensive nature and essential role in pharmaceutical development, though specific inflation-hedging characteristics require further analysis
- Macroeconomic Monetary Policy: The industry faces challenges from periodic cooling in domestic pharmaceutical investment and financing, which has impacted supply-demand dynamics and enterprise performance. Some market segments have experienced intensified competition
- Geopolitical Factors: China's CRO industry benefits from cost advantages compared to developed countries in Europe and America, attracting international CRO demand transfer. However, international order volumes for Chinese CRO enterprises face potential pressure, with market share experiencing compression risks. The industry's globalization strategy remains important, with overseas revenue accounting for substantial portions of leading companies' businesses
III. 2026-2031 Price Prediction: ZBCN vs CRO
Short-term Prediction (2026)
- ZBCN: Conservative $0.001921 - $0.002825 | Optimistic $0.002825 - $0.003277
- CRO: Conservative $0.0625006 - $0.10246 | Optimistic $0.10246 - $0.1516408
Mid-term Prediction (2028-2029)
- ZBCN may enter a consolidation phase, with estimated price range of $0.0030525255 - $0.0048068505 in 2028, and $0.00216203013 - $0.0045319477725 in 2029
- CRO may enter a growth phase, with estimated price range of $0.125779896 - $0.181523259 in 2028, and $0.12653743401 - $0.219007097325 in 2029
- Key drivers: institutional capital flows, ETF developments, ecosystem expansion
Long-term Prediction (2030-2031)
- ZBCN: Baseline scenario $0.002346218466075 - $0.00434484901125 (2030) | Optimistic scenario $0.002791999974629 - $0.005007872970366 (2031)
- CRO: Baseline scenario $0.1753679053395 - $0.1906172884125 (2030) | Optimistic scenario $0.102075557944893 - $0.244180746456412 (2031)
View detailed price predictions for ZBCN and CRO
Disclaimer
ZBCN:
| Year |
Predicted High Price |
Predicted Average Price |
Predicted Low Price |
Price Change |
| 2026 |
0.003277 |
0.002825 |
0.001921 |
0 |
| 2027 |
0.0039663 |
0.003051 |
0.0018306 |
7 |
| 2028 |
0.0048068505 |
0.00350865 |
0.0030525255 |
23 |
| 2029 |
0.0045319477725 |
0.00415775025 |
0.00216203013 |
46 |
| 2030 |
0.0045186429717 |
0.00434484901125 |
0.002346218466075 |
53 |
| 2031 |
0.005007872970366 |
0.004431745991475 |
0.002791999974629 |
56 |
CRO:
| Year |
Predicted High Price |
Predicted Average Price |
Predicted Low Price |
Price Change |
| 2026 |
0.1516408 |
0.10246 |
0.0625006 |
0 |
| 2027 |
0.158813 |
0.1270504 |
0.081312256 |
24 |
| 2028 |
0.181523259 |
0.1429317 |
0.125779896 |
39 |
| 2029 |
0.219007097325 |
0.1622274795 |
0.12653743401 |
58 |
| 2030 |
0.20967901725375 |
0.1906172884125 |
0.1753679053395 |
86 |
| 2031 |
0.244180746456412 |
0.200148152833125 |
0.102075557944893 |
95 |
IV. Investment Strategy Comparison: ZBCN vs CRO
Long-term vs Short-term Investment Strategies
- ZBCN: May suit investors focusing on emerging payment streaming infrastructure and exploring early-stage opportunities in decentralized finance accessibility. The asset demonstrated recovery patterns from August 2024 lows to May 2025 highs, though current prices remain below recent peaks
- CRO: May suit investors seeking exposure to established blockchain ecosystems with institutional backing and diversified application scenarios spanning DeFi and gaming sectors. The asset maintains substantial market capitalization positioning despite trading below historical 2021 peaks
Risk Management and Asset Allocation
- Conservative Investors: ZBCN 20-30% vs CRO 70-80% allocation could reflect risk tolerance preferences, with higher allocation toward the larger market cap asset
- Aggressive Investors: ZBCN 50-60% vs CRO 40-50% allocation might appeal to those seeking exposure to smaller cap assets with potential growth trajectories
- Hedging Tools: Stablecoin positioning, derivatives instruments, and cross-asset portfolio diversification strategies may help manage volatility exposure
V. Potential Risk Comparison
Market Risks
- ZBCN: The asset experienced substantial price volatility during 2024-2025, with the historical low of $0.000686 in August 2024 indicating significant downside risk exposure. Current trading volume of $405,757.68 reflects relatively limited liquidity compared to larger market cap assets
- CRO: The asset has experienced sustained decline from its November 2021 peak of $0.965407, currently trading at approximately 10.6% of historical highs. Market sentiment cycles and broader cryptocurrency market conditions may continue influencing price movements
Technical Risks
- ZBCN: Scalability considerations and network stability factors may influence long-term adoption trajectories for decentralized payment streaming infrastructure
- CRO: Network concentration dynamics and potential security vulnerabilities represent considerations for blockchain ecosystem platforms with extensive user bases and transaction volumes
Regulatory Risks
- Global regulatory policy developments may affect both assets differently based on their respective application scenarios. Payment-focused protocols and exchange-associated blockchain platforms may face distinct regulatory frameworks across jurisdictions. Cross-border operation considerations and compliance requirements represent ongoing factors for international cryptocurrency projects
VI. Conclusion: Which Is the Better Buy?
📌 Investment Value Summary:
- ZBCN Characteristics: Smaller market capitalization ($274,933,825.55) positioning with focus on decentralized payment streaming infrastructure. Demonstrated recovery patterns during 2024-2025 period from historical lows, though maintaining relatively limited trading volumes
- CRO Characteristics: Established market presence with substantial capitalization ($3,948,153,227.84) and institutional partnerships. Operates diversified blockchain ecosystem spanning DeFi and gaming applications with addressable user base exceeding one hundred million globally
✅ Investment Considerations:
- Novice Investors: May consider prioritizing assets with established track records, substantial liquidity, and comprehensive ecosystem development. Gradual position building and thorough research remain important regardless of asset selection
- Experienced Investors: May evaluate portfolio diversification strategies incorporating both established platforms and emerging infrastructure projects based on individual risk tolerance and market outlook. Technical analysis and fundamental research across multiple timeframes could inform allocation decisions
- Institutional Investors: May assess liquidity profiles, custody solutions, regulatory compliance frameworks, and ecosystem development trajectories when evaluating exposure to different cryptocurrency market segments
⚠️ Risk Disclosure: Cryptocurrency markets exhibit extreme volatility characteristics. This content does not constitute investment advice. Investors should conduct independent research and consider consulting qualified financial advisors before making investment decisions.
VII. FAQ
Q1: What is the main difference between ZBCN and CRO in terms of market positioning?
ZBCN focuses on decentralized payment streaming infrastructure with a smaller market cap of $274.9 million, while CRO operates as an established blockchain ecosystem with $3.9 billion market capitalization backed by Crypto.com. ZBCN launched in April 2022 targeting instant payment streaming and financial accessibility, representing an emerging infrastructure play. In contrast, CRO has been operational since December 2018, serving over 100 million users globally through diversified applications in DeFi and gaming sectors, positioning it as a mature ecosystem platform with institutional partnerships.
Q2: How have ZBCN and CRO performed historically in terms of price movements?
ZBCN demonstrated significant volatility, reaching a historical low of $0.000686 in August 2024 before recovering to a peak of $0.007193 in May 2025, representing substantial percentage gains from its bottom. CRO achieved its all-time high of $0.965407 in November 2021 during the broader cryptocurrency bull market but has since declined significantly, currently trading at approximately 10.6% of that peak at $0.10224. While ZBCN showed recovery momentum in the recent cycle, CRO has experienced a prolonged downtrend from its historical highs, reflecting different market trajectories and maturity stages.
Q3: What are the predicted price ranges for ZBCN and CRO through 2031?
For ZBCN, conservative 2026 predictions range from $0.001921 to $0.002825, potentially reaching $0.002791 to $0.005007 by 2031 in optimistic scenarios. CRO's conservative 2026 outlook suggests $0.0625 to $0.10246, with optimistic long-term projections of $0.102075 to $0.244180 by 2031. These predictions indicate CRO maintains higher absolute price levels due to its established market position, while ZBCN's percentage growth potential may be higher given its smaller base. However, cryptocurrency price predictions involve substantial uncertainty and should not be interpreted as guaranteed outcomes.
Q4: Which asset is more suitable for conservative versus aggressive investors?
Conservative investors might consider a 70-80% CRO and 20-30% ZBCN allocation, prioritizing the larger market cap asset with established ecosystem and higher liquidity. CRO's substantial trading volume of $738,967.06 versus ZBCN's $405,757.68 reflects better market depth for position entry and exit. Aggressive investors seeking higher risk-reward profiles might allocate 50-60% to ZBCN and 40-50% to CRO, gaining exposure to emerging payment infrastructure with potential growth trajectories. Both approaches should incorporate proper risk management through stablecoin positioning, derivatives hedging, and portfolio diversification beyond these two assets.
Q5: What are the primary risks associated with investing in ZBCN versus CRO?
ZBCN faces market risks from limited liquidity and high volatility, evidenced by its 2024 price collapse to $0.000686 and relatively modest trading volumes. Technical risks include scalability challenges and network stability concerns for its decentralized payment streaming infrastructure. CRO's primary risk stems from sustained price decline of approximately 89% from its 2021 peak, plus potential network concentration and security vulnerabilities given its extensive user base. Both assets face regulatory uncertainties, though potentially different frameworks—ZBCN as a payment-focused protocol and CRO as an exchange-associated blockchain platform may encounter distinct compliance requirements across jurisdictions.
Q6: How do institutional adoption and real-world applications differ between the two assets?
CRO demonstrates significant institutional integration through its partnership with Crypto.com, serving over 100 million users globally with applications spanning DeFi services, gaming platforms, and payment solutions. The broader CRO industry has achieved substantial market scale, reaching 101.4 billion yuan in China alone during 2023 with compound annual growth exceeding 19%. ZBCN's institutional adoption details are less documented in available materials, positioning it as a more emerging infrastructure project focused on payment streaming technology. This difference reflects CRO's maturity advantage in enterprise partnerships and established user base versus ZBCN's early-stage development in decentralized financial accessibility infrastructure.
* The information is not intended to be and does not constitute financial advice or any other recommendation of any sort offered or endorsed by Gate.