This comprehensive analysis compares ZCX and DOT, two distinct blockchain assets with different market positions and investment profiles. ZCX, launched in 2021 as an Ethereum-based utility token for the Unizen Exchange ecosystem, has declined 99.96% from its $7.03 peak, while DOT, Polkadot's interoperability protocol launched in 2019, has dropped 97.18% from $54.98. The comparison examines historical price trends, tokenomics, technological ecosystems, and institutional adoption across both assets. With DOT demonstrating substantially higher liquidity ($2,354,339.18 daily volume versus ZCX's $14,961.47), it appeals to conservative investors seeking protocol-layer infrastructure exposure, while ZCX attracts higher-risk investors interested in exchange ecosystem tokens. Price predictions through 2031 suggest varying growth trajectories for both assets. The article provides risk assessments, allocation strategies for different investor profiles, and detailed FAQ addressing market capitalization differences, liqui
Introduction: Investment Comparison Between ZCX and DOT
In the cryptocurrency market, the comparison between ZCX vs DOT has consistently been a topic that investors cannot overlook. The two differ significantly in market capitalization ranking, application scenarios, and price performance, while representing distinct positioning within the crypto asset landscape.
ZCX (Unizen): Launched in 2021, this exchange-based platform token operates on the Ethereum blockchain and has gained market recognition through its positioning as a utility token within the Unizen Exchange ecosystem, which runs on Binance Cloud's trading and security infrastructure.
DOT (Polkadot): Since its launch in 2019, Polkadot has been recognized for its role in connecting private chains, consortium chains, public chains, and open networks, establishing itself as one of the major blockchain interoperability protocols in terms of market capitalization.
This article will provide a comprehensive analysis of the investment value comparison between ZCX vs DOT, focusing on historical price trends, supply mechanisms, technological ecosystems, and future outlook, attempting to address the question that concerns investors most:
"Which is the better buy right now?"
I. Historical Price Comparison and Current Market Status
ZCX and DOT Historical Price Trends
-
2021: ZCX reached a peak price of $7.03 on September 14, 2021, during a period of heightened market activity. In contrast, DOT achieved its all-time high of $54.98 on November 4, 2021, benefiting from broader market momentum and increased adoption of its multi-chain ecosystem.
-
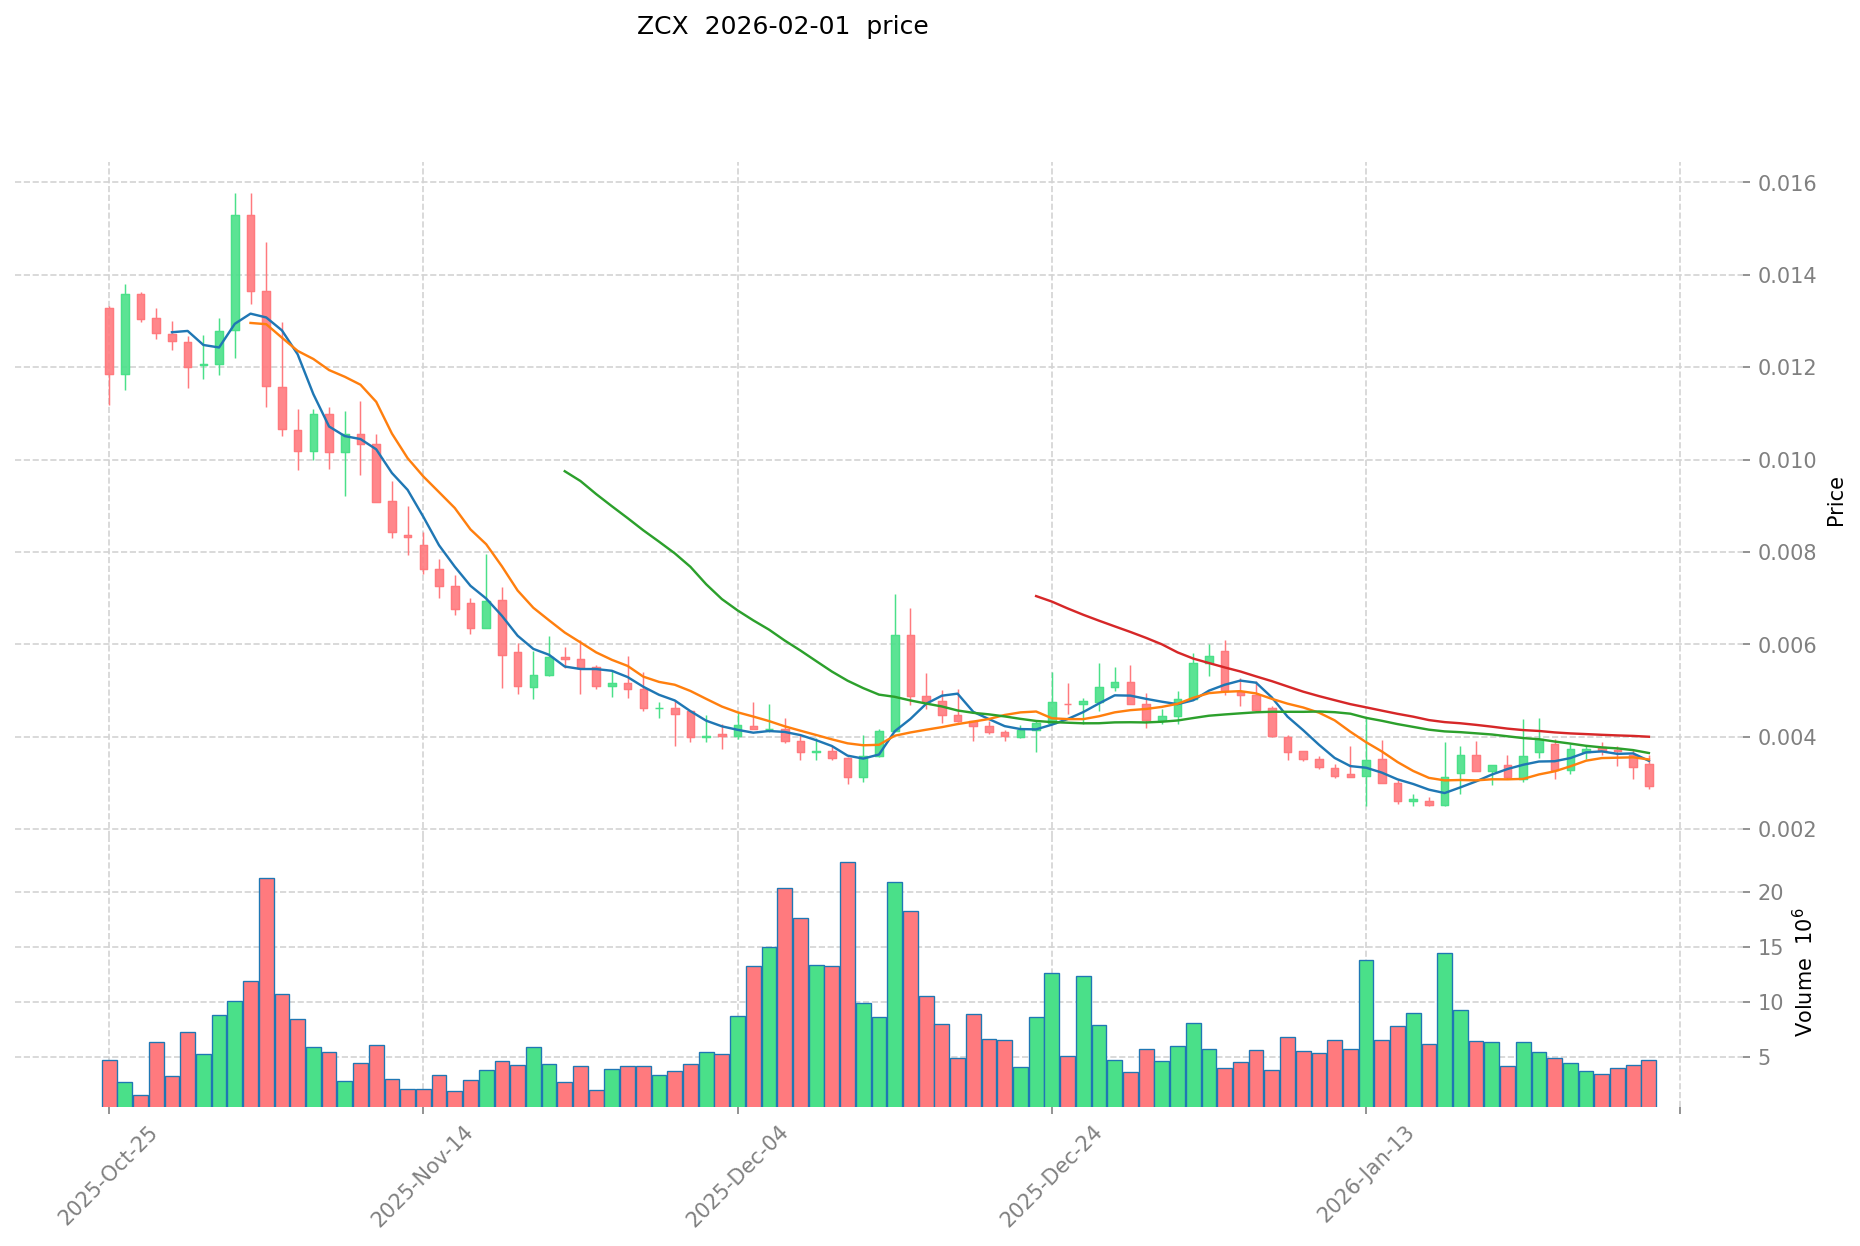
2026: ZCX recorded its historical low of $0.00251208 on January 18, 2026, reflecting significant downward pressure. DOT also reached its all-time low of $1.47 on February 1, 2026, indicating challenging market conditions for both assets.
-
Comparative Analysis: During the market cycle from 2021 to 2026, ZCX experienced a decline of approximately 99.96% from its all-time high of $7.03 to its current level, while DOT declined by approximately 97.18% from its peak of $54.98 to current trading levels near $1.55. Both assets have faced substantial corrections, though ZCX has experienced more severe depreciation relative to its peak valuation.
Current Market Status (February 1, 2026)
- ZCX Current Price: $0.002905
- DOT Current Price: $1.551
- 24-Hour Trading Volume: ZCX recorded $14,961.47, while DOT demonstrated significantly higher liquidity with $2,354,339.18 in trading volume.
- Market Sentiment Index (Fear & Greed Index): 14 (Extreme Fear)
View real-time prices:

II. Core Factors Influencing ZCX vs DOT Investment Value
Supply Mechanism Comparison (Tokenomics)
- ZCX: The supply mechanism details are not extensively documented in available materials, though general cryptocurrency market dynamics suggest supply-demand factors play a role in price movements.
- DOT: Specific supply mechanism information requires further research beyond the current materials.
- 📌 Historical Pattern: Supply mechanisms have historically influenced price cycles through scarcity dynamics and emission schedules, though specific patterns vary by asset.
Institutional Adoption and Market Applications
- Institutional Holdings: Current materials do not provide comparative data on institutional preference between ZCX and DOT.
- Enterprise Adoption: Application scenarios in cross-border payments, settlements, and investment portfolios require additional research for both assets.
- National Policies: Regulatory attitudes toward both assets vary across jurisdictions, with the regulatory environment playing a significant role in market dynamics.
Technological Development and Ecosystem Building
- ZCX Technology: Specific technical upgrades and their potential impacts are not detailed in the available materials.
- DOT Technology: Reference materials mention DOT's core value proposition focuses on shared security and interoperability, though detailed technical developments require further documentation.
- Ecosystem Comparison: Applications in DeFi, NFT, payments, and smart contract implementation need additional research for comprehensive comparison.
Macroeconomic Factors and Market Cycles
- Performance in Inflationary Environments: Comparative anti-inflation properties between the two assets require more comprehensive analysis.
- Macroeconomic Monetary Policy: Interest rates and dollar index movements can influence both assets, though specific impacts vary based on market conditions and investor sentiment.
- Geopolitical Factors: Cross-border transaction demand and international situations may affect adoption, with the cryptocurrency market showing sensitivity to regulatory environments and market sentiment.
III. 2026-2031 Price Prediction: ZCX vs DOT
Short-term Forecast (2026)
- ZCX: Conservative $0.0023-0.0030 | Optimistic $0.0030-0.0042
- DOT: Conservative $1.29-1.56 | Optimistic $1.56-2.30
Mid-term Forecast (2028-2029)
- ZCX may enter a consolidation phase with projected price range of $0.0025-0.0061
- DOT may enter a growth phase with projected price range of $1.68-2.82
- Key drivers: institutional capital inflows, ETF developments, ecosystem expansion
Long-term Forecast (2030-2031)
- ZCX: Baseline scenario $0.0039-0.0059 | Optimistic scenario $0.0053-0.0071
- DOT: Baseline scenario $2.06-3.20 | Optimistic scenario $3.04-3.91
View detailed price predictions for ZCX and DOT
Disclaimer
ZCX:
| Year |
Predicted High Price |
Predicted Average Price |
Predicted Low Price |
Price Change |
| 2026 |
0.0041776 |
0.002984 |
0.00232752 |
0 |
| 2027 |
0.004547616 |
0.0035808 |
0.00340176 |
18 |
| 2028 |
0.00475512336 |
0.004064208 |
0.00333265056 |
34 |
| 2029 |
0.0061294352952 |
0.00440966568 |
0.0024694127808 |
46 |
| 2030 |
0.006534242604624 |
0.0052695504876 |
0.004321031399832 |
74 |
| 2031 |
0.007082275855334 |
0.005901896546112 |
0.003895251720433 |
95 |
DOT:
| Year |
Predicted High Price |
Predicted Average Price |
Predicted Low Price |
Price Change |
| 2026 |
2.3014 |
1.555 |
1.29065 |
0 |
| 2027 |
2.738044 |
1.9282 |
1.041228 |
24 |
| 2028 |
2.61309664 |
2.333122 |
1.67984784 |
50 |
| 2029 |
2.8193446248 |
2.47310932 |
1.8301008968 |
59 |
| 2030 |
3.757642300808 |
2.6462269724 |
2.064057038472 |
70 |
| 2031 |
3.90636025665688 |
3.201934636604 |
3.0418379047738 |
106 |
IV. Investment Strategy Comparison: ZCX vs DOT
Long-term vs Short-term Investment Strategies
-
ZCX: May be suitable for investors with higher risk tolerance who are interested in exchange ecosystem tokens and early-stage opportunities within trading infrastructure platforms. The asset's current low price point and positioning within the Unizen Exchange ecosystem represent a speculative profile.
-
DOT: May appeal to investors seeking exposure to blockchain interoperability infrastructure and multi-chain ecosystem development. The asset's established market position and focus on connecting various blockchain networks may attract those interested in fundamental protocol-layer investments.
Risk Management and Asset Allocation
-
Conservative Investors: ZCX 5-10% vs DOT 15-25% allocation within the crypto portfolio segment, maintaining larger positions in more established assets and stablecoins for risk mitigation.
-
Aggressive Investors: ZCX 15-25% vs DOT 25-40% allocation, accepting higher volatility in exchange for potential upside exposure to both exchange infrastructure and interoperability protocols.
-
Hedging Tools: Stablecoin allocations for portfolio stability, options strategies for downside protection, cross-asset diversification across multiple crypto categories to manage correlation risks.
V. Potential Risk Comparison
Market Risks
-
ZCX: Lower liquidity with 24-hour trading volume of $14,961.47 may present challenges for position entry and exit. Significant price decline of approximately 99.96% from peak levels indicates substantial volatility exposure. Market sentiment showing extreme fear (Fear & Greed Index: 14) suggests challenging near-term conditions.
-
DOT: While demonstrating higher liquidity with $2,354,339.18 in daily trading volume, the asset has experienced approximately 97.18% decline from peak levels. Market dynamics remain influenced by broader cryptocurrency sector conditions and sentiment indicators showing extreme fear levels.
Technical Risks
-
ZCX: Scalability and network stability considerations require monitoring, particularly regarding the platform's reliance on Binance Cloud infrastructure. Exchange-based token dynamics may introduce platform-specific operational dependencies.
-
DOT: Network security, validator decentralization, and technical implementation of cross-chain interoperability features require ongoing assessment. Protocol-layer developments and upgrade implementation timelines may influence ecosystem growth.
Regulatory Risks
- Global regulatory frameworks continue evolving with varying approaches across jurisdictions. Exchange-based tokens like ZCX may face scrutiny related to trading platform regulations, while infrastructure protocols like DOT encounter considerations around decentralized network governance and cross-border transaction frameworks. Regulatory developments in major markets can significantly impact both assets, though specific impacts may differ based on classification and use cases.
VI. Conclusion: Which Is the Better Buy?
📌 Investment Value Summary:
-
ZCX Characteristics: Positioned within exchange infrastructure ecosystem, represents early-stage exposure to trading platform tokens, operates on Ethereum blockchain with connections to Binance Cloud infrastructure. Current low price point reflects substantial correction from historical levels.
-
DOT Characteristics: Established market position in blockchain interoperability space, focus on connecting various blockchain networks and enabling shared security models, represents protocol-layer infrastructure investment with multi-chain ecosystem potential.
✅ Investment Considerations:
-
Novice Investors: Consider starting with smaller allocations to either asset within a diversified portfolio approach, maintaining significant stablecoin positions for risk management. Focus on understanding fundamental differences between exchange tokens and protocol-layer infrastructure before committing capital.
-
Experienced Investors: May evaluate both assets based on portfolio diversification needs, with DOT potentially offering exposure to interoperability infrastructure and ZCX providing access to exchange ecosystem dynamics. Risk tolerance, liquidity requirements, and time horizon considerations should guide allocation decisions.
-
Institutional Investors: Conduct comprehensive due diligence on regulatory compliance frameworks, liquidity profiles, and custody solutions for either asset. Consider both assets' roles within broader portfolio construction strategies focused on blockchain infrastructure exposure.
⚠️ Risk Disclosure: The cryptocurrency market exhibits extreme volatility characteristics. This content does not constitute investment advice. Both assets have experienced substantial price corrections and operate in evolving regulatory environments. Market conditions, technological developments, and regulatory changes can significantly impact performance. Investors should conduct independent research and consider their risk tolerance, investment objectives, and financial circumstances before making investment decisions.
VII. FAQ
Q1: What is the current market capitalization difference between ZCX and DOT?
DOT maintains a significantly larger market capitalization compared to ZCX. As of February 1, 2026, DOT demonstrates substantially higher liquidity with a 24-hour trading volume of $2,354,339.18, while ZCX recorded only $14,961.47 in daily trading volume. This disparity reflects DOT's established position as a major blockchain interoperability protocol since its 2019 launch, compared to ZCX's more limited role as an exchange-based platform token within the Unizen Exchange ecosystem. The difference in trading volumes indicates varying levels of market adoption, investor interest, and liquidity profiles between the two assets.
Q2: How have ZCX and DOT performed from their all-time highs?
Both assets have experienced severe corrections from their peak valuations. ZCX declined approximately 99.96% from its all-time high of $7.03 (reached September 14, 2021) to its current price of $0.002905, while DOT fell approximately 97.18% from its peak of $54.98 (reached November 4, 2021) to its current trading level near $1.551. ZCX reached its historical low of $0.00251208 on January 18, 2026, and DOT hit its all-time low of $1.47 on February 1, 2026. These substantial declines reflect challenging market conditions affecting the broader cryptocurrency sector, with both assets experiencing significant downward pressure during the 2021-2026 market cycle.
Q3: What are the key technological differences between ZCX and DOT?
ZCX and DOT serve fundamentally different purposes within blockchain infrastructure. ZCX operates as a utility token within the Unizen Exchange ecosystem, running on the Ethereum blockchain and utilizing Binance Cloud's trading and security infrastructure, positioning it primarily as an exchange-based platform token. In contrast, DOT focuses on blockchain interoperability, connecting private chains, consortium chains, public chains, and open networks through its shared security model and multi-chain architecture. While ZCX's value proposition centers on trading platform utility and exchange ecosystem participation, DOT provides protocol-layer infrastructure enabling cross-chain communication and interoperability between different blockchain networks.
Q4: Which asset offers better liquidity for active traders?
DOT provides substantially superior liquidity for active trading. With a 24-hour trading volume of $2,354,339.18 compared to ZCX's $14,961.47, DOT offers significantly easier position entry and exit capabilities. This liquidity advantage reduces slippage risk, enables larger trade sizes without substantial price impact, and provides more consistent price discovery. The approximately 157x higher trading volume for DOT indicates greater market depth and participation, making it more suitable for traders requiring efficient execution and the ability to adjust positions quickly. ZCX's limited liquidity may present challenges for position management, particularly for larger allocations.
Q5: What are the predicted price ranges for ZCX and DOT through 2031?
According to available projections, ZCX may trade between $0.0023-0.0042 in the short term (2026), potentially reaching $0.0025-0.0061 during the mid-term period (2028-2029), with long-term forecasts (2030-2031) suggesting a baseline scenario of $0.0039-0.0059 and optimistic scenario of $0.0053-0.0071. For DOT, short-term predictions indicate $1.29-2.30 (2026), mid-term projections suggest $1.68-2.82 (2028-2029), and long-term forecasts point to a baseline scenario of $2.06-3.20 and optimistic scenario of $3.04-3.91 (2030-2031). These predictions assume continued ecosystem development, institutional adoption trends, and favorable market conditions, though actual performance may vary significantly based on regulatory developments, technological progress, and broader market dynamics.
Q6: How should investors allocate between ZCX and DOT based on risk tolerance?
Asset allocation should align with individual risk profiles and investment objectives. Conservative investors might consider ZCX at 5-10% and DOT at 15-25% of their cryptocurrency portfolio segment, maintaining larger positions in established assets and stablecoins for risk mitigation. Aggressive investors may allocate 15-25% to ZCX and 25-40% to DOT, accepting higher volatility for potential upside exposure. The allocation difference reflects DOT's established market position and higher liquidity compared to ZCX's more speculative profile as an exchange ecosystem token. Both assets exhibit substantial volatility, with the current Fear & Greed Index at 14 (Extreme Fear) indicating challenging near-term conditions. Investors should implement proper risk management through diversification across multiple crypto categories, stablecoin hedging positions, and sizing appropriate to their financial circumstances.
Q7: What regulatory considerations affect ZCX and DOT differently?
Exchange-based tokens like ZCX may face scrutiny related to trading platform regulations, securities classifications, and exchange operator compliance requirements across jurisdictions. The token's connection to Binance Cloud infrastructure introduces considerations around centralized exchange frameworks and platform-specific regulatory environments. DOT, as a protocol-layer infrastructure asset, encounters different regulatory considerations focused on decentralized network governance, cross-border transaction frameworks, and classification as utility versus security tokens. Both assets operate within evolving global regulatory frameworks with varying approaches across jurisdictions. Regulatory developments in major markets can significantly impact performance, though specific impacts differ based on each asset's classification, use cases, and operational structure.
Q8: Which asset is more suitable for institutional investors?
DOT may present more favorable characteristics for institutional allocation due to its higher liquidity profile, established market position, and protocol-layer infrastructure focus. The substantially higher daily trading volume ($2,354,339.18 versus $14,961.47) facilitates institutional-scale position management with reduced market impact. DOT's role in blockchain interoperability infrastructure may align with institutional thesis around foundational blockchain protocols. However, institutional investors must conduct comprehensive due diligence on regulatory compliance frameworks, custody solutions, and governance structures for either asset. ZCX's exchange ecosystem positioning and lower liquidity profile may present challenges for institutional deployment, though some institutions seeking exposure to exchange infrastructure tokens might consider smaller allocations within broader portfolio strategies focused on blockchain infrastructure diversification.
* The information is not intended to be and does not constitute financial advice or any other recommendation of any sort offered or endorsed by Gate.