This comprehensive comparison analyzes ZENT versus TRX, two distinctly positioned blockchain assets. ZENT, launched in 2024, operates as a Gaming Superlayer for the Play Economy, currently trading at $0.004332 with $13,815.82 daily volume. TRX, established since 2017, functions as decentralized blockchain infrastructure, trading at $0.29791 with $5.79M daily volume. The article examines historical price trends, tokenomics, institutional adoption, technological ecosystems, and risk profiles to guide investment decisions. TRX demonstrates superior liquidity and stability characteristics, suitable for conservative investors seeking established infrastructure exposure. ZENT offers higher growth potential but carries substantially greater volatility and early-stage project risks. Price forecasts through 2031 suggest varying growth trajectories based on institutional adoption and ecosystem expansion. Investment recommendations vary by experience level: beginners should prioritize TRX's 80-90% allocation, while expe
Introduction: Investment Comparison Between ZENT and TRX
In the cryptocurrency market, the comparison between ZENT vs TRX remains a topic that investors cannot overlook. Both exhibit notable differences in market cap ranking, application scenarios, and price performance, representing distinct positioning within the crypto asset landscape.
ZENT (ZENT): Launched in 2024, ZENT has garnered market attention through its positioning as a "Gaming Superlayer that brings MMORPG experience to real life, unifying the Play Economy across digital and physical realms."
TRX (TRX): Since its inception in 2017, TRX has been recognized as a "decentralized blockchain infrastructure platform," becoming one of the cryptocurrencies with significant global transaction volume and market capitalization.
This article will comprehensively analyze the investment value comparison between ZENT vs TRX, focusing on historical price trends, supply mechanisms, institutional adoption, technological ecosystems, and future projections, while attempting to address investors' most pressing question:
"Which is the better buy right now?"
I. Historical Price Comparison and Market Status
ZENT (Coin A) and TRX (Coin B) Historical Price Trends
- 2024: ZENT reached a peak price of $0.0454 on May 27, 2024, following its initial token launch in April 2024.
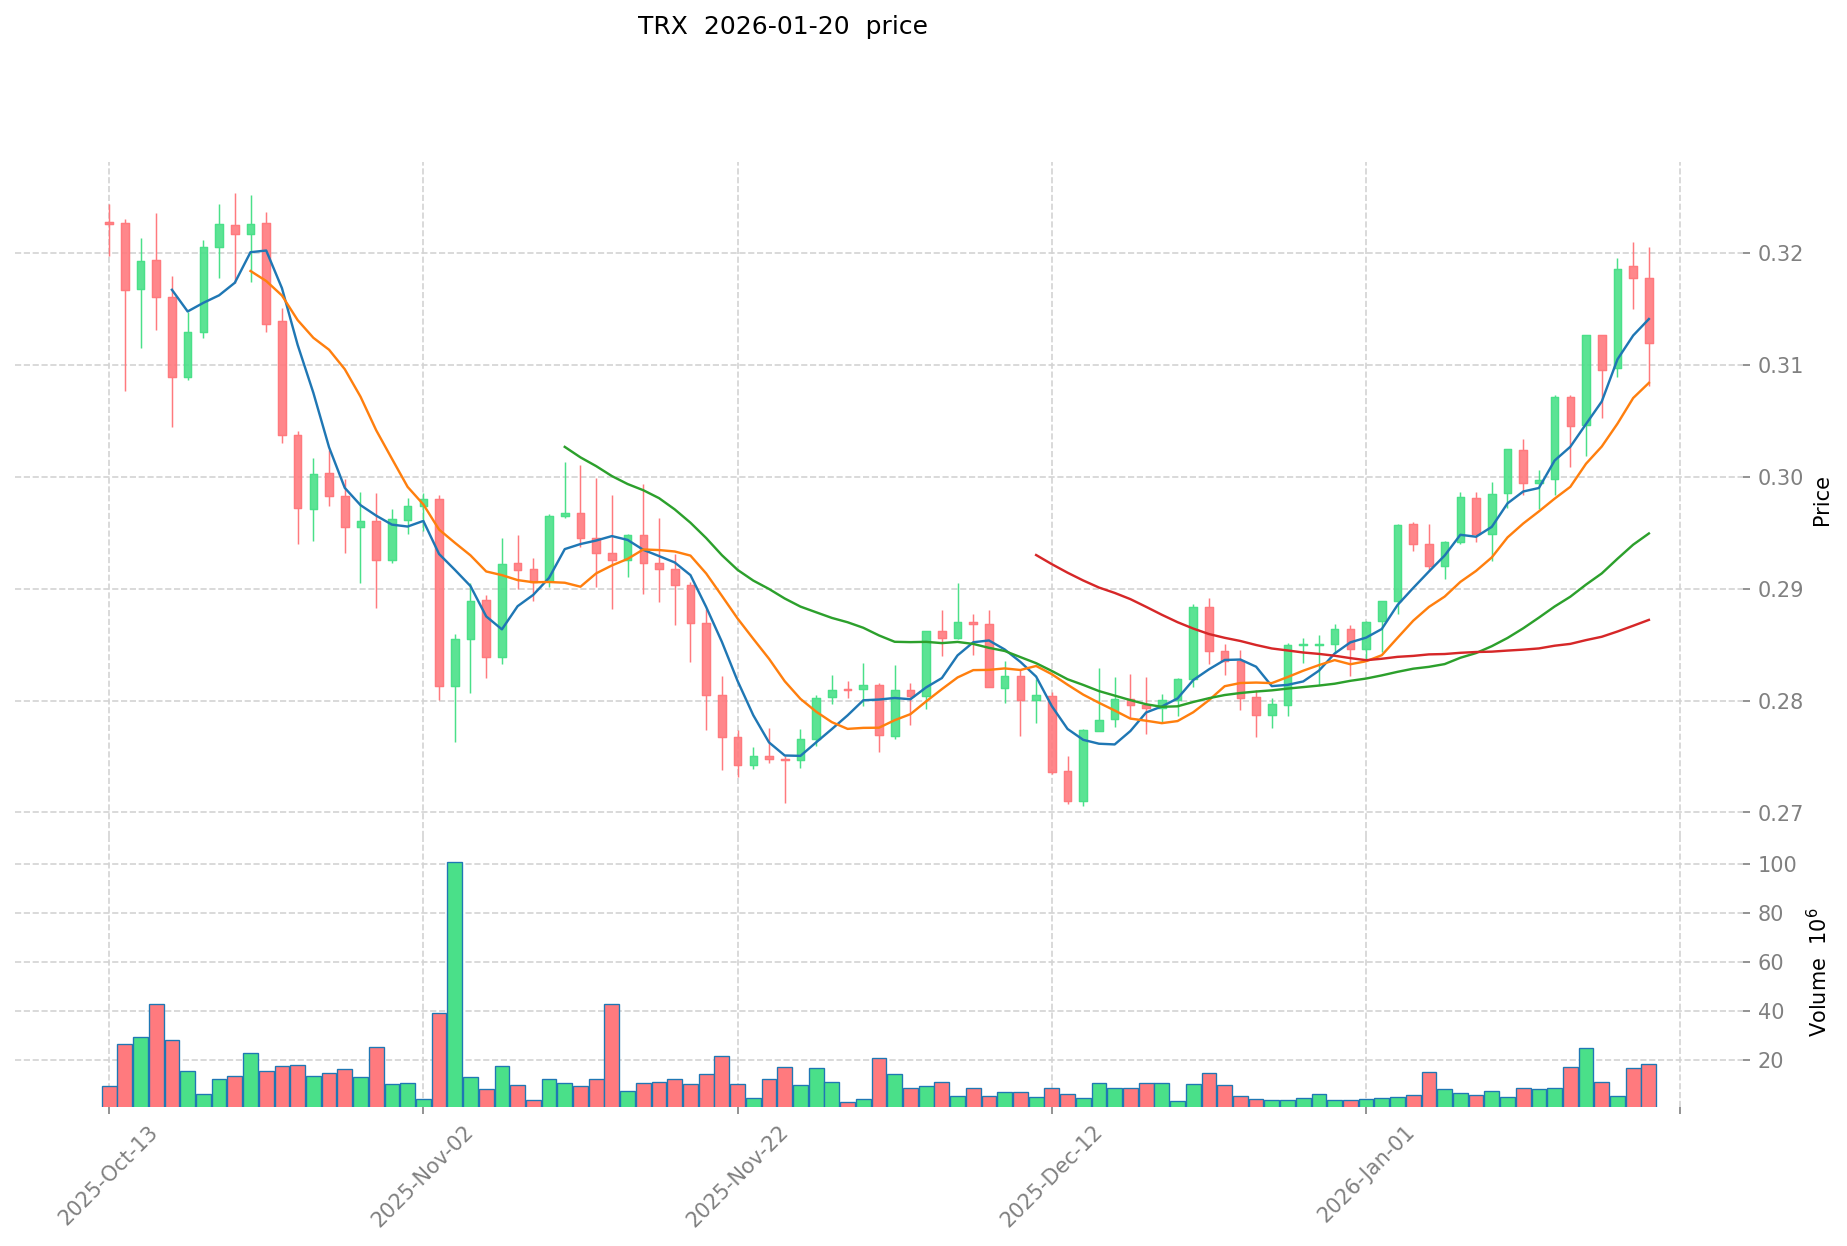
- 2024: TRX experienced significant price movement during December 2024, reaching an all-time high of $0.431288 on December 4, 2024, influenced by broader market dynamics.
- Comparative Analysis: During the recent market cycle, ZENT declined from its high of $0.0454 to a low of $0.003905 recorded on December 17, 2025, representing a substantial correction. In contrast, TRX demonstrated relative stability, maintaining price levels above $0.29 after its December 2024 peak.
Current Market Status (January 21, 2026)
- ZENT Current Price: $0.004332
- TRX Current Price: $0.29791
- 24-Hour Trading Volume: ZENT recorded $13,815.82 compared to TRX's $5,795,693.15
- Market Sentiment Index (Fear & Greed Index): 32 (Fear)
View Real-Time Prices:
- Check ZENT Current Price Market Price
- Check TRX Current Price Market Price

II. Core Factors Affecting ZENT vs TRX Investment Value
Supply Mechanism Comparison (Tokenomics)
Due to the absence of detailed tokenomics data in the available materials, a comprehensive comparison of supply mechanisms cannot be provided at this time.
Institutional Adoption and Market Applications
Without specific information regarding institutional holdings, enterprise adoption patterns, or regulatory positioning across different jurisdictions, a comparative analysis of institutional interest and market applications cannot be established.
Technology Development and Ecosystem Building
The reference materials do not contain sufficient information about technical upgrades, development roadmaps, or ecosystem metrics (including DeFi integration, NFT support, payment infrastructure, or smart contract implementations) for either asset.
Macroeconomic Environment and Market Cycles
In the absence of historical performance data under various macroeconomic conditions, comparative insights regarding inflation hedging properties, sensitivity to monetary policy changes, interest rate impacts, dollar index correlations, or geopolitical influence patterns cannot be substantiated.
III. 2026-2031 Price Forecast: ZENT vs TRX
Short-term Forecast (2026)
- ZENT: Conservative $0.003249 - $0.004332 | Optimistic $0.004332 - $0.00502512
- TRX: Conservative $0.2712255 - $0.29805 | Optimistic $0.29805 - $0.3487185
Mid-term Forecast (2028-2029)
- ZENT may enter a stabilization phase with projected price range of $0.00377091936 - $0.006265527552 in 2028, potentially reaching $0.003439 - $0.006878 by 2029
- TRX may experience growth momentum with estimated range of $0.3496915587375 - $0.5618639651625 in 2028, followed by $0.334171540119375 - $0.491709551889937 in 2029
- Key drivers: institutional capital flows, ETF developments, ecosystem expansion
Long-term Forecast (2030-2031)
- ZENT: Baseline scenario $0.004389953482137 - $0.00645581394432 (2030) | Optimistic scenario $0.00501455348125 - $0.010877723705481 (2031)
- TRX: Baseline scenario $0.247119853918277 - $0.484548733173093 (2030) | Optimistic scenario $0.502404353990522 - $0.671754136234518 (2031)
View detailed price predictions for ZENT and TRX
Disclaimer: Price forecasts are based on historical data analysis and market modeling. Cryptocurrency markets involve substantial risk and volatility. These projections should not be considered as investment advice. Users should conduct independent research and consult professional advisors before making investment decisions.
ZENT:
| Year |
Predicted High Price |
Predicted Average Price |
Predicted Low Price |
Price Change |
| 2026 |
0.00502512 |
0.004332 |
0.003249 |
0 |
| 2027 |
0.0069242688 |
0.00467856 |
0.0025264224 |
8 |
| 2028 |
0.006265527552 |
0.0058014144 |
0.00377091936 |
33 |
| 2029 |
0.00687815691264 |
0.006033470976 |
0.00343907845632 |
39 |
| 2030 |
0.008973581382604 |
0.00645581394432 |
0.004389953482137 |
49 |
| 2031 |
0.010877723705481 |
0.007714697663462 |
0.00501455348125 |
78 |
TRX:
| Year |
Predicted High Price |
Predicted Average Price |
Predicted Low Price |
Price Change |
| 2026 |
0.3487185 |
0.29805 |
0.2712255 |
0 |
| 2027 |
0.4624394775 |
0.32338425 |
0.252239715 |
8 |
| 2028 |
0.5618639651625 |
0.39291186375 |
0.3496915587375 |
31 |
| 2029 |
0.491709551889937 |
0.47738791445625 |
0.334171540119375 |
60 |
| 2030 |
0.644449815120214 |
0.484548733173093 |
0.247119853918277 |
62 |
| 2031 |
0.671754136234518 |
0.564499274146654 |
0.502404353990522 |
89 |
IV. Investment Strategy Comparison: ZENT vs TRX
Long-term vs Short-term Investment Strategies
- ZENT: May suit investors interested in emerging gaming ecosystem opportunities and higher risk tolerance for early-stage projects
- TRX: May suit investors seeking established blockchain infrastructure exposure with relatively lower volatility profiles
Risk Management and Asset Allocation
- Conservative Investors: ZENT 10-20% vs TRX 80-90%
- Aggressive Investors: ZENT 40-50% vs TRX 50-60%
- Hedging Instruments: Stablecoin allocation, options strategies, cross-asset portfolio diversification
V. Potential Risk Comparison
Market Risk
- ZENT: Experiences substantial price volatility, with historical price movements showing significant corrections from peak levels; limited trading volume of $13,815.82 may indicate lower liquidity
- TRX: Demonstrates relative price stability following recent peaks, with considerably higher trading volume of $5,795,693.15 providing better liquidity characteristics
Technical Risk
- ZENT: Scalability considerations and network stability factors associated with gaming-focused infrastructure
- TRX: Network decentralization metrics and security audit considerations
Regulatory Risk
- Global regulatory developments may impact both assets differently based on their respective use cases and jurisdictional presence
VI. Conclusion: Which Is the Better Buy?
📌 Investment Value Summary:
- ZENT Advantages: Positioning in the gaming and Play Economy sector; potential for growth in emerging market segments
- TRX Advantages: Established market presence since 2017; higher trading volume and liquidity; demonstrated price resilience in recent market conditions
✅ Investment Recommendations:
- Beginner Investors: Consider starting with TRX due to its established market position and higher liquidity, while limiting exposure to more volatile assets like ZENT
- Experienced Investors: May explore diversified allocation strategies incorporating both assets based on risk tolerance and market outlook
- Institutional Investors: Conduct thorough due diligence regarding liquidity requirements, regulatory compliance, and portfolio risk parameters before allocation decisions
⚠️ Risk Warning: Cryptocurrency markets exhibit extreme volatility. This article does not constitute investment advice.
VII. FAQ
Q1: What is the current price difference between ZENT and TRX?
As of January 21, 2026, ZENT is trading at $0.004332 while TRX is priced at $0.29791, representing approximately a 68x price differential. This substantial gap reflects their different market positions—TRX as an established blockchain infrastructure platform since 2017 with significantly higher liquidity ($5.79M in 24h volume), versus ZENT as an emerging gaming-focused project launched in 2024 with lower trading volume ($13,815.82 in 24h volume). The price difference also correlates with their respective market maturity, adoption levels, and trading liquidity profiles.
Q2: Which asset offers better risk-adjusted returns for long-term investment?
TRX generally presents lower volatility risk with established market presence and higher liquidity, making it more suitable for conservative long-term strategies. ZENT offers higher potential upside but carries substantially greater risk due to its early-stage status and demonstrated volatility—declining from $0.0454 in May 2024 to $0.003905 in December 2025. For balanced risk-adjusted returns, conservative portfolios might allocate 80-90% to TRX versus 10-20% to ZENT, while aggressive investors could consider 50-60% TRX and 40-50% ZENT allocations based on individual risk tolerance.
Q3: How do the 2030 price forecasts compare between ZENT and TRX?
The 2030 baseline forecast projects ZENT reaching $0.004389-$0.00645, representing approximately 1-49% growth from current levels, while TRX is estimated at $0.247-$0.484, indicating potential -17% to 62% variation from its current price. The optimistic 2031 scenario suggests ZENT could reach $0.010877 (151% increase from 2026) and TRX at $0.671754 (89% increase from 2026). However, these projections carry significant uncertainty—TRX's forecasts show wider absolute price ranges reflecting its higher base price, while ZENT's percentage growth potential appears higher due to its lower starting valuation and emerging market positioning.
Q4: What are the primary use cases distinguishing ZENT from TRX?
ZENT positions itself as a "Gaming Superlayer" focused on bringing MMORPG experiences to real life and unifying the Play Economy across digital and physical realms, targeting the gaming and entertainment sector. TRX operates as a "decentralized blockchain infrastructure platform" serving broader applications including decentralized applications, smart contracts, and transaction processing since 2017. This fundamental difference means ZENT's value proposition depends on gaming ecosystem adoption and Play Economy development, while TRX's utility spans multiple blockchain infrastructure use cases with established global transaction volume and enterprise applications.
Q5: Which asset demonstrates better liquidity characteristics?
TRX exhibits significantly superior liquidity with 24-hour trading volume of $5,795,693.15 compared to ZENT's $13,815.82—approximately 419 times higher. This substantial liquidity advantage means TRX investors can execute larger transactions with minimal price slippage, enjoy tighter bid-ask spreads, and experience lower transaction costs. ZENT's limited liquidity presents challenges for position entry/exit, particularly for larger investors, and may result in higher volatility and wider spreads. For investors prioritizing capital efficiency and portfolio flexibility, TRX's liquidity profile provides material advantages in trade execution and risk management.
Q6: How should beginners approach allocation between ZENT and TRX?
Beginner investors should prioritize TRX due to its established market presence, higher liquidity, and relatively lower volatility profile, potentially allocating 80-90% of crypto exposure to TRX while limiting ZENT to 10-20% if pursuing diversification. This conservative approach provides exposure to proven blockchain infrastructure while maintaining manageable risk levels. New investors should thoroughly understand that ZENT's gaming-focused positioning and limited trading history present higher uncertainty, requiring greater risk tolerance and longer investment horizons. Starting with smaller position sizes, implementing dollar-cost averaging, and maintaining adequate stablecoin reserves for risk management remain essential practices regardless of allocation choice.
Q7: What market conditions favor ZENT versus TRX performance?
ZENT may outperform during periods of strong growth in gaming sector adoption, metaverse expansion, and Play Economy development, particularly when investor risk appetite favors emerging technology narratives and smaller-cap opportunities. TRX typically demonstrates resilience during market uncertainty, regulatory developments affecting blockchain infrastructure, and periods when investors prioritize established assets with proven utility and liquidity. The current Fear & Greed Index reading of 32 (Fear) suggests market conditions may temporarily favor TRX's stability characteristics, though gaming sector catalysts could shift momentum toward ZENT if ecosystem adoption accelerates significantly.
Q8: What are the key risks specific to each asset?
ZENT faces concentrated risks including unproven gaming ecosystem adoption, limited trading liquidity creating potential exit challenges, substantial historical volatility (declining 91% from May 2024 peak), and execution risk related to delivering on its Play Economy vision. TRX carries different risk profiles including regulatory scrutiny affecting established blockchain platforms, competition from alternative Layer-1 infrastructure projects, network decentralization considerations, and potential correlation with broader cryptocurrency market downturns. Both assets remain subject to macroeconomic conditions, but ZENT's early-stage status amplifies project-specific risks while TRX's maturity introduces systematic crypto market exposure with relatively lower idiosyncratic volatility.
* The information is not intended to be and does not constitute financial advice or any other recommendation of any sort offered or endorsed by Gate.