This comprehensive analysis compares ZEUS Network and Tezos (XTZ) across multiple dimensions to guide investment decisions. ZEUS, launched in 2024, operates as a cross-chain communication layer bridging Bitcoin liquidity to Solana with emerging DeFi infrastructure positioning. XTZ, established in 2017, functions as a self-amending smart contract platform emphasizing on-chain governance and formal verification. The article examines historical price trends, current market status, tokenomics, institutional adoption, technical ecosystems, and risk profiles. As of January 2026, XTZ dominates with $620.79 million market capitalization versus ZEUS's $10.05 million, reflecting different risk-reward profiles. The analysis provides price predictions through 2031, investment strategies for different investor types, and essential considerations for portfolio allocation between these distinct blockchain platforms on Gate.
Introduction: Investment Comparison Between ZEUS and XTZ
In the cryptocurrency market, the comparison between ZEUS vs XTZ has become a topic of interest for investors. Both assets demonstrate notable differences in market capitalization ranking, application scenarios, and price performance, representing distinct positioning within the crypto asset landscape.
ZEUS Network (ZEUS): Launched in 2024, this project has gained recognition for its role as a cross-chain communication layer on SVM, with its primary mission to introduce Bitcoin liquidity to Solana through its first DApp, APOLLO.
Tezos (XTZ): Since its inception in 2017, Tezos has been recognized as a self-amending blockchain platform that emphasizes on-chain governance and formal verification, establishing itself as one of the established smart contract platforms in the industry.
This article will provide a comprehensive analysis of ZEUS vs XTZ investment value comparison, examining historical price trends, supply mechanisms, institutional adoption patterns, technical ecosystems, and future outlook. We aim to address investors' most pressing question:
"Which is the better buy right now?"
I. Historical Price Comparison and Current Market Status
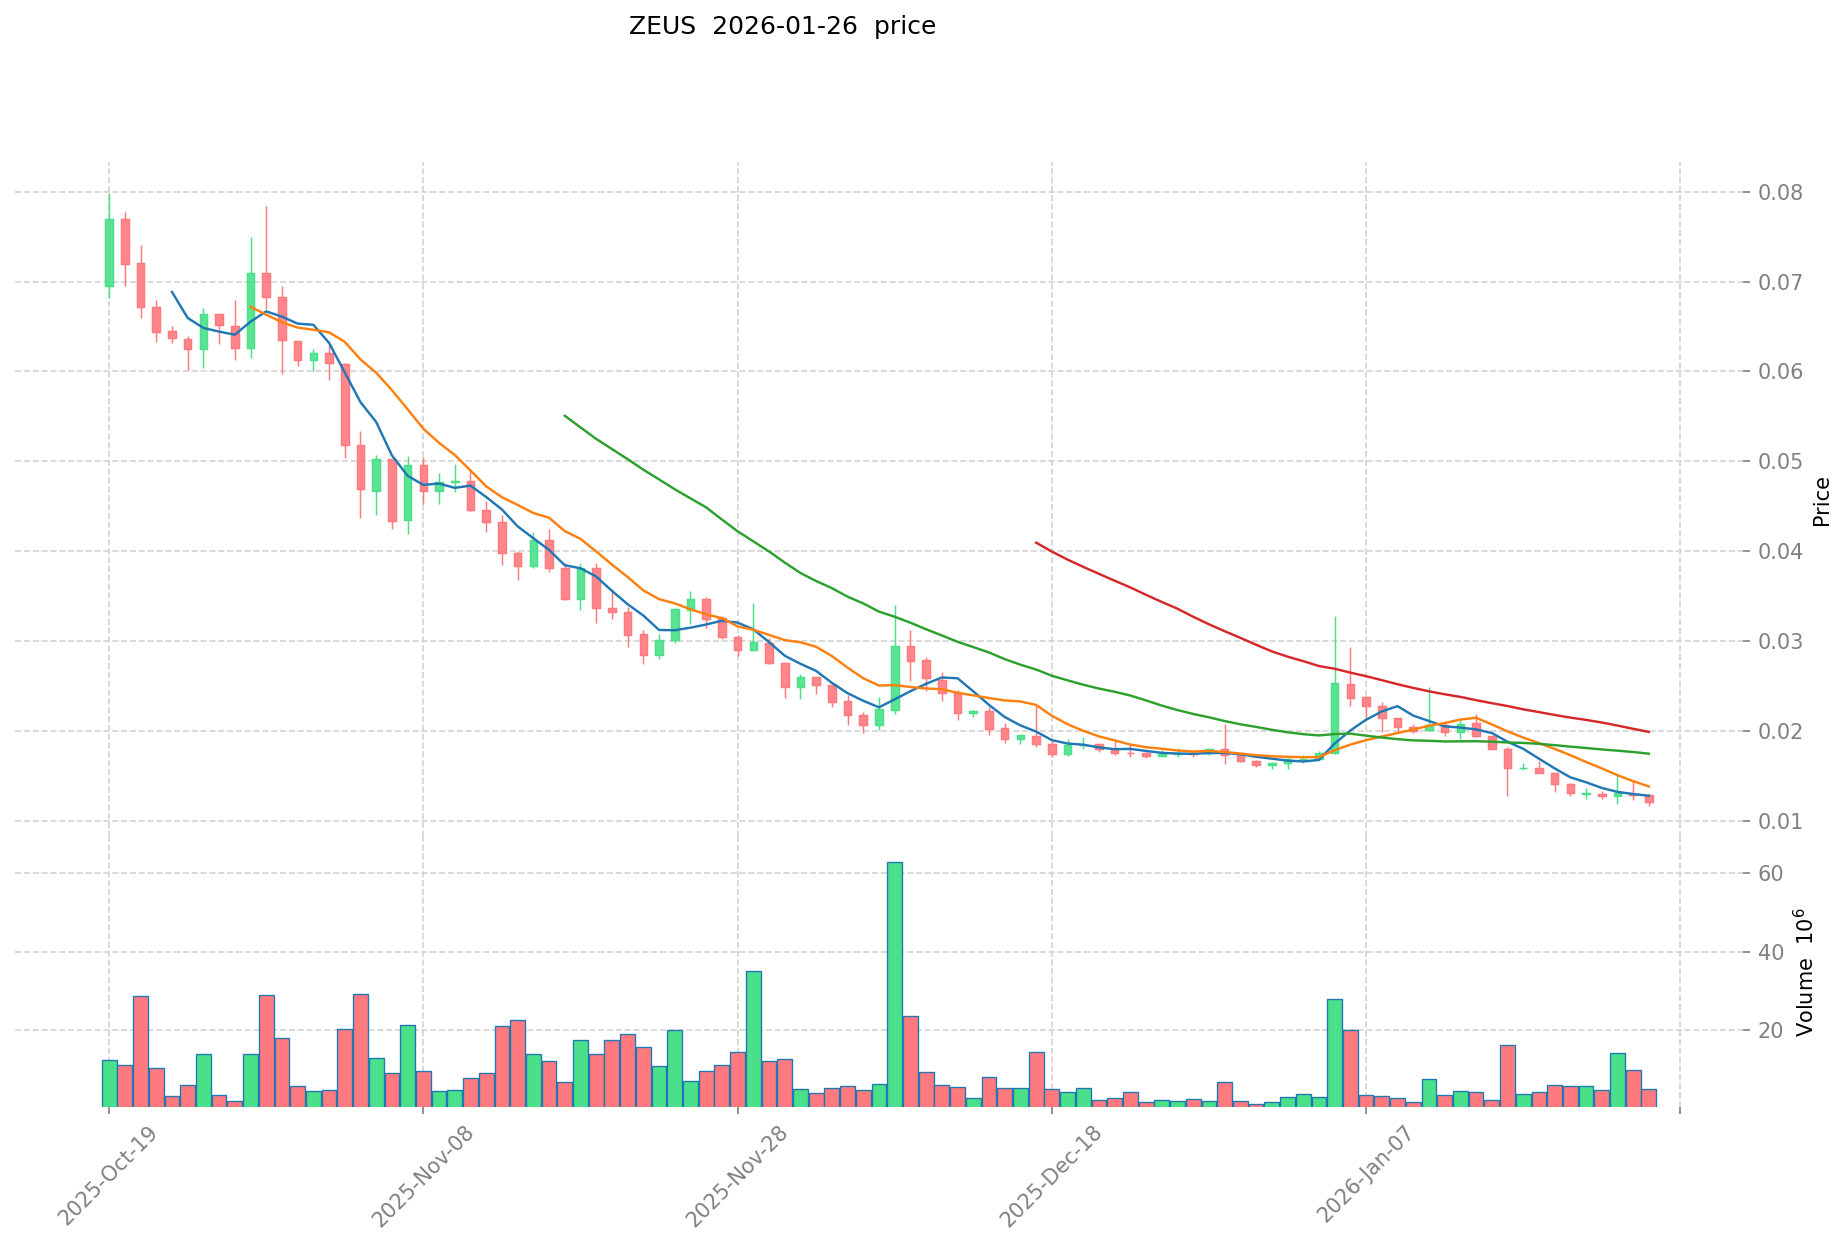
Zeus Network (ZEUS) and Tezos (XTZ) Historical Price Trends
- 2024: ZEUS reached its peak price of $1.1485 on April 8, 2024, demonstrating significant market interest during its early trading period.
- 2021: XTZ achieved its all-time high of $9.12 on October 4, 2021, coinciding with broader market momentum during that cycle.
- 2026: ZEUS recorded its all-time low of $0.01163 on January 25, 2026, reflecting recent market pressure.
- 2018: XTZ established its all-time low of $0.350476 on December 7, 2018, during an earlier market downturn.
- Comparative Analysis: ZEUS has experienced a decline of approximately 98.99% from its peak to its recent low, while XTZ has declined approximately 96.16% from its historical high to its historical low over a longer timeframe.
Current Market Status (January 26, 2026)
- ZEUS Current Price: $0.01206
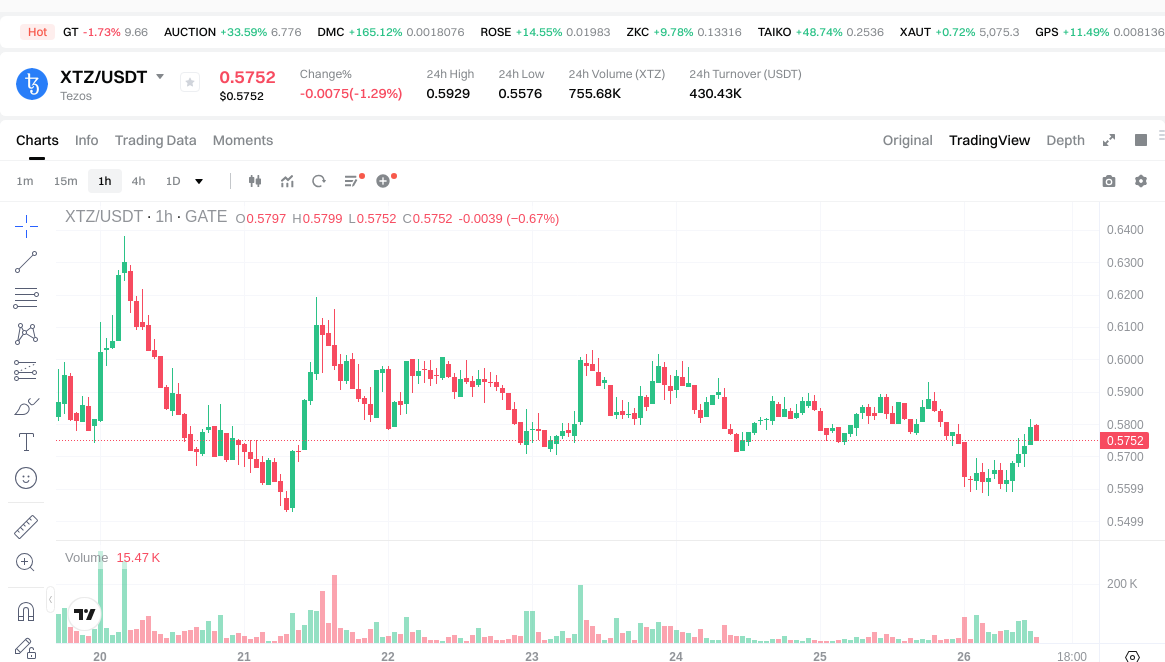
- XTZ Current Price: $0.5784
- 24-Hour Trading Volume: ZEUS at $58,582.68 compared to XTZ at $429,577.86
- 24-Hour Price Change: ZEUS decreased by 5.27%, while XTZ decreased by 1.07%
- Market Capitalization: ZEUS at approximately $10.05 million, XTZ at approximately $620.79 million
- Market Sentiment Index (Fear & Greed Index): 20 (Extreme Fear)
View real-time prices:
II. Core Factors Influencing ZEUS vs XTZ Investment Value
Supply Mechanism Comparison (Tokenomics)
Due to limited available data on the specific supply mechanisms of ZEUS and XTZ, a detailed comparison cannot be provided at this time. Investors should independently research the tokenomics of both assets, including total supply caps, emission schedules, and any deflationary or inflationary characteristics that may impact long-term value.
Institutional Adoption and Market Application
Comprehensive data regarding institutional holdings, enterprise adoption in cross-border payments or settlement systems, and specific national regulatory stances toward ZEUS and XTZ is not currently available. Market participants should monitor developments in institutional interest and regulatory frameworks as these factors can significantly influence adoption rates and market positioning.
Technical Development and Ecosystem Building
Without specific information on recent technical upgrades, protocol improvements, or ecosystem expansion for ZEUS and XTZ, a comparative analysis cannot be conducted. Key areas to monitor include developments in DeFi integration, NFT platforms, payment solutions, and smart contract functionality, as these elements often correlate with network growth and utility.
Macroeconomic Factors and Market Cycles
The relationship between ZEUS, XTZ, and broader macroeconomic conditions such as inflation trends, monetary policy adjustments, interest rate movements, and the U.S. Dollar Index requires further data for meaningful analysis. Additionally, the impact of geopolitical factors on cross-border transaction demand and international cryptocurrency flows remains an area requiring ongoing observation.
III. 2026-2031 Price Prediction: ZEUS vs XTZ
Short-term Prediction (2026)
- ZEUS: Conservative $0.0113-$0.0121 | Optimistic $0.0121-$0.0137
- XTZ: Conservative $0.474-$0.578 | Optimistic $0.578-$0.728
Mid-term Prediction (2028-2029)
- ZEUS may enter a gradual growth phase, with predicted price range of $0.0068-$0.0161 in 2028 and $0.0096-$0.0156 in 2029
- XTZ may enter an expansion phase, with predicted price range of $0.476-$0.952 in 2028 and $0.729-$1.001 in 2029
- Key drivers: institutional capital inflows, ETF developments, ecosystem expansion
Long-term Prediction (2030-2031)
- ZEUS: Baseline scenario $0.0098-$0.0169 | Optimistic scenario $0.0116-$0.0224
- XTZ: Baseline scenario $0.499-$1.114 | Optimistic scenario $0.757-$1.537
View detailed price predictions for ZEUS and XTZ
Disclaimer: Price predictions are based on historical data analysis and market trends. Actual prices may vary significantly due to market volatility, regulatory changes, technological developments, and other unpredictable factors. This information is for reference only and does not constitute investment advice.
ZEUS:
| Year |
Predicted High Price |
Predicted Average Price |
Predicted Low Price |
Price Change |
| 2026 |
0.0137484 |
0.01206 |
0.0113364 |
0 |
| 2027 |
0.013936536 |
0.0129042 |
0.00903294 |
7 |
| 2028 |
0.0161044416 |
0.013420368 |
0.00684438768 |
11 |
| 2029 |
0.015648149088 |
0.0147624048 |
0.00959556312 |
22 |
| 2030 |
0.01855043787168 |
0.015205276944 |
0.01155601047744 |
26 |
| 2031 |
0.022447550352427 |
0.01687785740784 |
0.009789157296547 |
39 |
XTZ:
| Year |
Predicted High Price |
Predicted Average Price |
Predicted Low Price |
Price Change |
| 2026 |
0.72765 |
0.5775 |
0.47355 |
0 |
| 2027 |
0.835296 |
0.652575 |
0.43722525 |
12 |
| 2028 |
0.95223744 |
0.7439355 |
0.47611872 |
28 |
| 2029 |
1.0007420346 |
0.84808647 |
0.7293543642 |
46 |
| 2030 |
1.303424095743 |
0.9244142523 |
0.499183696242 |
59 |
| 2031 |
1.53720846014967 |
1.1139191740215 |
0.75746503833462 |
92 |
IV. Investment Strategy Comparison: ZEUS vs XTZ
Long-term vs Short-term Investment Strategies
- ZEUS: May appeal to investors focused on emerging cross-chain infrastructure opportunities and early-stage DeFi ecosystems, particularly those interested in Bitcoin-Solana interoperability developments
- XTZ: May appeal to investors seeking exposure to established smart contract platforms with on-chain governance mechanisms and formal verification capabilities
Risk Management and Asset Allocation
- Conservative Investors: ZEUS 10-15% vs XTZ 85-90%
- Aggressive Investors: ZEUS 30-40% vs XTZ 60-70%
- Hedging Tools: stablecoin allocation, options strategies, cross-asset portfolio diversification
V. Potential Risk Comparison
Market Risk
- ZEUS: High volatility characteristics with limited trading volume ($58,582.68 in 24-hour volume) and relatively small market capitalization ($10.05 million), which may result in significant price fluctuations and liquidity constraints
- XTZ: Moderate volatility with higher liquidity profile ($429,577.86 in 24-hour volume) and established market presence ($620.79 million market capitalization), though still subject to broader crypto market cycles
Technical Risk
- ZEUS: Network scalability considerations, protocol maturity assessment, dependency on cross-chain bridge security
- XTZ: On-chain upgrade execution risks, network participation rates, smart contract platform competition
Regulatory Risk
- Global regulatory frameworks may impact both assets differently based on their classification, use cases, and jurisdictional presence. Cross-chain protocols and established smart contract platforms face distinct compliance considerations across various regulatory environments.
VI. Conclusion: Which Is the Better Buy?
📌 Investment Value Summary:
- ZEUS Characteristics: Early-stage cross-chain infrastructure positioning with Bitcoin-Solana bridge functionality, representing higher risk-reward potential in the emerging interoperability sector
- XTZ Characteristics: Established smart contract platform with on-chain governance model, formal verification capabilities, and longer operational history in the blockchain ecosystem
✅ Investment Considerations:
- Novice Investors: Consider starting with more established assets featuring higher liquidity and market capitalization, while maintaining modest exposure to emerging projects after thorough research
- Experienced Investors: Evaluate portfolio diversification across different market cap segments and technical categories, balancing established platforms with selective exposure to infrastructure development projects
- Institutional Investors: Assess regulatory clarity, custody solutions, liquidity requirements, and alignment with institutional investment mandates when considering allocation between established and emerging crypto assets
⚠️ Risk Disclosure: Cryptocurrency markets demonstrate high volatility. This content does not constitute investment advice.
VII. FAQ
Q1: What is the main difference between ZEUS Network and Tezos in terms of their core functionality?
ZEUS Network operates as a cross-chain communication layer focused on bridging Bitcoin liquidity to Solana, while Tezos functions as a self-amending smart contract platform emphasizing on-chain governance. ZEUS represents emerging infrastructure in the interoperability sector, launched in 2024 with its primary DApp APOLLO facilitating cross-chain transactions. Tezos, established in 2017, positions itself as a general-purpose blockchain platform with formal verification capabilities and an upgrade mechanism that allows protocol evolution through stakeholder consensus rather than hard forks.
Q2: Which asset has demonstrated better price stability historically?
XTZ has demonstrated relatively better price stability compared to ZEUS, though both assets have experienced significant volatility. ZEUS has declined approximately 98.99% from its April 2024 peak of $1.1485 to its January 2026 low of $0.01163, while XTZ declined approximately 96.16% from its October 2021 high of $9.12 to its December 2018 low of $0.350476. As of January 26, 2026, XTZ's 24-hour price change was -1.07% compared to ZEUS's -5.27%, indicating lower short-term volatility for the more established asset.
Q3: How do the market capitalizations of ZEUS and XTZ compare?
XTZ maintains a significantly larger market capitalization at approximately $620.79 million compared to ZEUS's $10.05 million as of January 26, 2026. This represents roughly a 61-fold difference in market size. The disparity reflects XTZ's longer operational history since 2017, broader institutional recognition, and more extensive adoption compared to ZEUS's recent launch in 2024. The larger market cap generally correlates with higher liquidity, as evidenced by XTZ's 24-hour trading volume of $429,577.86 versus ZEUS's $58,582.68.
Q4: What are the projected price ranges for ZEUS and XTZ by 2031?
According to baseline predictions, ZEUS is projected to reach a range of $0.0098-$0.0169 by 2031, with an optimistic scenario extending to $0.0116-$0.0224. XTZ is projected to reach $0.499-$1.114 in the baseline scenario and $0.757-$1.537 in the optimistic scenario by 2031. These projections suggest XTZ may experience cumulative growth of approximately 92% from current levels, while ZEUS could see growth of approximately 39% in the baseline case. However, these predictions are subject to significant uncertainty based on market conditions, technological developments, and regulatory factors.
Q5: Which asset presents higher risk for investors?
ZEUS presents higher overall risk compared to XTZ based on several quantifiable factors. ZEUS's market capitalization of $10.05 million and 24-hour trading volume of $58,582.68 indicate limited liquidity and potential for significant price slippage. The asset's 98.99% decline from peak demonstrates extreme volatility characteristics. Additionally, as an early-stage project launched in 2024, ZEUS faces technical execution risks related to cross-chain bridge security and protocol maturity. XTZ, while still volatile, benefits from a larger market cap, higher liquidity, and seven years of operational history, resulting in relatively lower risk profile.
Q6: What portfolio allocation strategy is recommended for conservative versus aggressive investors?
Conservative investors should consider a ZEUS allocation of 10-15% with XTZ comprising 85-90% of the portfolio allocation between these two assets. This approach prioritizes the more established platform with higher liquidity while maintaining limited exposure to emerging infrastructure opportunities. Aggressive investors may consider increasing ZEUS allocation to 30-40% while maintaining XTZ at 60-70%, accepting higher volatility in exchange for potential growth from early-stage cross-chain technology. Both strategies should incorporate additional risk management tools including stablecoin reserves, options hedging, and diversification across other crypto assets beyond these two projects.
Q7: How does the current market sentiment impact investment decisions for ZEUS versus XTZ?
The current Fear & Greed Index reading of 20 (Extreme Fear) as of January 26, 2026, suggests market-wide pessimism that affects both assets but potentially creates different opportunities. In extreme fear conditions, established assets like XTZ may offer more predictable recovery patterns based on historical cycles, while early-stage projects like ZEUS face heightened risk of prolonged underperformance. However, extreme fear periods historically precede market bottoms, potentially presenting accumulation opportunities for risk-tolerant investors. The 24-hour performance showing ZEUS down 5.27% versus XTZ down 1.07% indicates that smaller-cap assets experience amplified volatility during fearful market conditions, reinforcing the importance of position sizing appropriate to individual risk tolerance.
Q8: What key factors should investors monitor when deciding between ZEUS and XTZ?
Investors should monitor several critical factors when evaluating ZEUS versus XTZ. For ZEUS, track developments in cross-chain bridge security, Bitcoin-Solana ecosystem growth, APOLLO DApp adoption metrics, and trading volume trends that indicate growing market interest. For XTZ, monitor on-chain governance participation rates, smart contract platform competition, developer activity, and institutional adoption patterns. Both assets require attention to regulatory developments affecting cross-chain protocols and smart contract platforms respectively. Additionally, macroeconomic factors including monetary policy, inflation trends, and institutional capital flows into cryptocurrency markets will impact both assets, though likely with different magnitudes based on their respective market capitalizations and liquidity profiles.
* The information is not intended to be and does not constitute financial advice or any other recommendation of any sort offered or endorsed by Gate.