This comprehensive guide compares ZKJ (Polyhedra Network) and KAVA, two emerging blockchain platforms with distinct positioning. ZKJ, launched March 2024, focuses on zero-knowledge proof infrastructure for Web3 interoperability, currently trading at $0.03567 with higher trading volumes. KAVA, established October 2019, operates as a cross-chain DeFi platform offering lending and stablecoin services, trading at $0.08088. The article analyzes historical price trends, market status, investment strategies, and risk factors to help investors evaluate which asset suits their portfolio. Current forecasts suggest KAVA may maintain higher absolute prices through 2031, while ZKJ presents higher growth potential for aggressive investors. Presented on Gate, this analysis addresses critical investment considerations for both conservative and experienced traders navigating extreme market fear conditions.
Introduction: Investment Comparison Between ZKJ and KAVA
In the cryptocurrency market, the comparison between ZKJ vs KAVA has become a topic of interest for investors. Both assets exhibit distinct differences in market capitalization rankings, application scenarios, and price performance, representing different positioning within the crypto asset landscape.
ZKJ (Polyhedra Network): Launched in March 2024, it has gained market recognition through its focus on providing zero-knowledge proof infrastructure for Web3 interoperability.
KAVA: Introduced in October 2019, it has established itself as a cross-chain DeFi platform offering lending and stablecoin services for mainstream digital assets.
This article will provide a comprehensive analysis of the investment value comparison between ZKJ vs KAVA, covering historical price trends, supply mechanisms, institutional adoption, technical ecosystems, and future forecasts, attempting to address the question that investors care about most:
"Which is the better buy right now?"
I. Historical Price Comparison and Current Market Status
ZKJ (Coin A) and KAVA (Coin B) Historical Price Trends
- 2024: ZKJ reached a notable price level of $100 on March 19, 2024, marking a significant peak in its trading history.
- 2021: KAVA experienced substantial price movement, reaching $9.12 on August 30, 2021, during a period of heightened market activity.
- Comparative Analysis: During the market cycle from 2024 to 2026, ZKJ declined from $100 to a low of $0.02323 recorded on October 10, 2025, while KAVA showed a different pattern, moving from $9.12 to $0.071579 on December 19, 2025.
Current Market Status (2026-01-24)
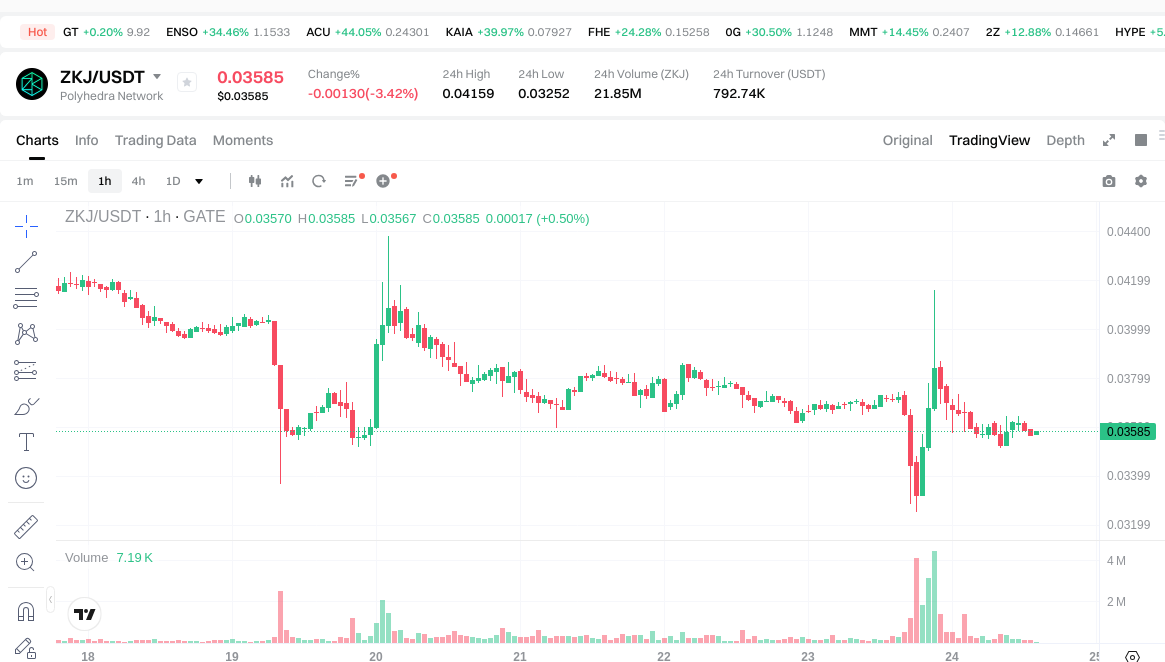
- ZKJ Current Price: $0.03567
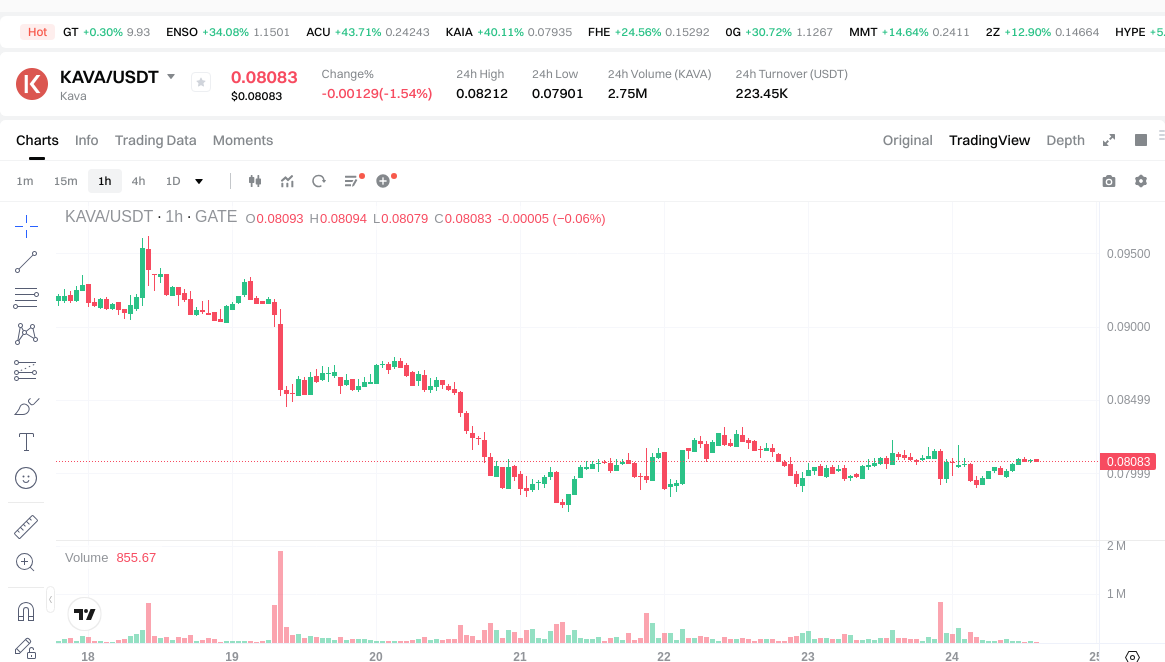
- KAVA Current Price: $0.08088
- 24-Hour Trading Volume: ZKJ $792,838.08 vs KAVA $232,584.79
- Market Sentiment Index (Fear & Greed Index): 25 (Extreme Fear)
View real-time prices:
II. Core Factors Affecting ZKJ vs KAVA Investment Value
Due to the absence of reference materials and insufficient information in the knowledge base regarding ZKJ and KAVA's tokenomics, institutional adoption, technical developments, and macroeconomic performance, this section cannot be completed with reliable data. A comprehensive analysis requires access to verified information about both projects' supply mechanisms, market applications, technological roadmaps, and historical performance metrics.
III. 2026-2031 Price Forecast: ZKJ vs KAVA
Short-term Forecast (2026)
- ZKJ: Conservative $0.022196 - $0.0358 | Optimistic $0.0358 - $0.041886
- KAVA: Conservative $0.0638557 - $0.08083 | Optimistic $0.08083 - $0.0978043
Mid-term Forecast (2028-2029)
- ZKJ may enter a gradual expansion phase, with estimated prices ranging from $0.02211137775 to $0.056283507 in 2028, potentially reaching $0.03569982444 to $0.05982132744 by 2029
- KAVA may enter a growth consolidation phase, with estimated prices ranging from $0.0650005559125 to $0.1254236078875 in 2028, potentially reaching $0.080280264055875 to $0.12584473824975 by 2029
- Key drivers: institutional capital flows, ETF developments, ecosystem expansion
Long-term Forecast (2030-2031)
- ZKJ: Baseline scenario $0.0383628383712 - $0.05403216672 (2030) | Optimistic scenario $0.036666228336192 - $0.068907222218016 (2031)
- KAVA: Baseline scenario $0.099590922166612 - $0.11716579078425 (2030) | Optimistic scenario $0.109069634641058 - $0.137904135753062 (2031)
View detailed price predictions for ZKJ and KAVA
Disclaimer
ZKJ:
| Year |
Predicted High Price |
Predicted Average Price |
Predicted Low Price |
Price Change |
| 2026 |
0.041886 |
0.0358 |
0.022196 |
0 |
| 2027 |
0.04156201 |
0.038843 |
0.02835539 |
8 |
| 2028 |
0.056283507 |
0.040202505 |
0.02211137775 |
12 |
| 2029 |
0.05982132744 |
0.048243006 |
0.03569982444 |
35 |
| 2030 |
0.0724031034048 |
0.05403216672 |
0.0383628383712 |
51 |
| 2031 |
0.068907222218016 |
0.0632176350624 |
0.036666228336192 |
77 |
KAVA:
| Year |
Predicted High Price |
Predicted Average Price |
Predicted Low Price |
Price Change |
| 2026 |
0.0978043 |
0.08083 |
0.0638557 |
0 |
| 2027 |
0.0937830075 |
0.08931715 |
0.0491244325 |
10 |
| 2028 |
0.1254236078875 |
0.09155007875 |
0.0650005559125 |
13 |
| 2029 |
0.12584473824975 |
0.10848684331875 |
0.080280264055875 |
34 |
| 2030 |
0.133569001494045 |
0.11716579078425 |
0.099590922166612 |
44 |
| 2031 |
0.137904135753062 |
0.125367396139147 |
0.109069634641058 |
55 |
IV. Investment Strategy Comparison: ZKJ vs KAVA
Long-term vs Short-term Investment Strategies
- ZKJ: May appeal to investors focused on zero-knowledge proof infrastructure and Web3 interoperability applications, particularly those with higher risk tolerance seeking early-stage technology platforms
- KAVA: May suit investors interested in cross-chain DeFi platforms with established lending and stablecoin services, potentially appealing to those seeking relatively more mature ecosystem exposure
Risk Management and Asset Allocation
- Conservative Investors: ZKJ 20-30% vs KAVA 70-80%
- Aggressive Investors: ZKJ 50-60% vs KAVA 40-50%
- Hedging Tools: Stablecoin allocation, options strategies, cross-asset portfolio diversification
V. Potential Risk Comparison
Market Risk
- ZKJ: Exhibits high volatility with a historical price decline from $100 (March 2024) to $0.02323 (October 2025), demonstrating significant price fluctuation potential. Current 24-hour trading volume of $792,838.08 may indicate liquidity considerations
- KAVA: Shows price movement from $9.12 (August 2021) to $0.071579 (December 2025), with current 24-hour trading volume of $232,584.79 potentially reflecting market activity levels
Technical Risk
- ZKJ: Scalability considerations and network stability factors related to zero-knowledge proof infrastructure deployment
- KAVA: Cross-chain protocol security, smart contract vulnerabilities, and platform stability considerations in DeFi operations
Regulatory Risk
- Global regulatory developments may impact both assets differently based on their functional classifications: ZKJ as infrastructure technology and KAVA as DeFi lending platform
VI. Conclusion: Which Is the Better Buy?
📌 Investment Value Summary:
- ZKJ Characteristics: Focuses on zero-knowledge proof infrastructure for Web3 interoperability, launched in March 2024, current price $0.03567 with higher trading volume
- KAVA Characteristics: Established cross-chain DeFi platform since October 2019 offering lending and stablecoin services, current price $0.08088
✅ Investment Considerations:
- Novice Investors: Consider starting with smaller allocations and thorough research into both projects' fundamentals, technological roadmaps, and ecosystem developments
- Experienced Investors: May evaluate portfolio diversification strategies combining both assets based on individual risk tolerance and market outlook, while monitoring technical developments and adoption metrics
- Institutional Investors: Could assess both assets within broader portfolio construction frameworks, considering liquidity profiles, regulatory landscape, and long-term technological trends in zero-knowledge proofs and DeFi sectors
⚠️ Risk Disclosure: Cryptocurrency markets demonstrate high volatility characteristics. Current market sentiment reflects extreme fear levels (Fear & Greed Index: 25). This content does not constitute investment advice. Investors should conduct independent research and consider professional consultation before making investment decisions.
VII. FAQ
Q1: What are the main differences between ZKJ and KAVA's core technologies?
ZKJ focuses on zero-knowledge proof infrastructure for Web3 interoperability, while KAVA operates as a cross-chain DeFi platform. ZKJ's technology enables privacy-preserving verification and cross-chain communication through zkProof systems, positioning it as an infrastructure layer project launched in March 2024. KAVA, established in October 2019, provides lending services and stablecoin functionality across multiple blockchain networks, making it a DeFi application platform rather than a base-layer infrastructure provider.
Q2: Which asset has shown better price stability historically?
Neither asset demonstrates strong price stability, though KAVA shows relatively less extreme volatility. ZKJ experienced a dramatic decline from $100 (March 2024) to $0.02323 (October 2025), representing approximately 99.98% decrease. KAVA declined from $9.12 (August 2021) to $0.071579 (December 2025), approximately 99.22% decrease. However, KAVA's longer operational history since 2019 versus ZKJ's 2024 launch means KAVA has weathered multiple market cycles, potentially indicating more established price discovery mechanisms.
Q3: How do the current trading volumes compare between ZKJ and KAVA?
ZKJ demonstrates higher 24-hour trading volume at $792,838.08 compared to KAVA's $232,584.79 as of January 24, 2026. This represents approximately 3.4x higher trading activity for ZKJ, which may indicate stronger current market interest or liquidity conditions. However, trading volume alone does not guarantee better investment outcomes and should be considered alongside other factors such as market capitalization, holder distribution, and exchange listing presence.
Q4: What are the projected price ranges for both assets in 2028?
According to forecast models, ZKJ's 2028 price range spans from a conservative low of $0.02211137775 to an optimistic high of $0.056283507, with an average estimate of $0.040202505. KAVA's 2028 projections range from $0.0650005559125 (low) to $0.1254236078875 (high), with an average of $0.09155007875. These forecasts suggest KAVA may maintain a higher absolute price level, though percentage gains relative to current prices should be evaluated based on individual investment entry points and risk tolerance.
Q5: Which asset is more suitable for conservative investors?
KAVA may be more appropriate for conservative investors based on several factors: longer operational history since 2019, established DeFi use cases with lending and stablecoin services, and relatively less extreme historical volatility compared to ZKJ. Conservative allocation strategies suggest 70-80% KAVA versus 20-30% ZKJ for risk-averse portfolios. However, both assets remain high-risk cryptocurrency investments, and conservative investors should consider whether cryptocurrency exposure aligns with their overall financial objectives and risk capacity.
Q6: What are the primary risks unique to each project?
ZKJ faces infrastructure-specific risks including zero-knowledge proof technology scalability challenges, network stability concerns, and adoption uncertainty given its recent 2024 launch. Competition from established zkProof platforms and technical implementation complexity represent additional considerations. KAVA's unique risks center on DeFi operations: cross-chain protocol security vulnerabilities, smart contract exploits, lending protocol liquidity risks, and potential regulatory scrutiny of decentralized financial services. Both projects face general cryptocurrency market risks including regulatory changes, macroeconomic factors, and market sentiment shifts.
Q7: How does the current market sentiment affect investment decisions for ZKJ vs KAVA?
The current Fear & Greed Index of 25 (Extreme Fear) indicates widespread market pessimism as of January 24, 2026. This environment typically presents potential accumulation opportunities for long-term investors but requires careful risk assessment. For ZKJ, extreme fear may amplify volatility given its shorter trading history and infrastructure focus. KAVA's established DeFi ecosystem might provide somewhat more stability during fearful markets, though DeFi tokens often experience significant pressure during risk-off periods. Investors should avoid emotional decision-making and maintain disciplined position sizing regardless of market sentiment extremes.
Q8: What allocation strategy should experienced traders consider?
Experienced investors may consider a 50-60% ZKJ versus 40-50% KAVA allocation for aggressive positioning, based on higher risk tolerance and active portfolio management capabilities. This strategy assumes conviction in zero-knowledge proof infrastructure growth potential while maintaining exposure to established DeFi utility. Key implementation considerations include: regular rebalancing based on relative performance, utilizing stablecoin reserves for opportunistic additions during volatility, implementing stop-loss disciplines, monitoring technical developments and adoption metrics, and maintaining diversification beyond these two assets within broader cryptocurrency portfolios.
* The information is not intended to be and does not constitute financial advice or any other recommendation of any sort offered or endorsed by Gate.