This comprehensive analysis compares ZOON and ENJ, two prominent blockchain gaming tokens with distinctly different market positions. ZOON, launched in August 2021 on Binance Smart Chain, serves as CryptoZoon's native currency for Pokemon-inspired gameplay, currently trading at $0.0005765 with a $470,791 market cap. ENJ, established since November 2017 as Enjin Coin, operates as gaming infrastructure supporting 18.7 million players, trading at $0.02206 with a $42.6 million market cap. The article examines critical investment dimensions including historical price performance showing both tokens declined over 99% from 2021 peaks, tokenomics mechanisms, institutional adoption patterns, ecosystem development, and five-year price predictions through 2031. Risk analysis reveals ZOON's extreme volatility and minimal liquidity versus ENJ's relative stability and higher trading volume. Investment strategy recommendations differentiate between conservative, aggressive, and institutional investor profiles, while compreh
Introduction: ZOON vs ENJ Investment Comparison
In the cryptocurrency market, the comparison between ZOON and ENJ remains a topic of significant interest for investors. Both assets demonstrate notable differences in market capitalization ranking, application scenarios, and price performance, representing distinct positioning within the crypto asset landscape.
ZOON: Launched in August 2021, this token serves as the native currency of CryptoZoon, a digital creature universe platform operating on Binance Smart Chain. Inspired by Pokemon-style gameplay, it aims to provide accessible entry into the NFT and blockchain gaming ecosystem.
ENJ: Since its launch in November 2017, Enjin Coin has established itself as a prominent player in the blockchain gaming infrastructure space. Built on a platform serving over 18.7 million registered players across 250,000 gaming communities, ENJ enables creators and developers to tokenize virtual goods and add blockchain-based value to gaming experiences.
This article will examine the investment value comparison between ZOON and ENJ through multiple dimensions, including historical price trends, supply mechanisms, institutional adoption patterns, technological ecosystems, and future outlook. We aim to provide analytical insights addressing the question investors frequently consider:
"Which asset presents more compelling investment characteristics at the current market juncture?"
As of February 6, 2026, ZOON trades at $0.0005765 with a market capitalization of approximately $470,791, while ENJ is priced at $0.02206 with a market cap of around $42.6 million. The substantial disparity in market positioning, trading volumes, and ecosystem maturity between these two gaming-focused tokens warrants comprehensive examination for informed investment consideration.
I. Historical Price Comparison and Current Market Status
Historical Price Trends of ZOON (Coin A) and ENJ (Coin B)
- 2021: ZOON reached its all-time high of $0.089014 on August 25, 2021, during the broader crypto market bull run.
- 2021: ENJ achieved its all-time high of $4.82 on November 25, 2021, benefiting from growing interest in NFT gaming platforms.
- Comparative Analysis: During the market cycle from 2021 to 2025, ZOON declined from $0.089014 to a historical low of $0.00020221 (recorded on December 4, 2025), representing a significant contraction. ENJ experienced a similar downward trajectory, falling from $4.82 to a historical low of $0.01865964 (recorded on November 12, 2017, though recent data suggests continued pressure in the current cycle).
Current Market Situation (February 6, 2026)
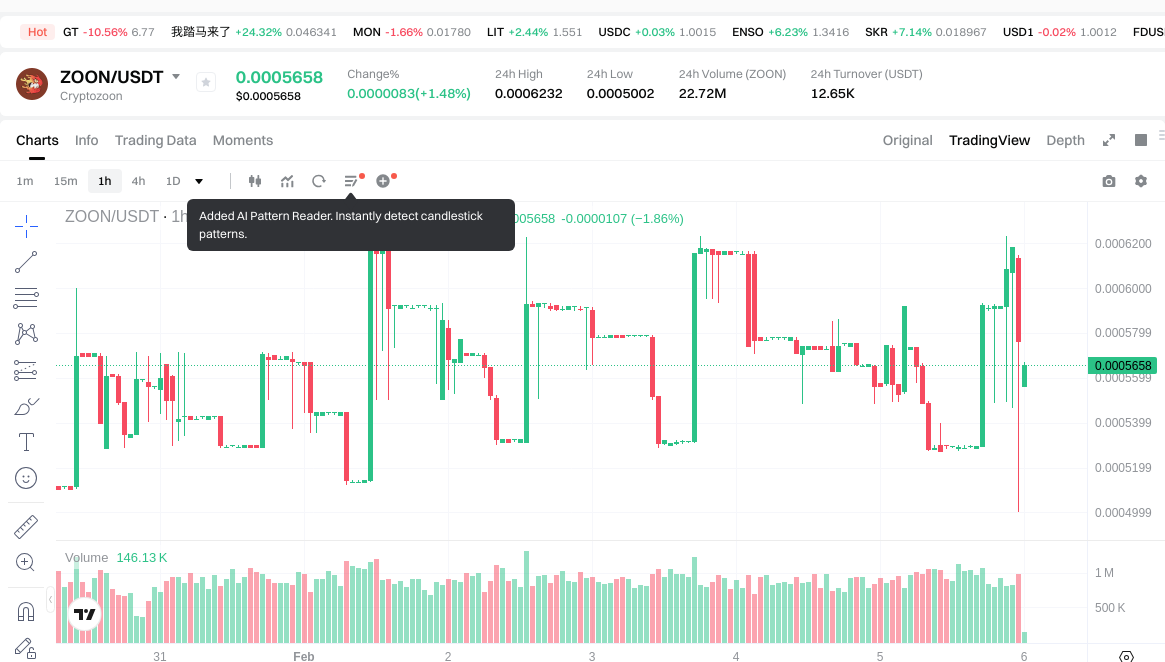
- ZOON Current Price: $0.0005765
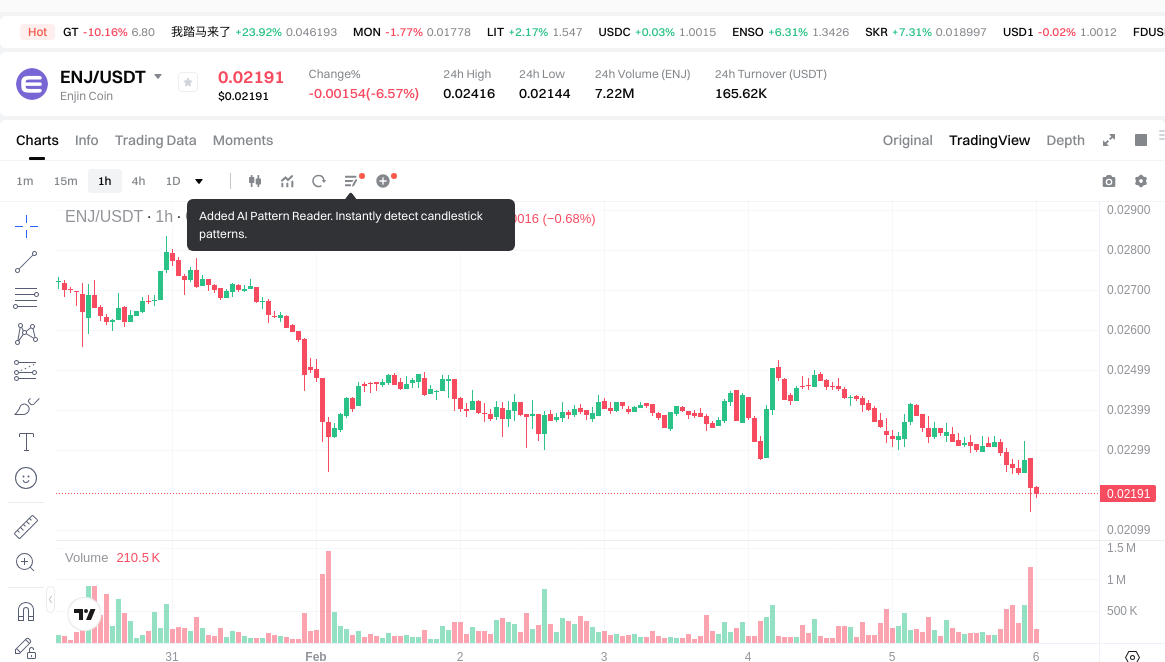
- ENJ Current Price: $0.02206
- 24-Hour Trading Volume: ZOON recorded $12,690.13, while ENJ registered $163,126.57
- Market Sentiment Index (Fear & Greed Index): 12 (Extreme Fear)
View real-time prices:
II. Core Factors Affecting ZOON vs ENJ Investment Value
Supply Mechanism Comparison (Tokenomics)
- ENJ: Circulating supply of 1,893,786,529.358754 ENJ, which directly influences price and value dynamics. The token's supply mechanism incorporates scarcity elements that may impact long-term valuation.
- ZOON: Supply mechanism information is not available in the provided materials.
- 📌 Historical Pattern: Supply variations have historically played a role in influencing ENJ's price cycles, though specific causal relationships require further market observation.
Institutional Adoption and Market Application
- Institutional Holdings: Information regarding comparative institutional preference between ZOON and ENJ is not available in the provided materials.
- Enterprise Adoption: The materials indicate that gaming cryptocurrency sector applications exist, though specific comparative data on cross-border payments, settlements, or portfolio integration for ZOON versus ENJ is not provided.
- National Policies: Regulatory attitudes toward these specific assets across different jurisdictions are not detailed in the available materials.
Technical Development and Ecosystem Building
- ENJ Technical Position: ENJ operates within the gaming cryptocurrency sector, though specific technical upgrade details are not provided in the materials.
- ZOON Technical Development: Technical development information for ZOON is not available in the provided materials.
- Ecosystem Comparison: ENJ has established presence in gaming-related applications. Comparative analysis of DeFi, NFT, payment systems, and smart contract implementations between ZOON and ENJ is not available in the materials.
Macroeconomic Conditions and Market Cycles
- Performance in Inflationary Environments: Comparative analysis of inflation-hedging properties between ZOON and ENJ is not available in the provided materials.
- Macroeconomic Monetary Policy: The materials reference broader cryptocurrency market sensitivity to interest rates and dollar index movements, though specific impacts on ZOON versus ENJ are not detailed.
- Geopolitical Factors: While geopolitical considerations affect cryptocurrency markets generally, specific effects on cross-border transaction demand for ZOON or ENJ are not documented in the available materials.
III. 2026-2031 Price Prediction: ZOON vs ENJ
Short-term Prediction (2026)
- ZOON: Conservative $0.000526 - $0.000566 | Optimistic $0.000566 - $0.000792
- ENJ: Conservative $0.019 - $0.022 | Optimistic $0.022 - $0.031
Mid-term Prediction (2028-2029)
- ZOON may enter a gradual recovery phase, with estimated price range of $0.000709 - $0.001126 in 2028 and $0.000813 - $0.000995 in 2029
- ENJ may enter a moderate growth phase, with estimated price range of $0.025 - $0.036 in 2028 and $0.021 - $0.043 in 2029
- Key drivers: institutional capital inflows, ETF developments, ecosystem expansion
Long-term Prediction (2030-2031)
- ZOON: Baseline scenario $0.000820 - $0.000976 | Optimistic scenario $0.000976 - $0.001357
- ENJ: Baseline scenario $0.022 - $0.037 | Optimistic scenario $0.037 - $0.058
View detailed price predictions for ZOON and ENJ
Disclaimer: Price predictions are based on historical data analysis and market trends, and do not constitute investment advice. Cryptocurrency markets are highly volatile and subject to various risks. Investors should conduct their own research and consult professional advisors before making any investment decisions.
ZOON:
| Year |
Predicted High Price |
Predicted Average Price |
Predicted Low Price |
Price Change |
| 2026 |
0.00079212 |
0.0005658 |
0.000526194 |
-1 |
| 2027 |
0.0008962272 |
0.00067896 |
0.0005839056 |
17 |
| 2028 |
0.001126258848 |
0.0007875936 |
0.00070883424 |
36 |
| 2029 |
0.00099520327296 |
0.000956926224 |
0.0008133872904 |
65 |
| 2030 |
0.001034628633388 |
0.00097606474848 |
0.000819894388723 |
69 |
| 2031 |
0.001357218032761 |
0.001005346690934 |
0.000784170418928 |
74 |
ENJ:
| Year |
Predicted High Price |
Predicted Average Price |
Predicted Low Price |
Price Change |
| 2026 |
0.031098 |
0.0219 |
0.019053 |
0 |
| 2027 |
0.02994387 |
0.026499 |
0.01430946 |
20 |
| 2028 |
0.03640565115 |
0.028221435 |
0.02511707715 |
27 |
| 2029 |
0.042653876859 |
0.032313543075 |
0.02100380299875 |
46 |
| 2030 |
0.04160691806337 |
0.037483709967 |
0.02211538888053 |
69 |
| 2031 |
0.058131611602321 |
0.039545314015185 |
0.023727188409111 |
79 |
IV. Investment Strategy Comparison: ZOON vs ENJ
Long-term vs Short-term Investment Strategy
- ZOON: May suit investors with higher risk tolerance seeking potential recovery opportunities in gaming-focused tokens with lower entry prices. The asset's significant price contraction from historical peaks and minimal trading volume suggest heightened volatility characteristics.
- ENJ: May appeal to investors interested in established gaming infrastructure tokens with relatively higher liquidity and market recognition. The token's longer operational history and ecosystem presence may attract those seeking exposure to blockchain gaming developments.
Risk Management and Asset Allocation
- Conservative Investors: ZOON 5-10% vs ENJ 15-20% (within cryptocurrency portfolio allocation)
- Aggressive Investors: ZOON 20-30% vs ENJ 30-40% (within cryptocurrency portfolio allocation)
- Hedging Tools: Stablecoin allocation for volatility management, options strategies for downside protection, cross-asset diversification including tokens from different sectors
V. Potential Risk Comparison
Market Risk
- ZOON: Exposure to extreme volatility given minimal market capitalization ($470,791) and limited daily trading volume ($12,690.13). Price susceptibility to low-liquidity conditions and concentrated holder dynamics. Current market sentiment (Fear & Greed Index: 12 - Extreme Fear) may amplify downside movements.
- ENJ: Subject to gaming cryptocurrency sector cyclicality and broader market trends. While possessing relatively higher liquidity ($163,126.57 daily volume), the asset remains vulnerable to sentiment shifts affecting NFT and gaming token categories. Market capitalization of approximately $42.6 million indicates mid-tier positioning with associated volatility.
Technical Risk
- ZOON: Technical development trajectory and network stability information requires additional verification. Platform dependency on Binance Smart Chain infrastructure introduces operational considerations.
- ENJ: Scalability considerations within gaming applications, potential network congestion during high-activity periods, and ongoing requirements for ecosystem technical maintenance warrant monitoring.
Regulatory Risk
- Global regulatory frameworks continue evolving regarding gaming tokens and NFT-related assets. Jurisdictional variations in digital asset classification may affect both ZOON and ENJ differently based on their specific operational structures and token utility implementations. Enhanced regulatory scrutiny on gaming-related cryptocurrencies could impact trading accessibility and institutional participation patterns.
VI. Conclusion: Which Is the Better Buy?
📌 Investment Value Summary:
- ZOON Characteristics: Lower absolute price point with speculative recovery potential; minimal current market presence may appeal to investors seeking asymmetric risk-reward profiles in gaming token space; significant distance from historical peak presents both challenge and opportunity perspectives.
- ENJ Characteristics: Established operational history since 2017 with recognizable brand presence in blockchain gaming infrastructure; relatively higher liquidity facilitates entry and exit execution; broader ecosystem connections may provide more observable development indicators.
✅ Investment Considerations:
- Novice Investors: Consider prioritizing assets with established liquidity, operational transparency, and accessible market information. ENJ's longer track record may offer more reference points for evaluation, though neither asset eliminates market volatility exposure.
- Experienced Investors: Portfolio allocation could incorporate both assets based on individual risk tolerance and gaming sector thesis. Position sizing should reflect liquidity constraints, particularly regarding ZOON. Technical analysis and on-chain metrics monitoring remain essential practices.
- Institutional Investors: Liquidity thresholds and due diligence requirements may favor ENJ's market positioning. Comprehensive evaluation of custodial solutions, regulatory compliance frameworks, and reporting capabilities should precede any allocation decisions.
⚠️ Risk Disclosure: Cryptocurrency markets exhibit extreme volatility characteristics. This analysis does not constitute investment advice. Market participants should conduct independent research, understand their risk tolerance, and consider consulting qualified financial advisors before making investment decisions.
VII. FAQ
Q1: What is the main difference between ZOON and ENJ in terms of market positioning?
ENJ operates as an established blockchain gaming infrastructure token with broader market recognition and higher liquidity, while ZOON represents a more speculative gaming token with significantly lower market capitalization and trading volume. ENJ launched in November 2017 and has built an ecosystem serving over 18.7 million registered players across 250,000 gaming communities, positioning it as a foundational layer for gaming asset tokenization. In contrast, ZOON emerged in August 2021 as the native currency of CryptoZoon, a Pokemon-inspired digital creature platform on Binance Smart Chain. As of February 6, 2026, ENJ maintains a market cap of approximately $42.6 million with daily trading volume of $163,126.57, whereas ZOON's market cap stands at only $470,791 with minimal daily volume of $12,690.13, indicating substantially different scales of adoption and liquidity profiles.
Q2: How have ZOON and ENJ performed since their respective all-time highs?
Both tokens have experienced significant declines from their historical peaks, though the magnitude differs considerably. ZOON reached its all-time high of $0.089014 on August 25, 2021, and has since declined approximately 99.35% to its current price of $0.0005765, with a historical low of $0.00020221 recorded on December 4, 2025. ENJ achieved its all-time high of $4.82 on November 25, 2021, and has fallen approximately 99.54% to its current price of $0.02206. The substantial corrections reflect broader cryptocurrency market cycles, declining interest in gaming tokens during bear market conditions, and sector-specific challenges affecting NFT and blockchain gaming adoption rates. Both assets remain far below their peak valuations, indicating prolonged accumulation phases or structural headwinds requiring fundamental catalysts for recovery.
Q3: What are the price predictions for ZOON and ENJ through 2031?
Short-term predictions for 2026 suggest ZOON may trade between $0.000526-$0.000792 (conservative to optimistic scenarios), while ENJ could range from $0.019-$0.031. Mid-term projections for 2028-2029 indicate potential gradual recovery phases, with ZOON estimated at $0.000709-$0.001126 in 2028 and $0.000813-$0.000995 in 2029, while ENJ may reach $0.025-$0.036 in 2028 and $0.021-$0.043 in 2029. Long-term forecasts for 2030-2031 project ZOON baseline scenarios of $0.000820-$0.000976 (optimistic $0.000976-$0.001357) and ENJ baseline scenarios of $0.022-$0.037 (optimistic $0.037-$0.058). These predictions incorporate historical data analysis, market trend extrapolation, and potential institutional capital inflows, though cryptocurrency markets remain highly volatile and unpredictable. Investors should note these projections do not constitute financial advice and actual performance may differ significantly from estimates.
Q4: Which token presents better liquidity characteristics for trading execution?
ENJ demonstrates substantially superior liquidity metrics compared to ZOON across all measurable dimensions. ENJ's daily trading volume of $163,126.57 exceeds ZOON's volume of $12,690.13 by approximately 12.8 times, facilitating smoother order execution with reduced slippage risk. ENJ's market capitalization of $42.6 million compared to ZOON's $470,791 indicates approximately 90 times greater market depth, enabling larger position entries and exits without significant price impact. The circulating supply of ENJ (1.89 billion tokens) provides broader distribution across market participants, while ZOON's supply mechanism remains undisclosed in available materials. For investors prioritizing execution certainty, particularly institutional participants or those managing substantial positions, ENJ's liquidity profile presents material advantages. ZOON's minimal trading volume creates elevated execution risks including wider bid-ask spreads, potential difficulty exiting positions during adverse conditions, and vulnerability to price manipulation in thin market conditions.
Q5: What are the primary risk factors differentiating ZOON from ENJ investments?
ZOON carries elevated risk characteristics stemming from its minimal market capitalization, extremely low trading volume, and limited operational transparency regarding supply mechanisms and technical development. The token's 99.35% decline from all-time highs and proximity to historical lows ($0.00020221) suggest either severe fundamental deterioration or extended accumulation patterns requiring validation. Platform dependency on Binance Smart Chain introduces infrastructure risks beyond the token's control. ENJ faces different risk profiles including gaming cryptocurrency sector cyclicality, scalability considerations within gaming applications, and exposure to NFT market sentiment fluctuations. However, ENJ's seven-year operational history provides more extensive data for risk assessment, while its relatively higher liquidity offers greater exit flexibility during adverse conditions. Both tokens face regulatory uncertainty as global frameworks evolve regarding gaming tokens and NFT-related assets, with jurisdictional variations potentially affecting trading accessibility differently based on each token's specific utility implementations and operational structures.
Q6: How should different investor profiles approach allocation between ZOON and ENJ?
Conservative investors might consider limiting combined gaming token exposure to 20-30% of cryptocurrency portfolios, with ENJ comprising 15-20% and ZOON 5-10% given their respective risk profiles. This allocation acknowledges ENJ's relative stability advantages while permitting speculative exposure to ZOON's recovery potential. Aggressive investors with higher risk tolerance could increase allocations to 50-70% combined, with ENJ at 30-40% and ZOON at 20-30%, accepting greater volatility for potential asymmetric returns. Novice investors should prioritize ENJ given its established track record, higher liquidity, and more accessible market information for evaluation purposes, potentially avoiding ZOON until developing stronger risk management capabilities and market understanding. Institutional investors face liquidity thresholds favoring ENJ's market positioning, with comprehensive due diligence on custodial solutions, regulatory compliance frameworks, and reporting capabilities preceding allocation decisions. All investors should implement proper position sizing, avoid over-concentration in gaming tokens, maintain stablecoin allocations for volatility management, and consider hedging instruments including options strategies for downside protection.
Q7: What catalysts could drive future performance divergence between ZOON and ENJ?
Several potential catalysts may impact these tokens differently based on their distinct market positions and ecosystem maturity levels. For ENJ, institutional capital inflows through gaming-focused investment vehicles, blockchain gaming ETF developments, major partnership announcements with established gaming studios, successful technical upgrades enhancing scalability, and expanding NFT marketplace integrations could drive positive performance. ENJ's established infrastructure position enables it to capture sector-wide growth trends more readily than smaller competitors. For ZOON, potential catalysts include successful platform relaunch initiatives, strategic partnerships restoring user engagement, technical developments demonstrating renewed project commitment, exchange listings improving liquidity access, or broader gaming token sector recovery lifting speculative assets. However, ZOON faces significant execution risks given its current minimal market presence and must demonstrate fundamental improvements to attract sustained investment interest. Regulatory developments may also impact tokens asymmetrically, with clearer gaming token frameworks potentially benefiting established projects like ENJ while creating compliance burdens for smaller platforms. Macroeconomic conditions including interest rate trajectories and risk appetite shifts will likely affect both tokens, though ENJ's higher liquidity may provide better resilience during market stress periods.
* The information is not intended to be and does not constitute financial advice or any other recommendation of any sort offered or endorsed by Gate.