I. Executive Summary and Core Insights
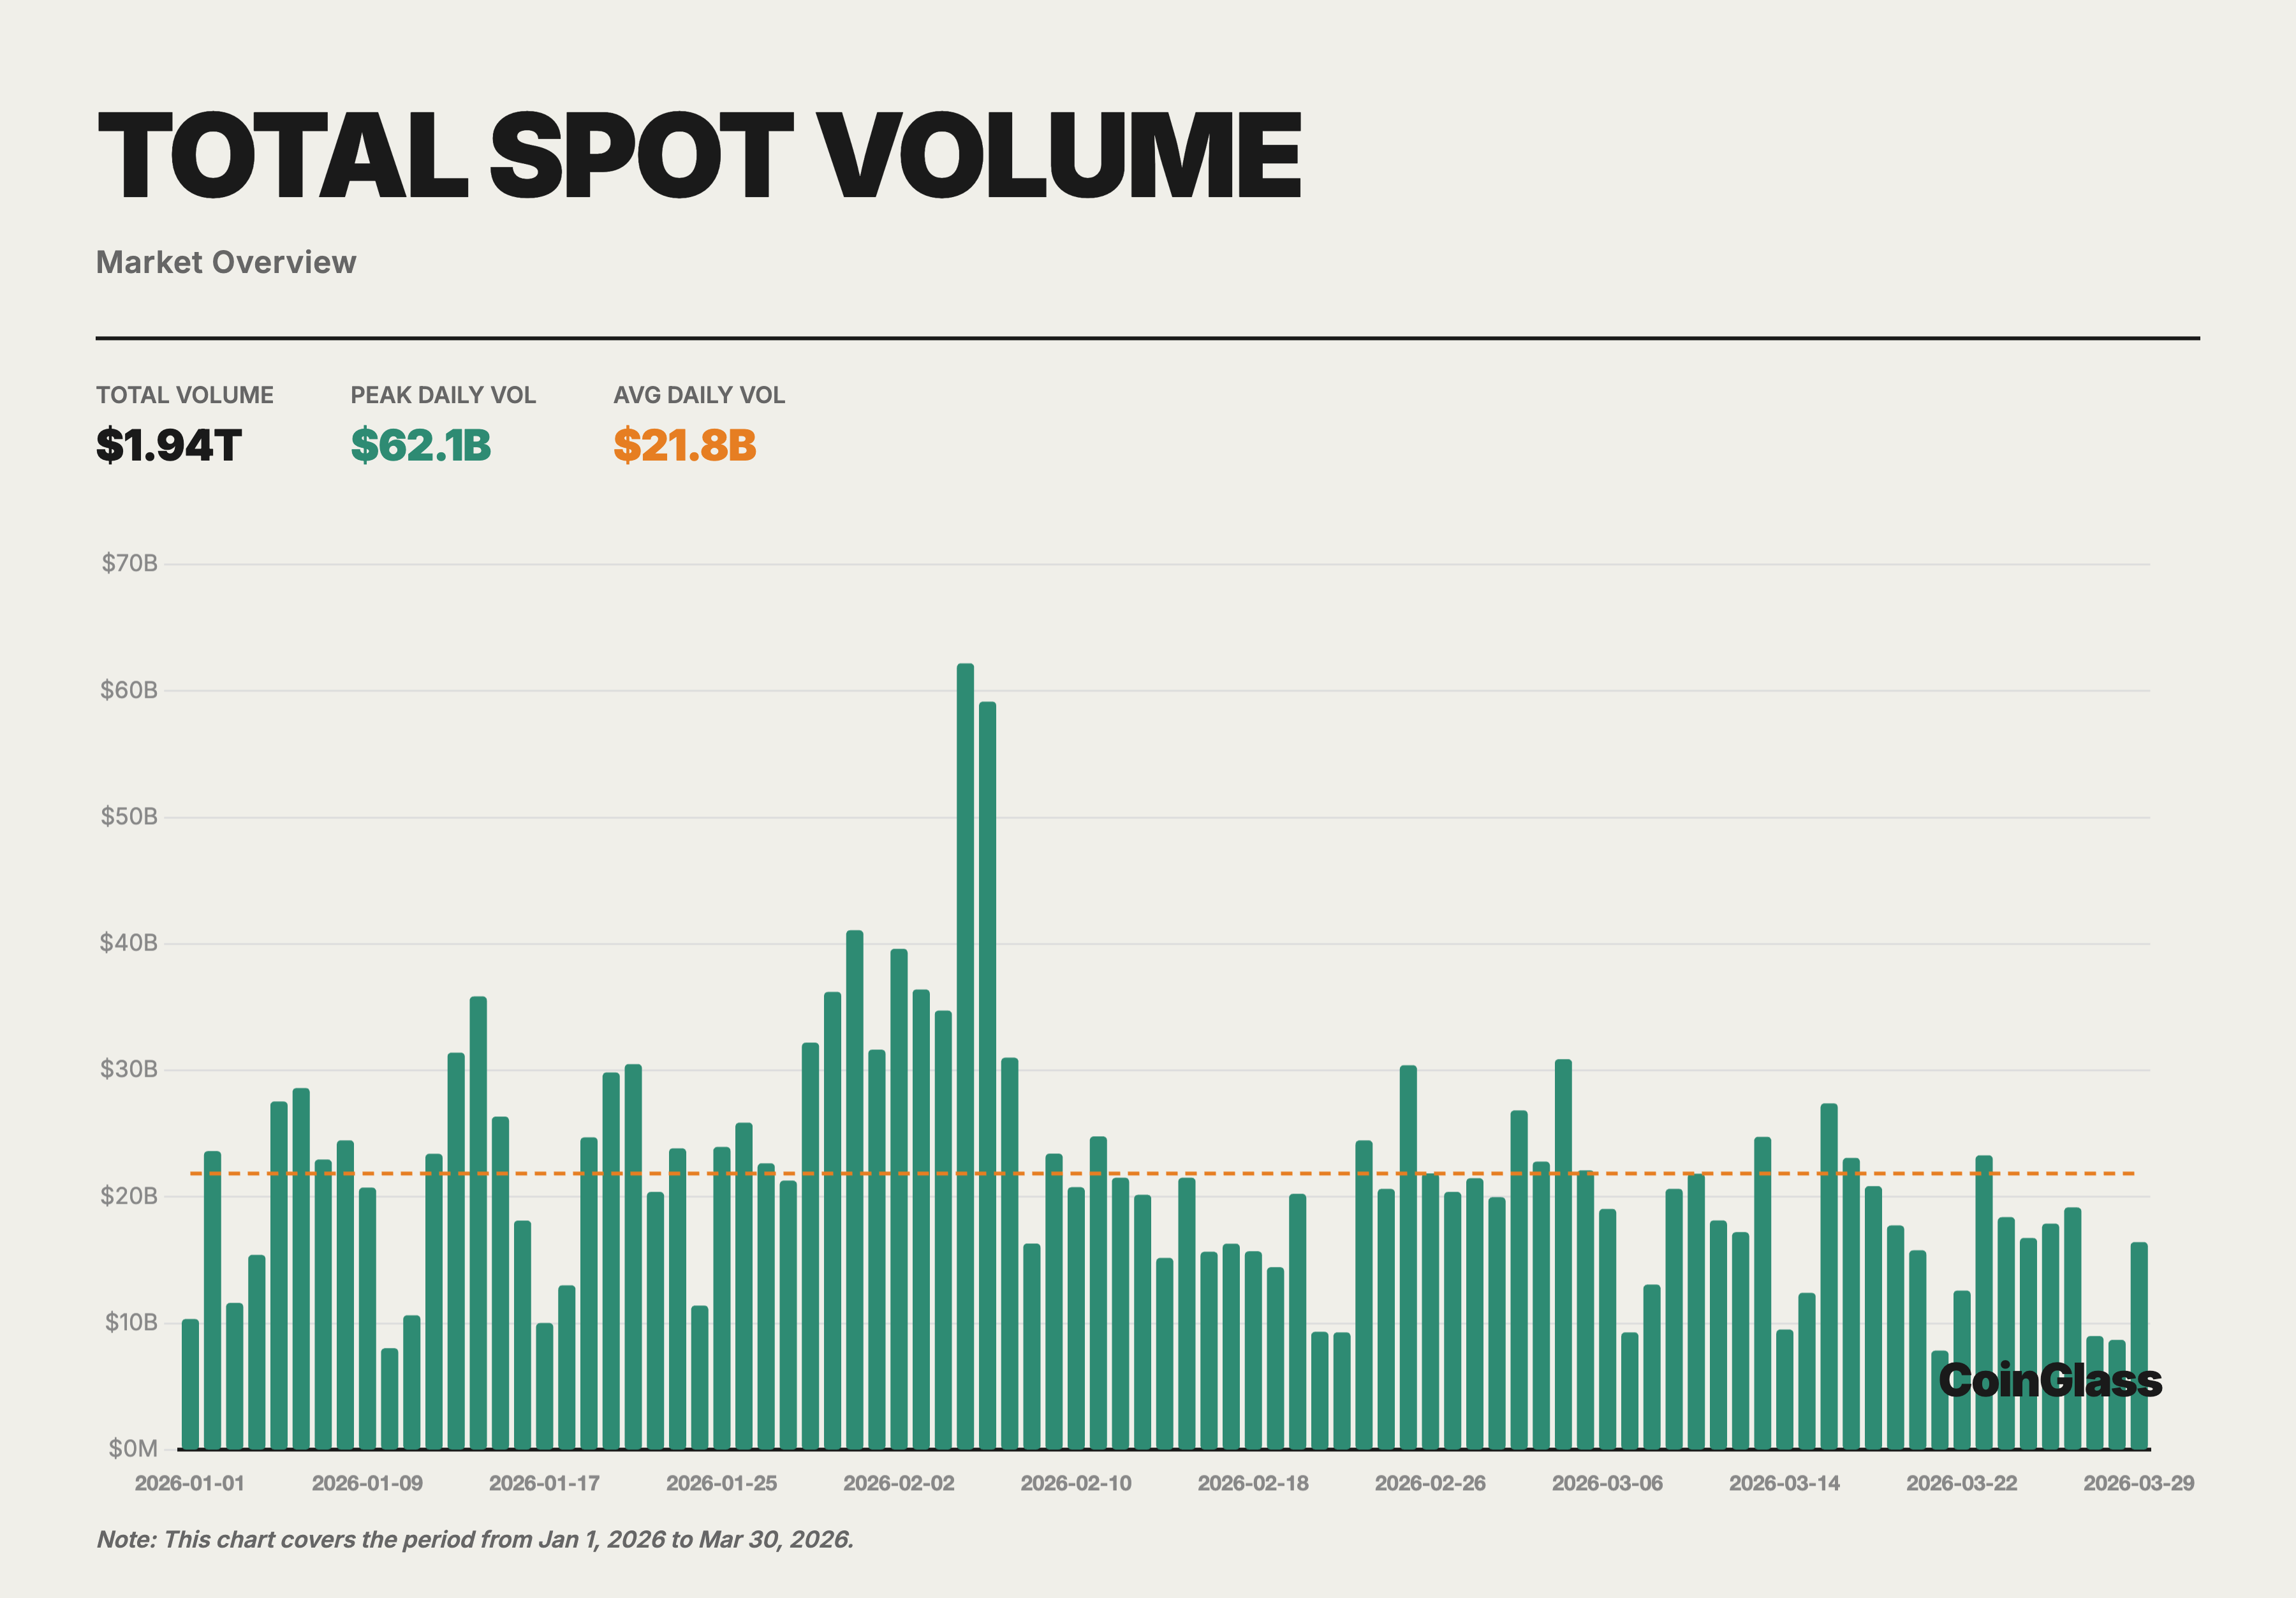
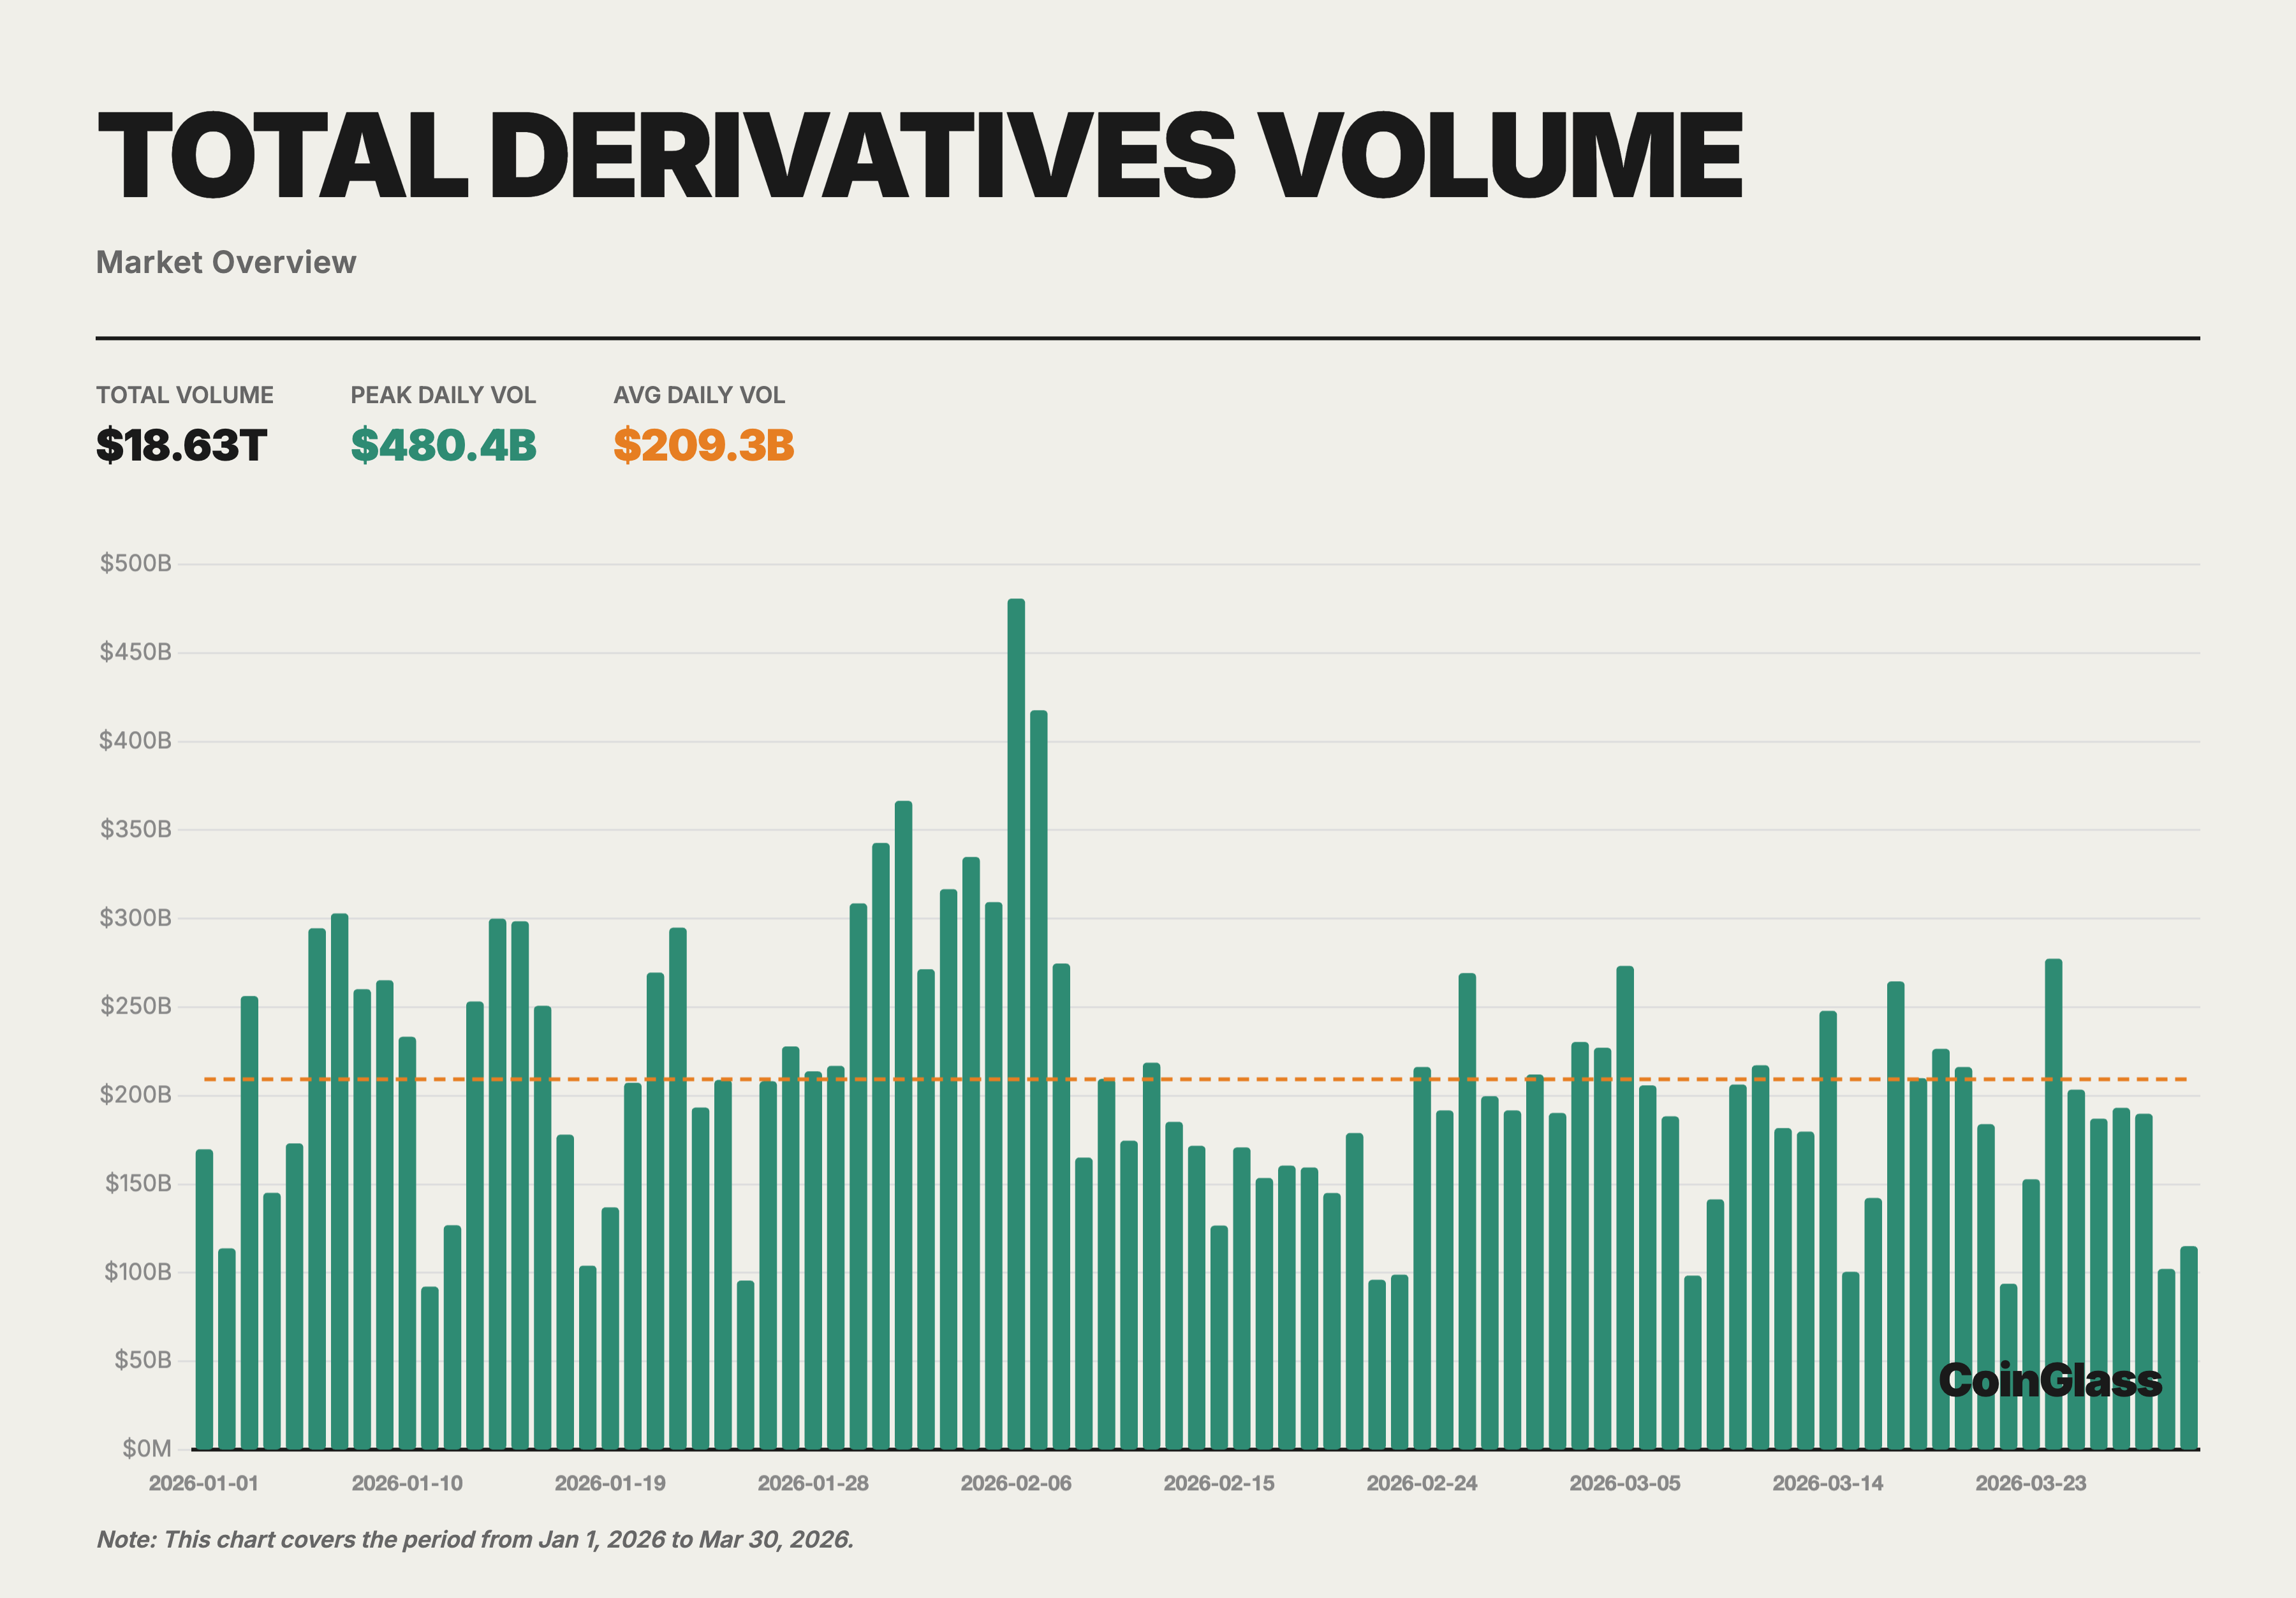
In Q1 2026, the cryptocurrency market remained highly active overall, though trading volumes gradually declined from their January highs. Total Q1 spot trading volume was approximately $1.94 trillion, with derivatives trading at about $18.63 trillion, for a combined total of $20.57 trillion. The ratio of derivatives to spot trading stood at roughly 9.6x. Market activity continued to be centered in the derivatives sector, with spot trading volumes seeing a more pronounced contraction.
Key indicators show Binance retained its industry-leading position. Derivatives trading volume reached $4.90 trillion, accounting for 34.9% of the Top 10 exchanges; average daily open interest was $23.9 billion (29.9% share); and user assets held reached $152.9 billion, representing 73.5% among major CEXs. Compared to the second-ranked platforms, Binance’s derivatives trading volume was 2.2x that of OKX, average open interest was 2.2x that of Bybit, and user asset scale was 9.6x that of OKX. This demonstrates that Binance’s leadership is multidimensional, spanning trading activity, open interest, liquidity, and capital retention.
Within the Top 5, the market has established a clear hierarchy. For derivatives trading volume, Binance, OKX, Bybit, Gate, and Bitget take the top five spots, with Bybit and Gate close in scale and OKX remaining the nearest centralized competitor to Binance. In open interest, the order of the second tier is Bybit, Gate, OKX, and Bitget. For user asset holdings, only OKX maintains over $10 billion after Binance, with Gate, Bitget, and Bybit each ranging between $5 billion and $7 billion. Overall, competition among the Top 5 is intense, but there is still a significant gap between the leader and the next tier.
II. Spot and Derivatives Trading Volumes
2.1 Marketwide Monthly Trading Volume Overview
In Q1 2026, total crypto trading volume (spot + derivatives) reached $20.57 trillion, with spot volume at $1.94 trillion and derivatives at $18.63 trillion. January saw the highest monthly volume (spot $704.7 billion + derivatives $6.73 trillion), followed by a slight dip in February and a further contraction in March to the quarterly low. This trend reflects the broader global macro caution of the period, as the market’s risk appetite had not fully recovered after the sharp deleveraging of Q4 2025.
Average daily spot trading volume was $21.8 billion, while derivatives averaged $209.3 billion per day. The derivatives-to-spot ratio held steady at about 9.6x in Q1, slightly above the 2025 full-year average. This suggests that during periods of market adjustment, traders favored derivatives for hedging and short-term strategies over directional allocations in spot.
2.2 Spot Trading Volume and Market Share
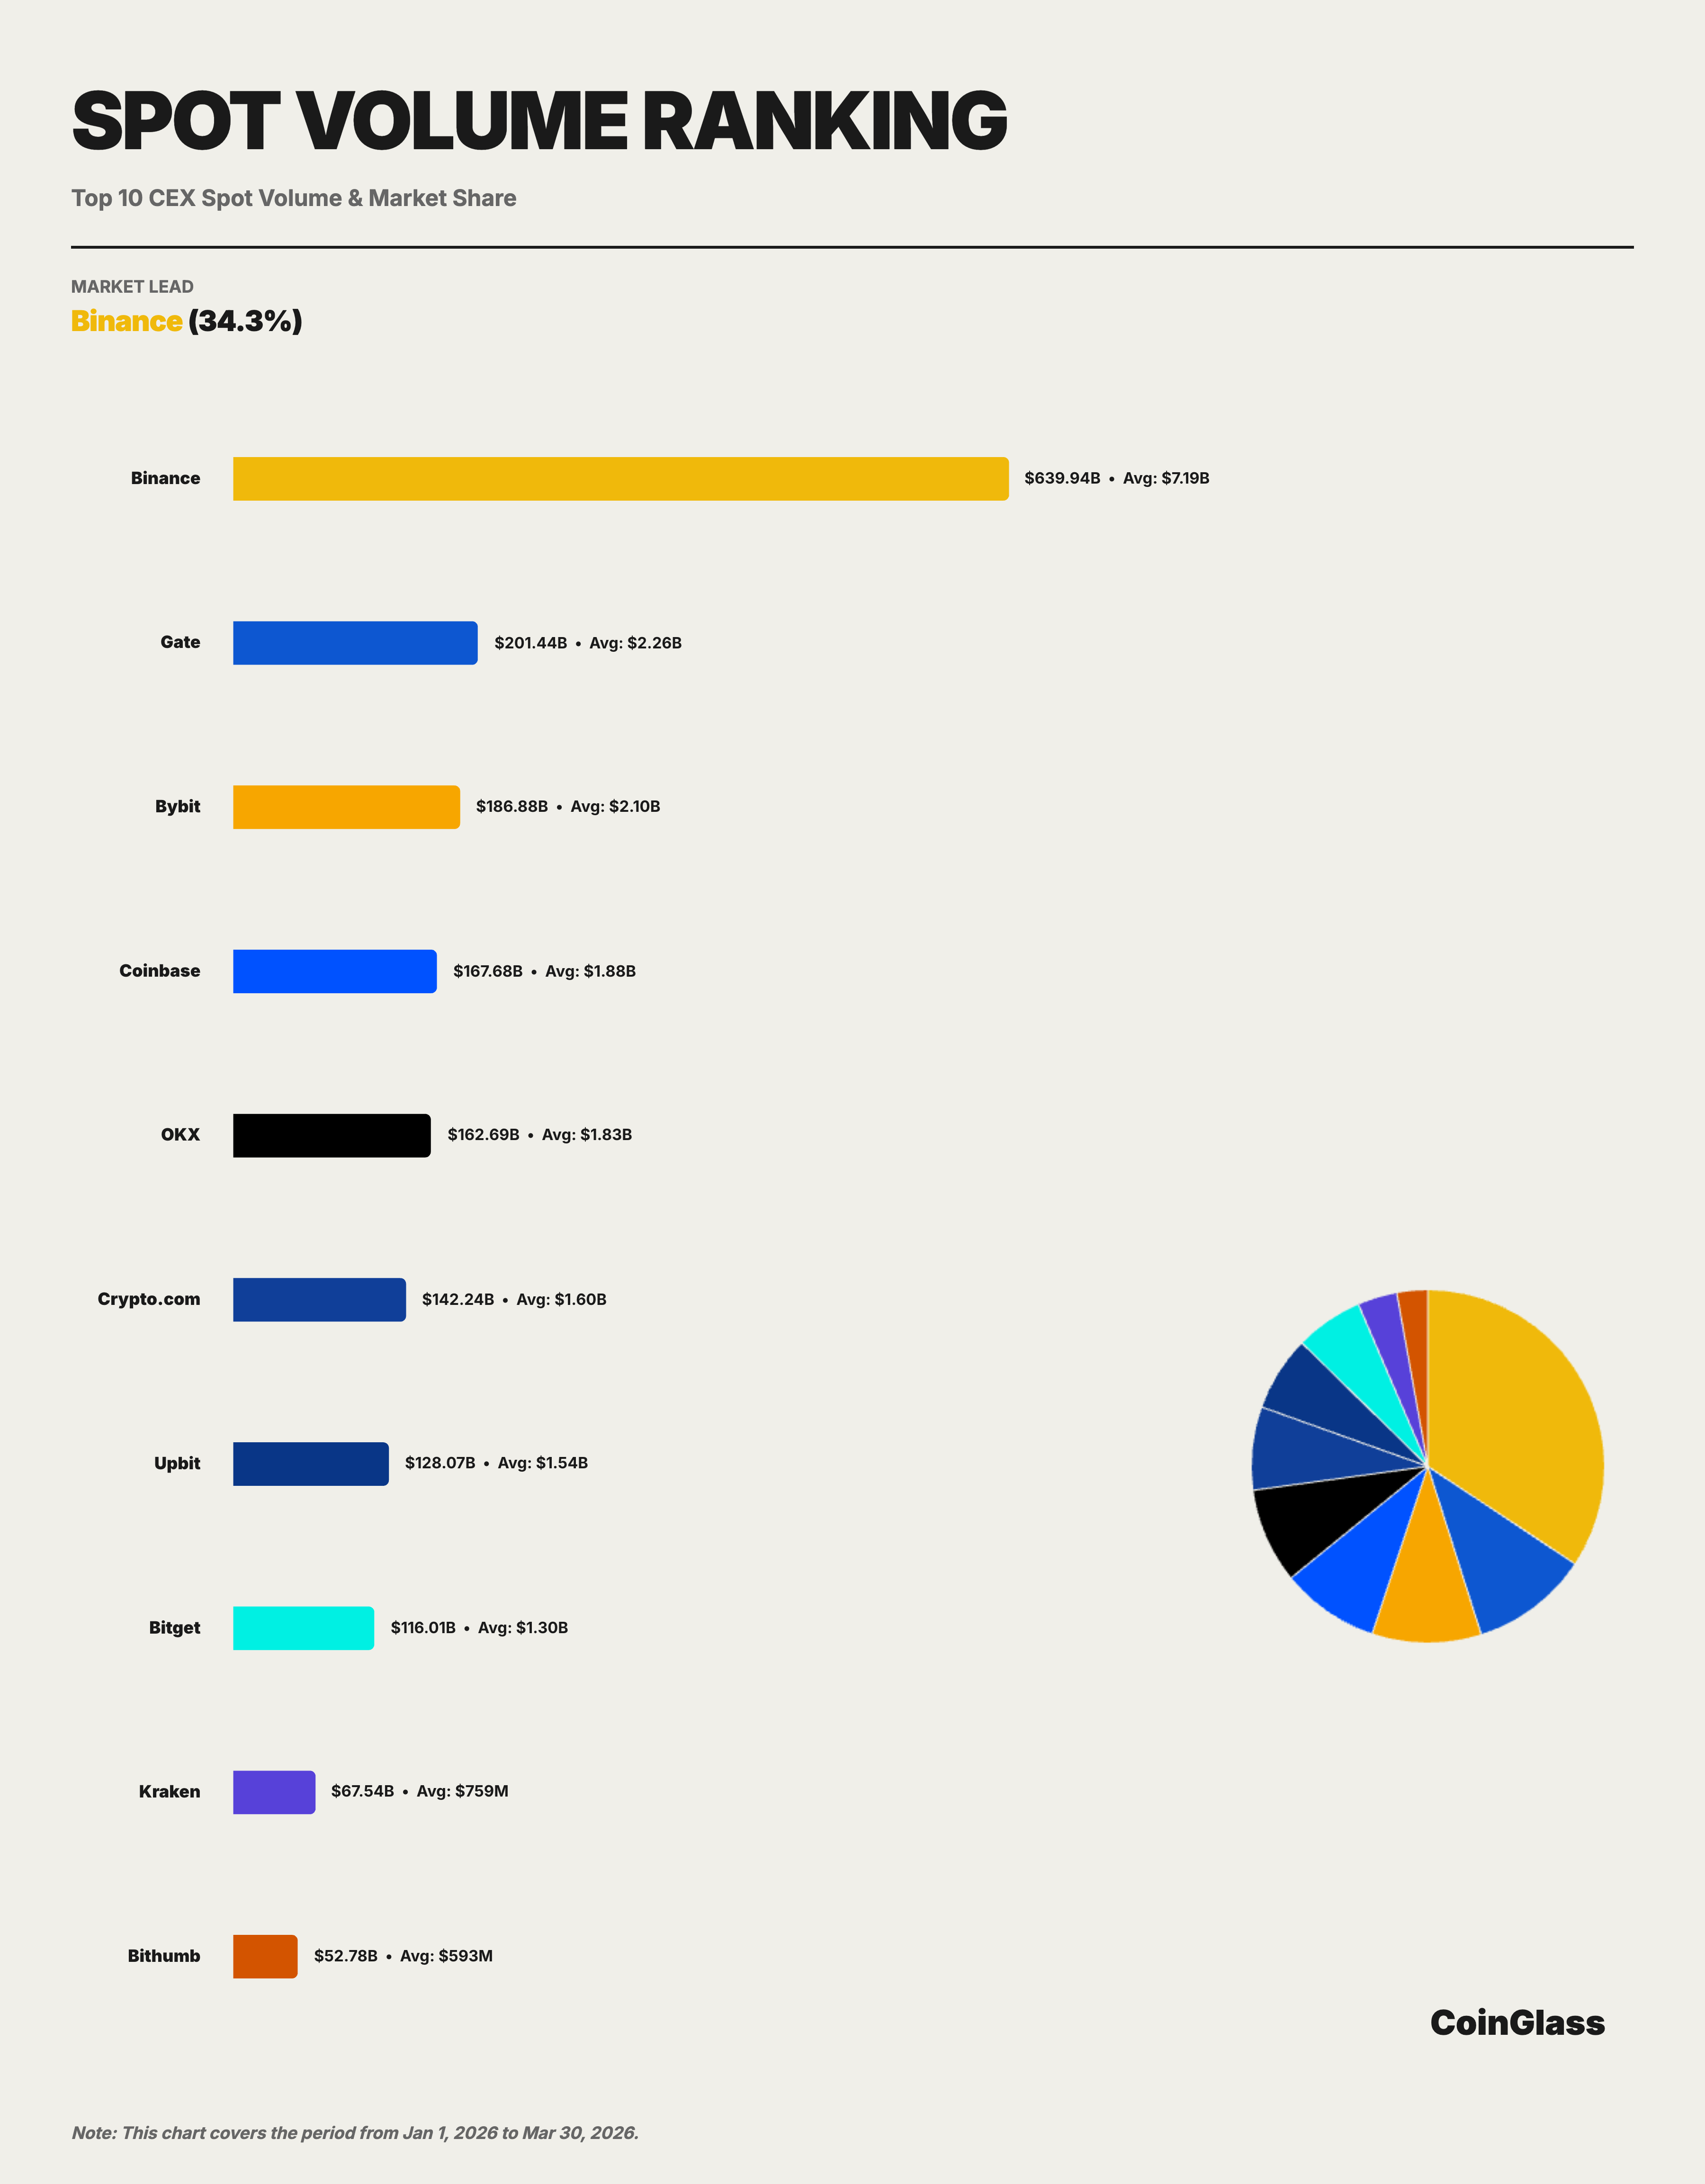
Binance’s cumulative Q1 spot trading volume was $639.9 billion, with an average daily volume of $7.19 billion and a 34.3% market share among the Top 10. Monthly, Binance’s share among the Top 10 spot exchanges was stable: 34.0% in January 2026, 33.7% in February, and a rebound to 35.4% in March. Even as total market volume contracted from $704.7 billion in January to $542.0 billion in March—a 23% decrease—Binance’s share edged higher. This indicates that, despite an overall pullback in the spot market, top-tier liquidity continued to consolidate among a handful of platforms.
Looking at the Top 5, the spot market is much more fragmented than derivatives. In Q1, the top five spot trading platforms were Binance, Gate, Bybit, Coinbase, and OKX, with respective volumes of $639.9 billion, $201.4 billion, $186.9 billion, $167.7 billion, and $162.7 billion. Excluding Binance, the other four each held about 8% to 10% of the market. Thus, Binance’s lead in spot is clear, but the second tier is more evenly distributed and competition is more diffuse than in derivatives.
2.3 Derivatives Trading Volume and Market Share
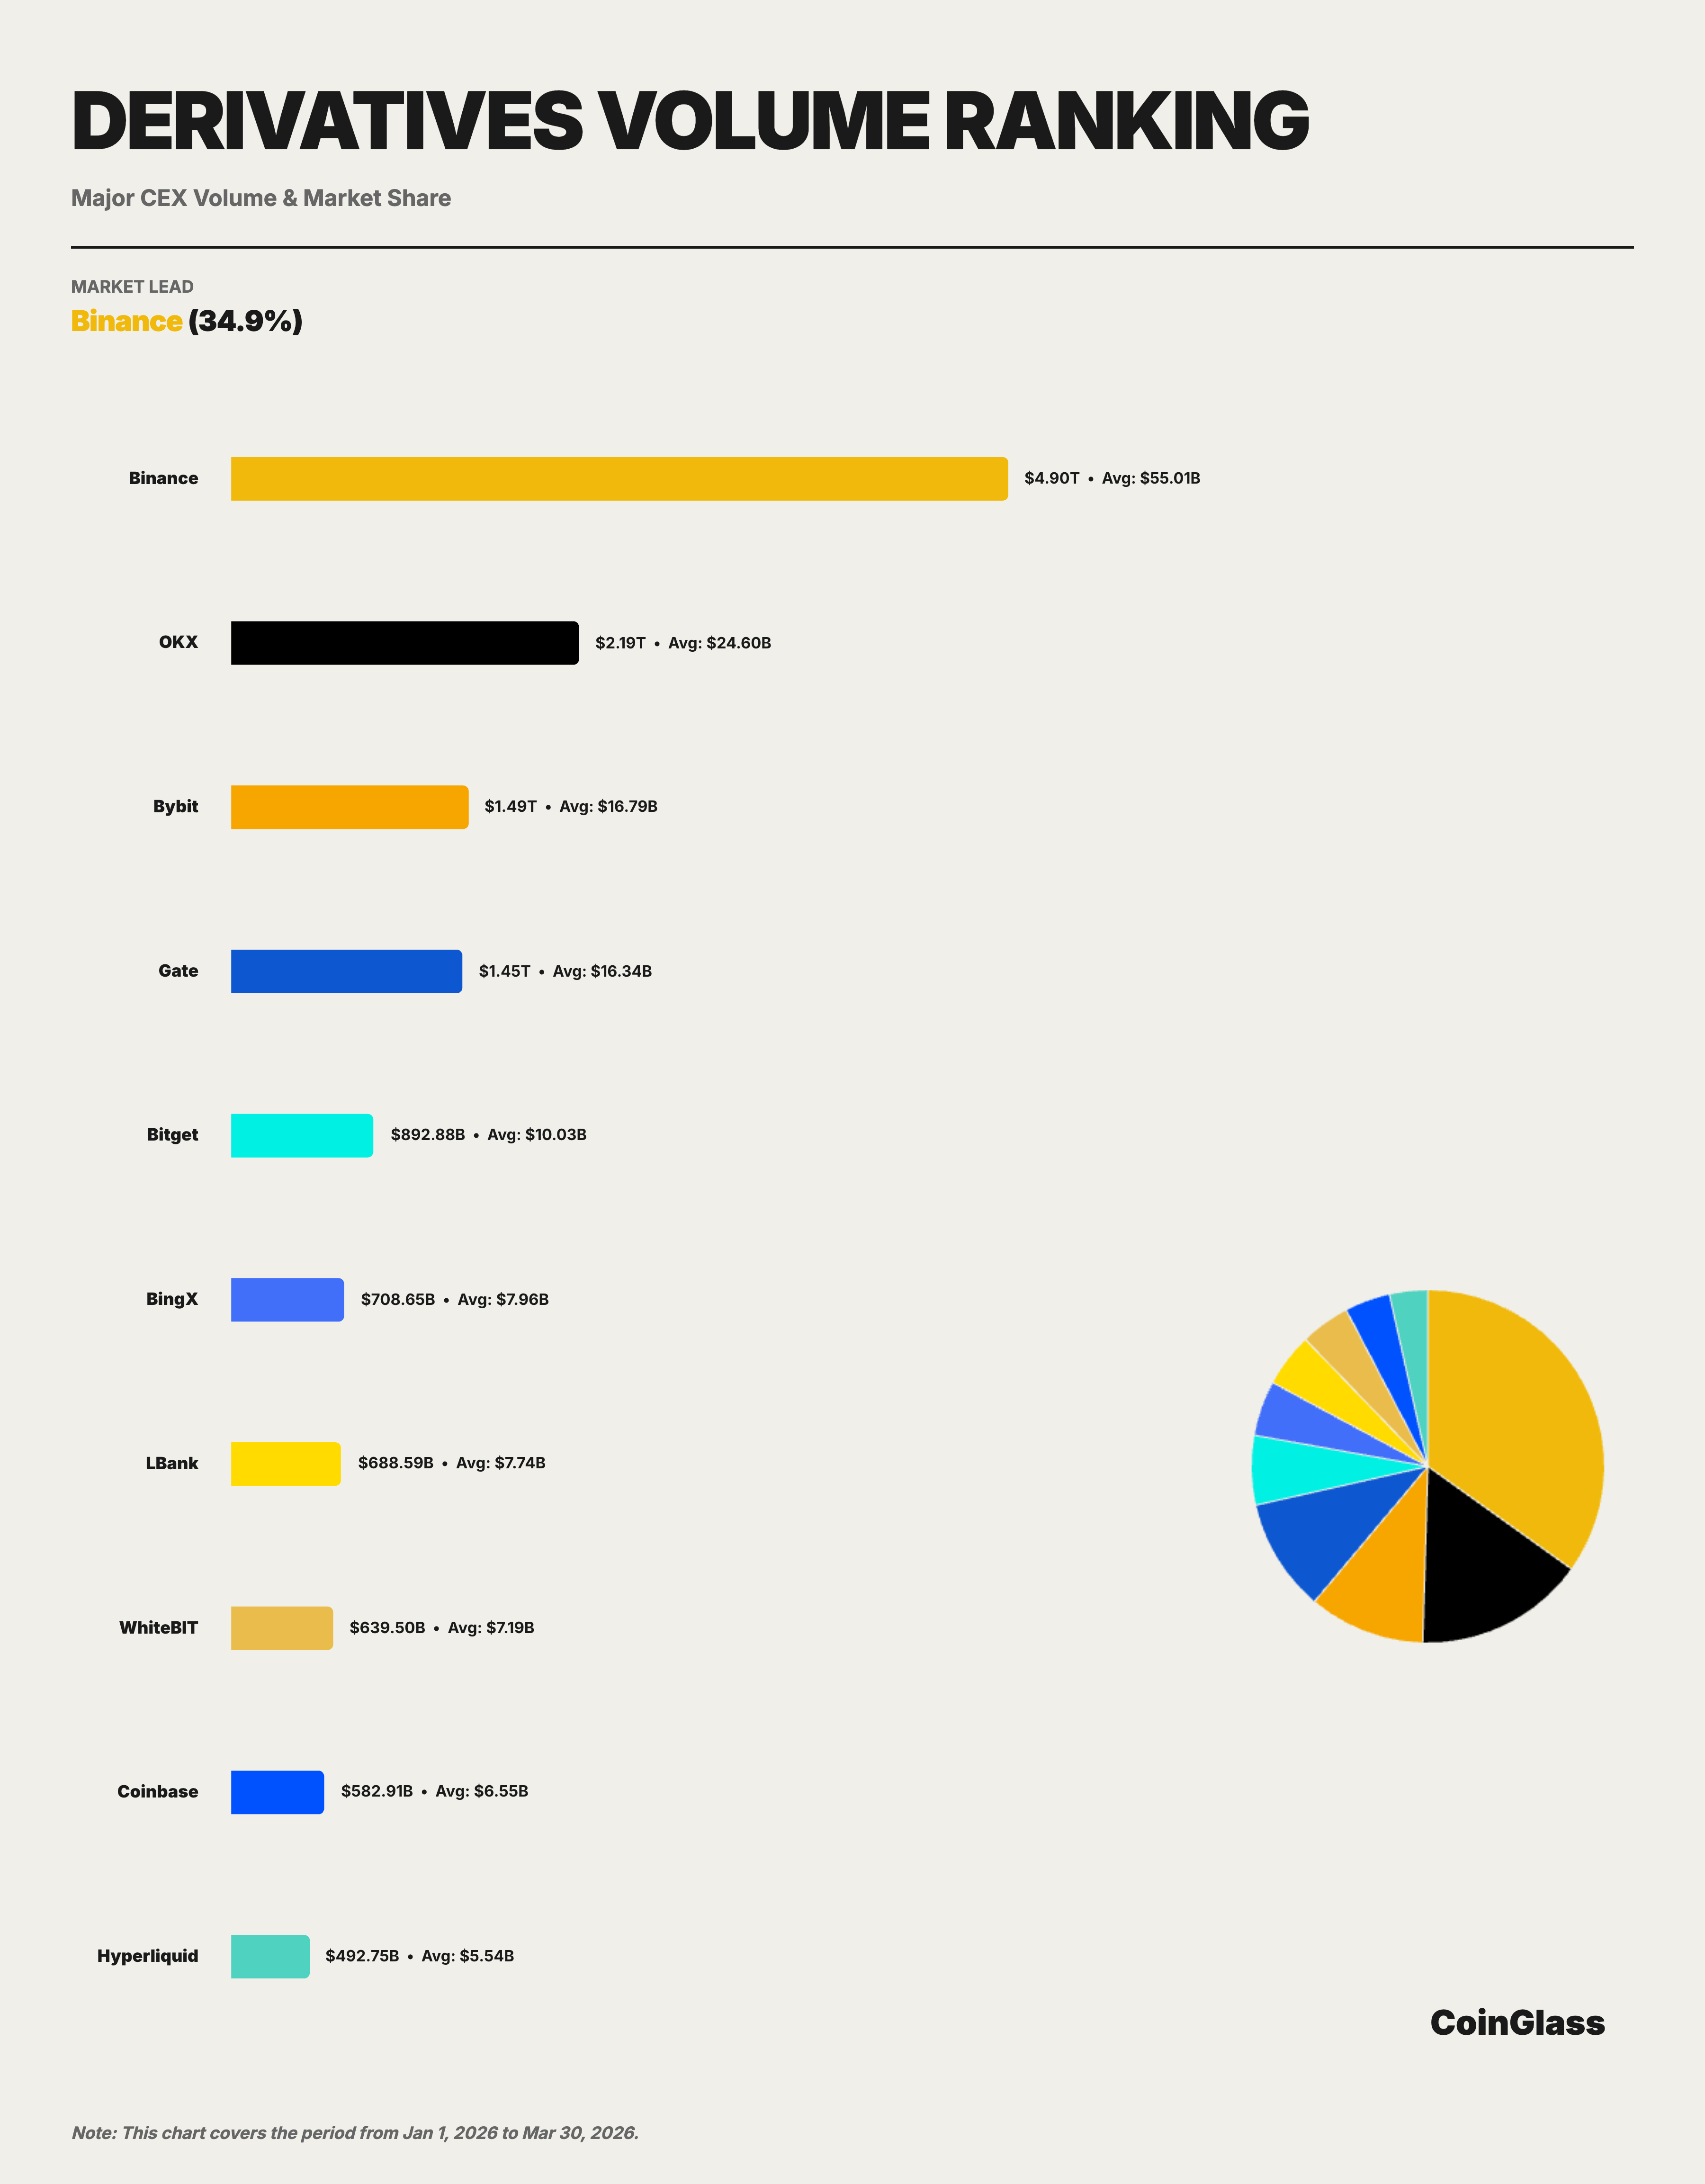
Binance posted $4.90 trillion in cumulative Q1 derivatives volume, averaging $55 billion per day. Among the Top 10 exchanges, Binance held a 34.9% share, far surpassing the combined volumes of second-place OKX ($2.19 trillion) and third-place Bybit ($1.49 trillion).
Monthly, Binance’s share among Top 10 derivatives exchanges remained robust: 33.2% in January 2026, rising to 35.8% in February, and holding at 35.7% in March. This recovery trajectory aligns with liquidity returning to leading platforms after the Q4 2025 deleveraging event. While trading volumes briefly dispersed at the start of the quarter, as markets stabilized, liquidity flowed back to platforms with deeper order books and greater execution efficiency, with Binance showing the strongest capacity to capture this shift.
OKX is the closest centralized challenger to Binance, but its trading volume is only about 45% that of Binance; Bybit and Gate are close in scale, forming the middle of the second tier; Bitget rounds out the Top 5, but there is a pronounced gap between it and the top four. In relative terms, Binance’s derivatives volume is 3.3x Bybit, 3.4x Gate, and 5.5x Bitget.
2.4 Competitive Landscape Comparison
When spot and derivatives markets are viewed side by side, their competitive structures diverge sharply. In spot, Binance holds the lead, but the second tier—Gate, Bybit, Coinbase, and OKX—are close in share. In derivatives, Binance’s lead is more pronounced, and the hierarchy between OKX (second) and the rest is more defined. This underscores that Binance’s dominance is more concentrated in derivatives, while the spot market is characterized by a “leading platform with a fragmented second tier.”
By platform positioning, OKX is solidly second in derivatives and is Binance’s closest challenger; Bybit and Gate are on the same level, with Bybit enjoying strong engagement among active global traders and Gate maintaining a high profile in both volume and open interest. BingX, LBank, WhiteBIT, Coinbase, and Hyperliquid remain active outside the Top 5, but on a much smaller scale.
Decentralized derivatives platforms are now part of the mainstream landscape. Hyperliquid’s Q1 derivatives volume reached $492.7 billion, placing it in the Top 10, with average open interest around $6 billion. This shows that on-chain derivatives are no longer peripheral but are beginning to compete in certain segments. However, their overall scale still trails leading centralized platforms like Binance, OKX, Bybit, and Gate.
III. Derivatives Open Interest
3.1 Marketwide Open Interest Trends
In Q1 2026, average daily derivatives open interest (OI) was $117.2 billion, peaking at $152.5 billion on January 15. By month, average daily OI was $141.1 billion in January, fell sharply to $102.6 billion in February (down 27%), and rebounded slightly to $106.0 billion in March.
3.2 OI Share and Rankings
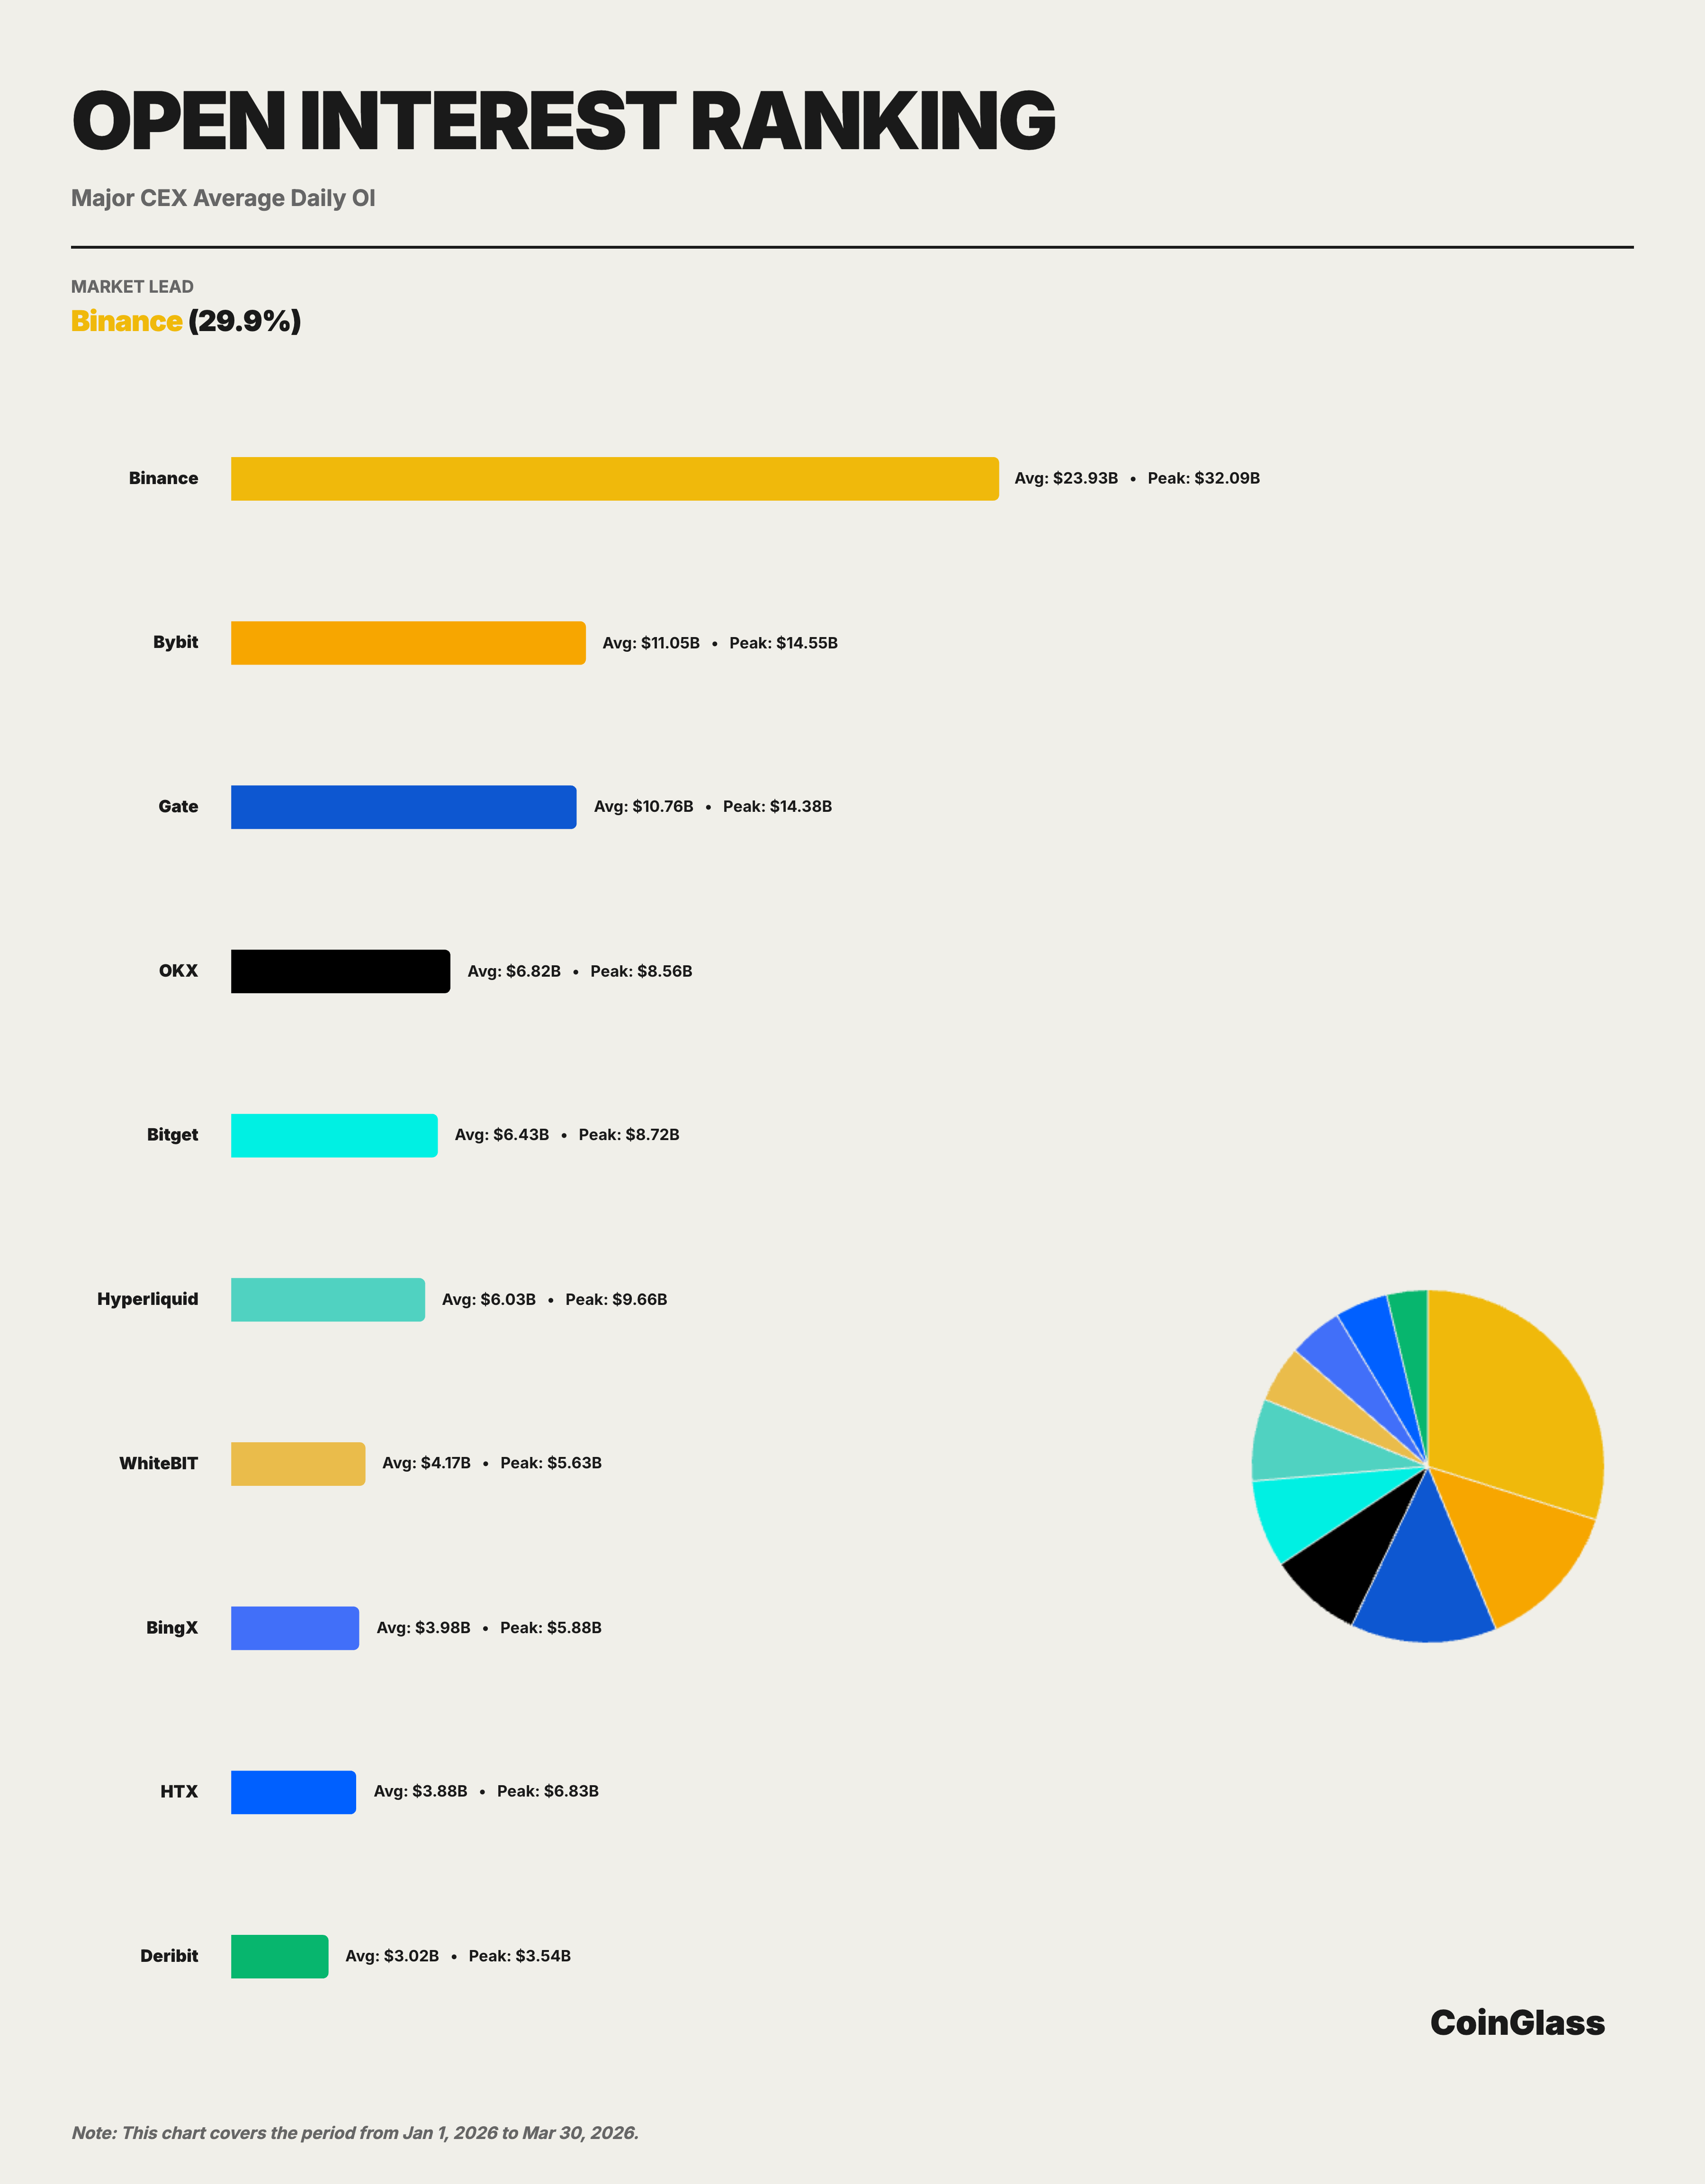
Binance’s average Q1 OI was $23.9 billion, accounting for 29.9% of the Top 10 and ranking first. Bybit, Gate, OKX, and Bitget followed, with average OI of $11.0 billion, $10.8 billion, $6.8 billion, and $6.4 billion, respectively. Binance’s average OI was 2.2x Bybit, 2.2x Gate, 3.5x OKX, and 3.7x Bitget, underscoring its clear lead.
Binance’s OI share remained in the 20%–21% range throughout the quarter, indicating a stable market position. Of note, Binance’s peak OI was $32.1 billion—2.2x Bybit’s peak of $14.5 billion—demonstrating Binance’s capacity to absorb more positions during market volatility.
3.3 Market Structure Analysis
Open interest market structure differs from trading volume. Binance’s lead in volume exceeds 19 percentage points over second place, but in OI, the gap between Binance (29.9%), Bybit (13.8%), Gate (13.4%), and OKX (8.5%) is narrower. This reflects each platform’s unique strengths in attracting long-term positions.
Hyperliquid’s OI scale is particularly notable, with average daily OI of $6 billion and a peak near $9.7 billion—close to Bitget and higher than WhiteBIT or BingX. The rise of on-chain platforms in open interest shows their growing appeal for high-leverage and strategy trading. While not yet enough to challenge Binance’s dominance, on-chain competitors are raising the stakes for second-tier platforms. Hyperliquid’s rapid OI growth further validates the 2025 annual report’s view that “decentralized derivatives are moving from proof of concept to real market share competition.”
IV. Liquidity Depth
This section uses Order Book snapshot data to compare the ±1% two-sided depth for BTC and ETH spot and futures across leading platforms. Depth, more than volume or OI, directly measures a platform’s ability to handle large trades, making it a key test of “quality leadership.”
4.1 BTC Market Depth
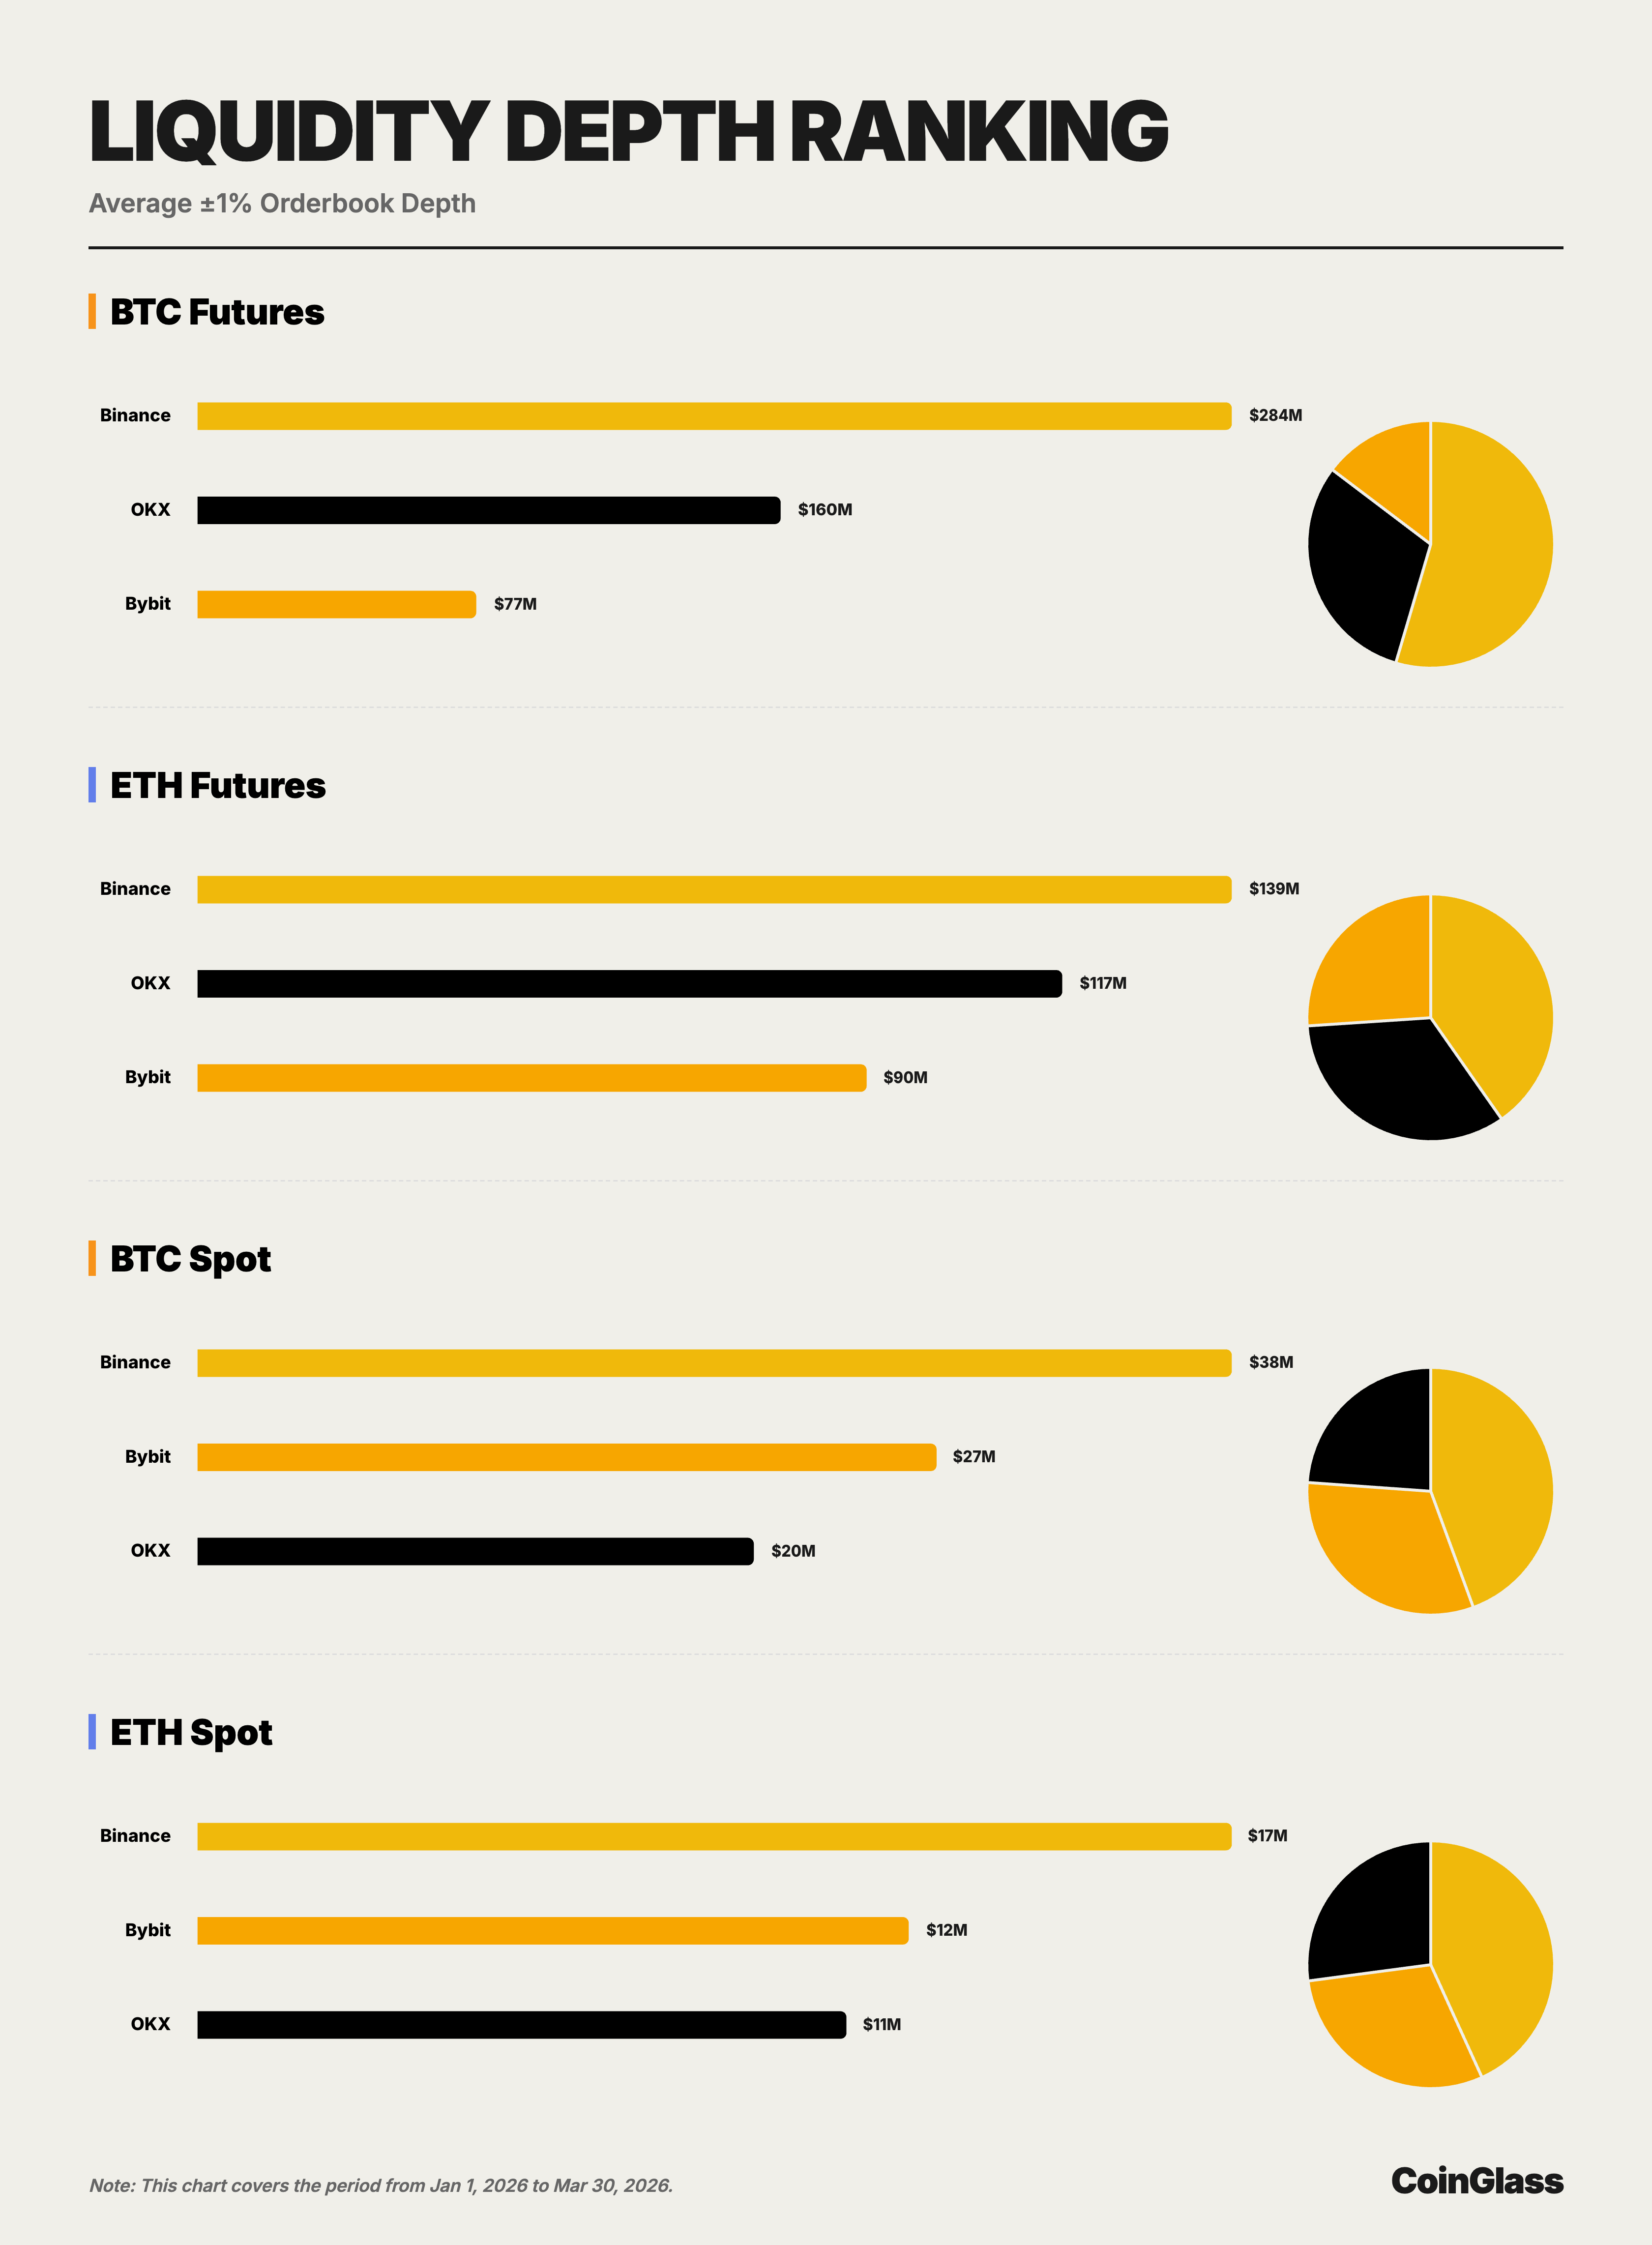
In BTC futures, average ±1% two-sided depth was $284 million for Binance, $160 million for OKX, and $76.55 million for Bybit. Binance outpaced OKX by 1.8x and Bybit by 3.7x, maintaining a clear lead. For institutional traders, this means Binance can absorb larger BTC futures orders without excessive price impact, translating directly into execution value.
In BTC spot, average ±1% two-sided depth was $37.54 million for Binance, $26.82 million for Bybit, and $20.18 million for OKX. Unlike futures, Bybit ranked second here, but Binance still surpassed Bybit by 40% and OKX by 86%. This confirms Binance’s leadership in both core BTC liquidity pools, while the runner-up changes by market segment.
4.2 ETH Market Depth
In ETH futures, average ±1% two-sided depth was $139 million for Binance, $117 million for OKX, and $90.15 million for Bybit. ETH futures competition is closer than BTC, with OKX narrowing the gap to Binance to 16% and Bybit trailing Binance by 35%. Still, Binance remains first, showing its advantage extends beyond BTC.
In ETH spot, average ±1% two-sided depth was $16.84 million for Binance, $11.58 million for Bybit, and $10.57 million for OKX. As in BTC spot, Bybit is second, but Binance exceeded Bybit by 45% and OKX by 59%. Overall, Binance leads in all four core segments, with second place alternating between OKX and Bybit, underscoring the breadth—not just depth—of Binance’s advantage.
4.3 Depth vs. Trading Volume
For execution, depth is a better indicator of true liquidity quality than volume. Q1 data shows Binance leads in both spot and derivatives volume and in BTC and ETH liquidity depth. OKX is more competitive in futures depth, and Bybit is closer to the top in spot depth, but no platform currently challenges Binance across all four core segments. This highlights the structural stability of Binance’s lead.
V. User Asset Holdings
5.1 Asset Reserve Scale and Trends
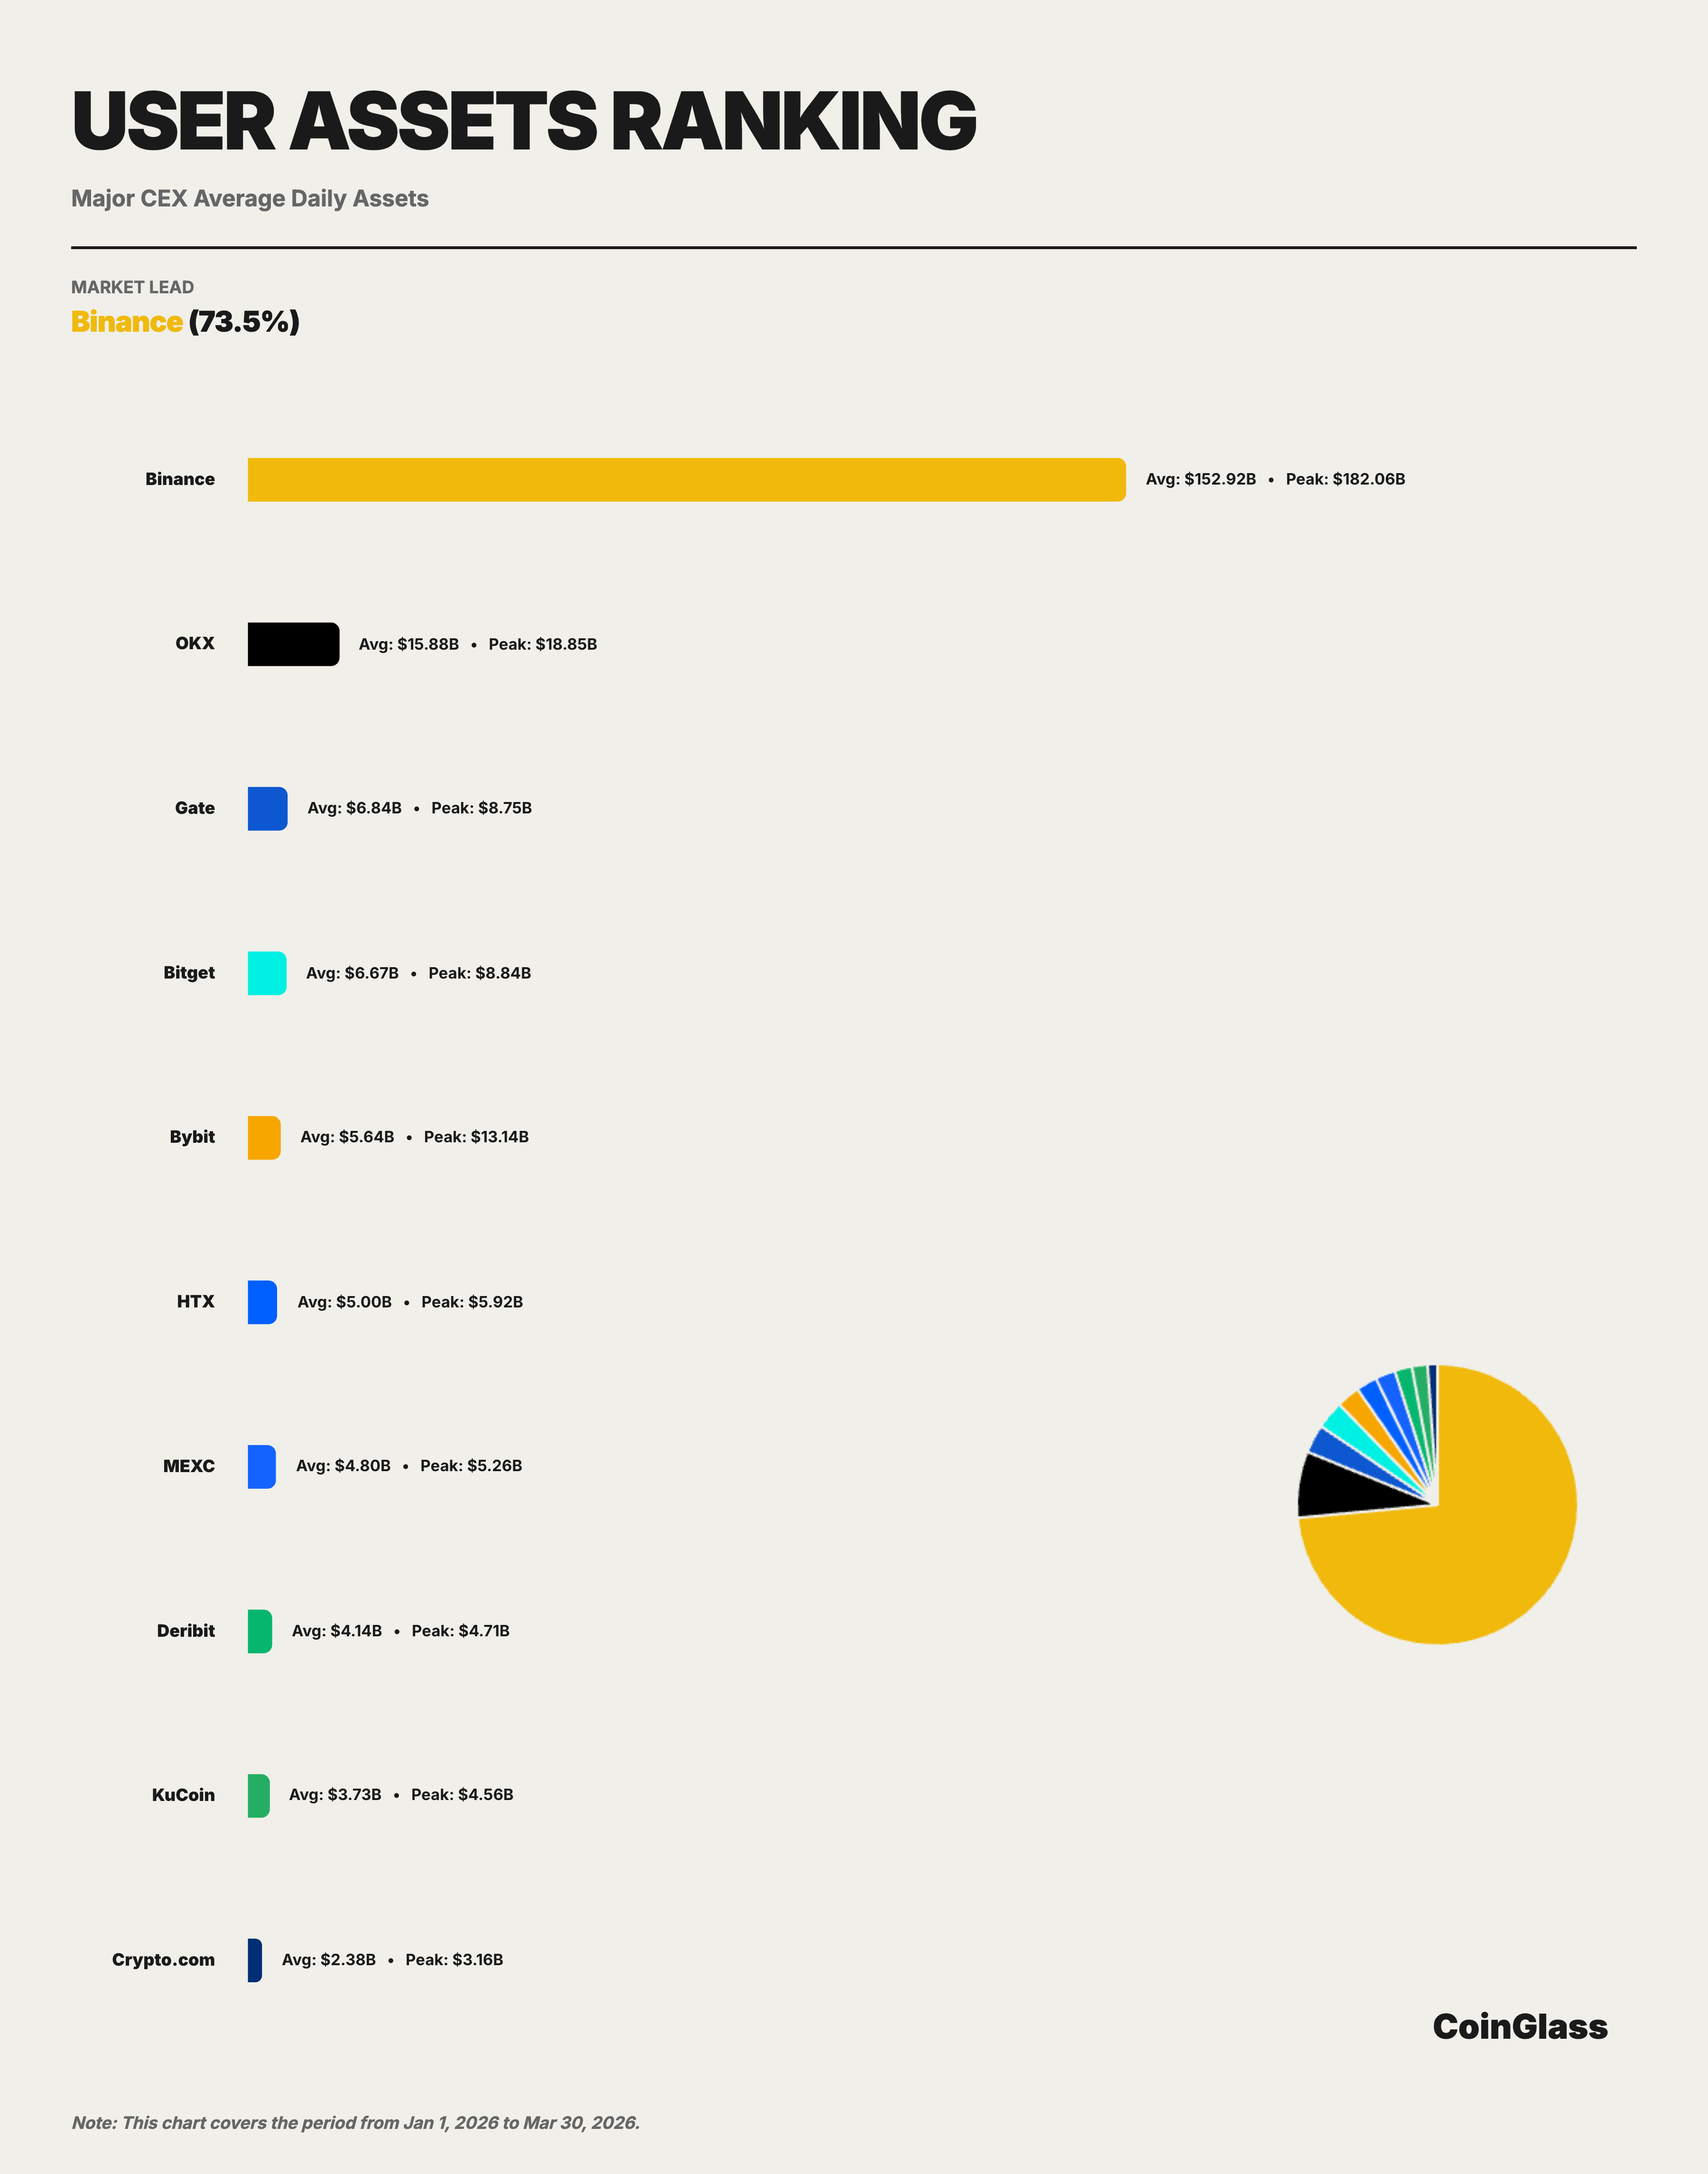
In Q1 2026, Binance’s average daily custodial assets were $152.9 billion, accounting for 73.5% of the Top 10. This is far higher than its market share in trading volume (34.9%) or open interest (29.9%), showing Binance’s dominance in asset custody. User asset holdings are closely tied to brand trust, product ecosystem, on/off-chain deposit and withdrawal convenience, and multi-service usage—making this a strong indicator of long-term platform competitiveness.
By month, Binance’s custodial assets fell early in Q1 then stabilized: $172.7 billion daily in January (the quarterly high, reflecting bullish sentiment), $136.4 billion in February (down 21%, mirroring the OI drop), and $147.8 billion in March (indicating stabilized outflows). The quarterly peak was $182.1 billion on January 15.
Top 5 platforms were Binance, OKX, Gate, Bitget, and Bybit, with average user assets of $152.9 billion, $15.9 billion, $6.8 billion, $6.7 billion, and $5.6 billion. Only OKX maintained over $10 billion after Binance; the next three clustered between $5 billion and $7 billion. The pattern is “clear leader, distant second, and a closely grouped remainder.”
5.2 Major CEX Asset Holdings Comparison
User asset concentration is far higher than for trading volume or OI. Among the Top 10, Binance’s $152.9 billion dwarfs OKX’s $15.9 billion (just 1/10th as large). Gate ($6.8 billion), Bitget ($6.7 billion), and Bybit ($5.6 billion) are similar in scale but far behind Binance—whose assets are 8x the combined total of those three. Binance’s average user assets are 9.6x OKX, 22.4x Gate, 22.9x Bitget, and 27.1x Bybit. Binance’s dominance in asset holdings is even greater than in derivatives volume or OI. This means its market position is defined not just by trading activity but by long-term capital preference. Such extreme concentration is typically more stable and harder to replicate, making Binance a de facto “systemic infrastructure” for crypto asset custody, with its operations and compliance having outsized impact on market stability.
The second tier includes HTX ($5 billion), MEXC ($4.8 billion), Deribit ($4.1 billion), KuCoin ($3.7 billion), and Crypto.com ($2.4 billion).
VI. Synthesis and Outlook
Analyzing trading volume, open interest, liquidity depth, and user asset holdings yields several key conclusions:
First, Binance’s market leadership is comprehensive and robust. It ranks first in every core metric: $4.90 trillion in derivatives volume (Top 10 share 34.9%), $23.9 billion average daily OI (29.9%), $284 million BTC futures depth (54.6%), and $152.9 billion in user assets (73.5%). More importantly, Binance’s lead in liquidity depth and asset custody far exceeds its lead in trading volume, confirming its role as core infrastructure in crypto markets.
Second, the competitive landscape in derivatives is shifting. OKX is the closest centralized challenger, primarily for derivatives volume and futures depth; Bybit is balanced across volume, OI, and spot liquidity; Gate maintains a strong presence in derivatives and OI but is weaker in asset holdings; Bitget is an important second-tier player, consistently ranking in the Top 5 for derivatives volume and OI. The derivatives market, long dominated by a few top CEXs, now faces dual disruption: from regulated institutional channels like CME, which attract hedging and basis trades, and from decentralized protocols like Hyperliquid, which appeal to high-frequency and strategy traders with censorship resistance, composability, and 24/7 uptime.
Third, the market is in a cautious recovery phase. Q1 volumes contracted month by month, and OI stabilized after a sharp drop, reflecting a post-shock recovery after Q4 2025’s extreme events. As we enter Q2, key variables to watch include: the Fed’s monetary policy direction, shifts in BTC spot ETF flows, and the rollout of regulatory frameworks across major jurisdictions.