Summary
-
The number of on-chain transactions and active addresses remains high, and interaction demand still exists, but capital and value capture capacity are beginning to concentrate in a few networks.
-
Solana continues to dominate high-frequency interactions, Base and Polygon maintain expansion, while Arbitrum, although showing a significant rebound in activity, has failed to convert it into capital retention and fee growth.
-
On-chain data for Bitcoin shows that short-term holders are generally at a loss, while long-term holders remain predominantly profitable, with no signs of systemic breakdown.
-
Three main narratives, AI Agents, supply shocks, and institutionalized DeFi, are progressing in parallel, but the ones with real sustainability are still those combined with mainnet capital inflows and credit expansion.
I. Overview of On-Chain Activity and Capital Flow
In February, market prices were clearly under pressure, but on-chain data did not simultaneously enter a state of complete stagnation. Instead, across four dimensions, transaction count, active addresses, fee revenue, and cross-chain net flows, the market entered a more granular reallocation phase: high-throughput networks continued to absorb large amounts of interaction demand, settlement layers and high-value execution layers regained capital favor, while some ecosystems that previously relied on Layer 2 valuation expansion logic began to face more pronounced capital outflow pressure. Compared with January, the core change in February lies in who is staying, who is paying, and who is being continuously allocated.
1.1 Transaction Count Analysis: Solana Continues to Lead, Base and Polygon Expand, Arbitrum Active but Unable to Retain Capital
In February, the overall transaction count across major public blockchains did not collapse significantly with the price adjustment, but instead increased on multiple chains. Solana still maintains an absolute lead, with an average of about 121.8 million daily transactions in February, an increase of about 23.4% compared with January, and a peak exceeding 160 million within the month. Its high-frequency trading and native on-chain application ecosystem continue to demonstrate strong throughput capacity. Base also continued its expansion trend, with about 11.28 million daily transactions in February, up about 15% month over month, and a mid-month peak approaching 19.59 million. Light interaction and new asset issuance scenarios continue to generate usage demand. Polygon PoS recorded a more notable increase, with about 7.91 million daily transactions, up about 33.1% month over month. Supported by the super application Polymarket, its low-cost execution environment shows resilience during periods of declining risk appetite.
It is worth noting that although Arbitrum’s transaction count rose significantly from a daily average of 2.28 million in January to 4.41 million, an increase of about 93.0% month over month, this activity did not translate into capital retention or fee improvement, indicating that part of the interaction is more like phased event-driven behavior rather than high-stickiness ecosystem accumulation. The Ethereum mainnet continues to maintain a high-value and low-frequency structure, with about 2.21 million daily transactions in February, only a slight decline of 2.1% month over month. Bitcoin recorded about 469,000 daily transactions, up about 19.9% month over month, but this does not represent a change in network usage patterns.
Overall, in February, Solana maintained absolute high frequency, Base and Polygon continued expanding, Arbitr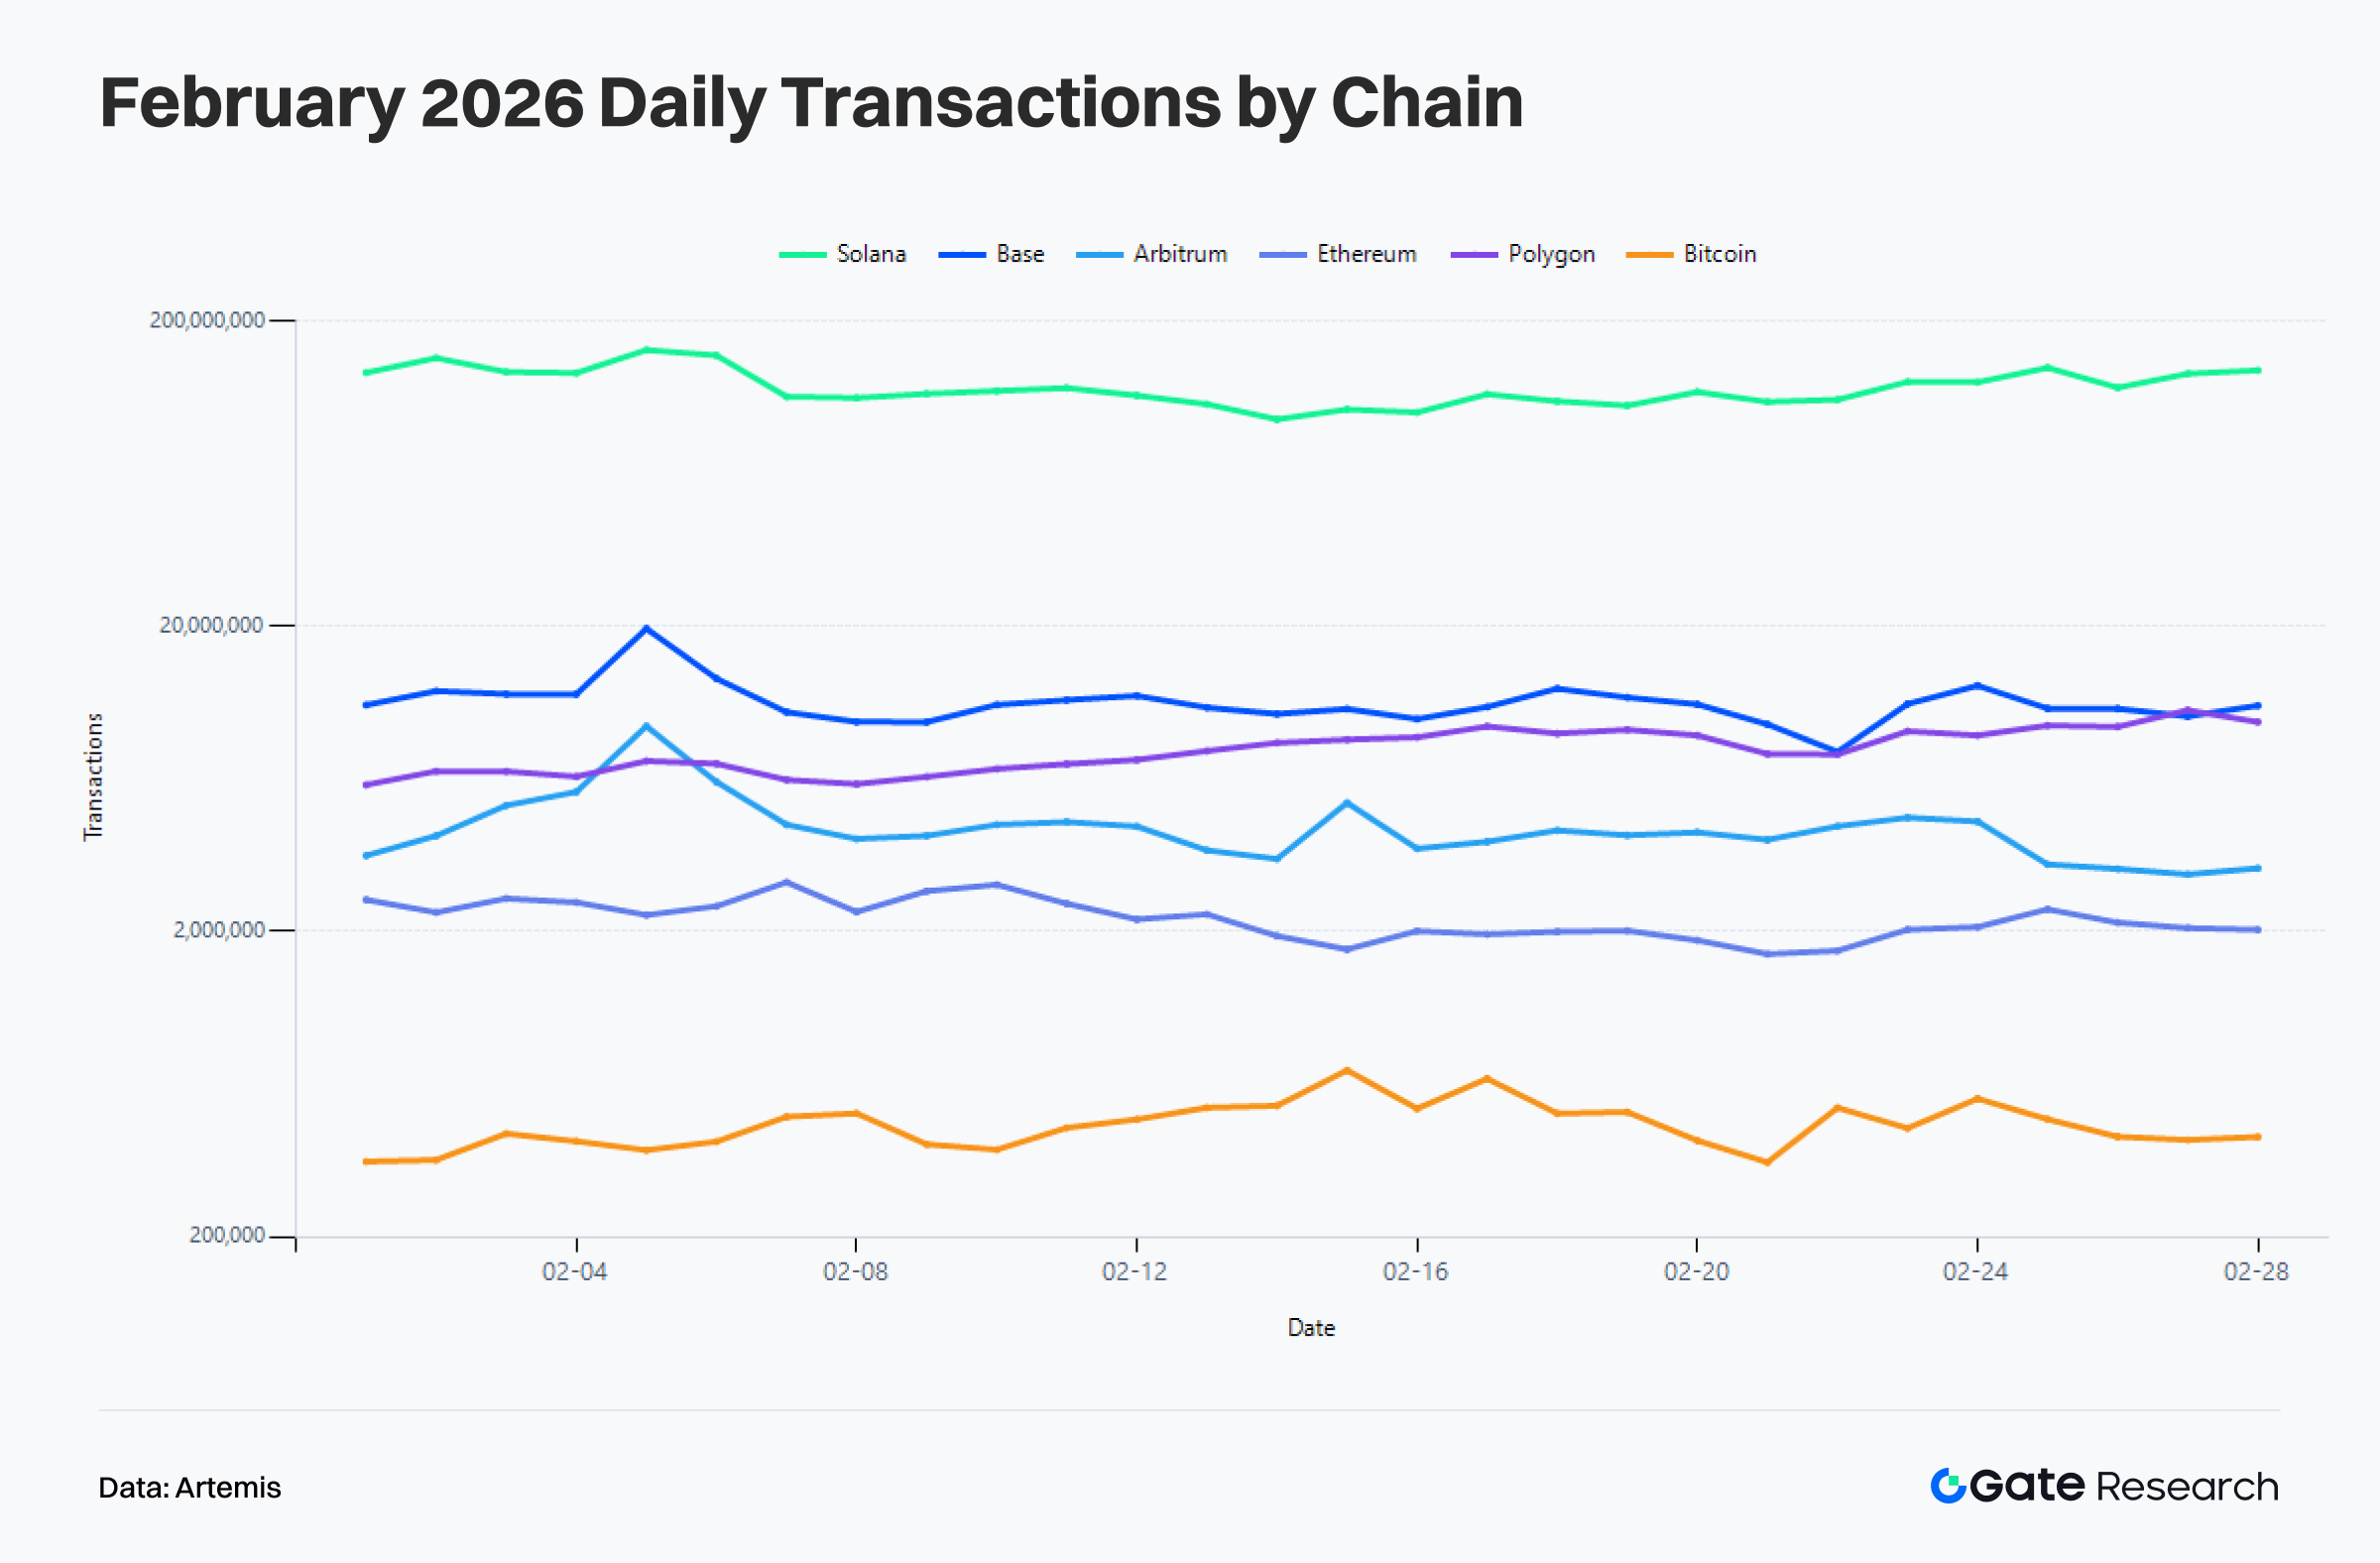 um saw a recovery in activity but lacked stickiness, and Ethereum maintained its settlement role.
1.2 Active Address Analysis: Users Have Not Disappeared but Are Shifting from Broad Participation to More Efficient Core Networks
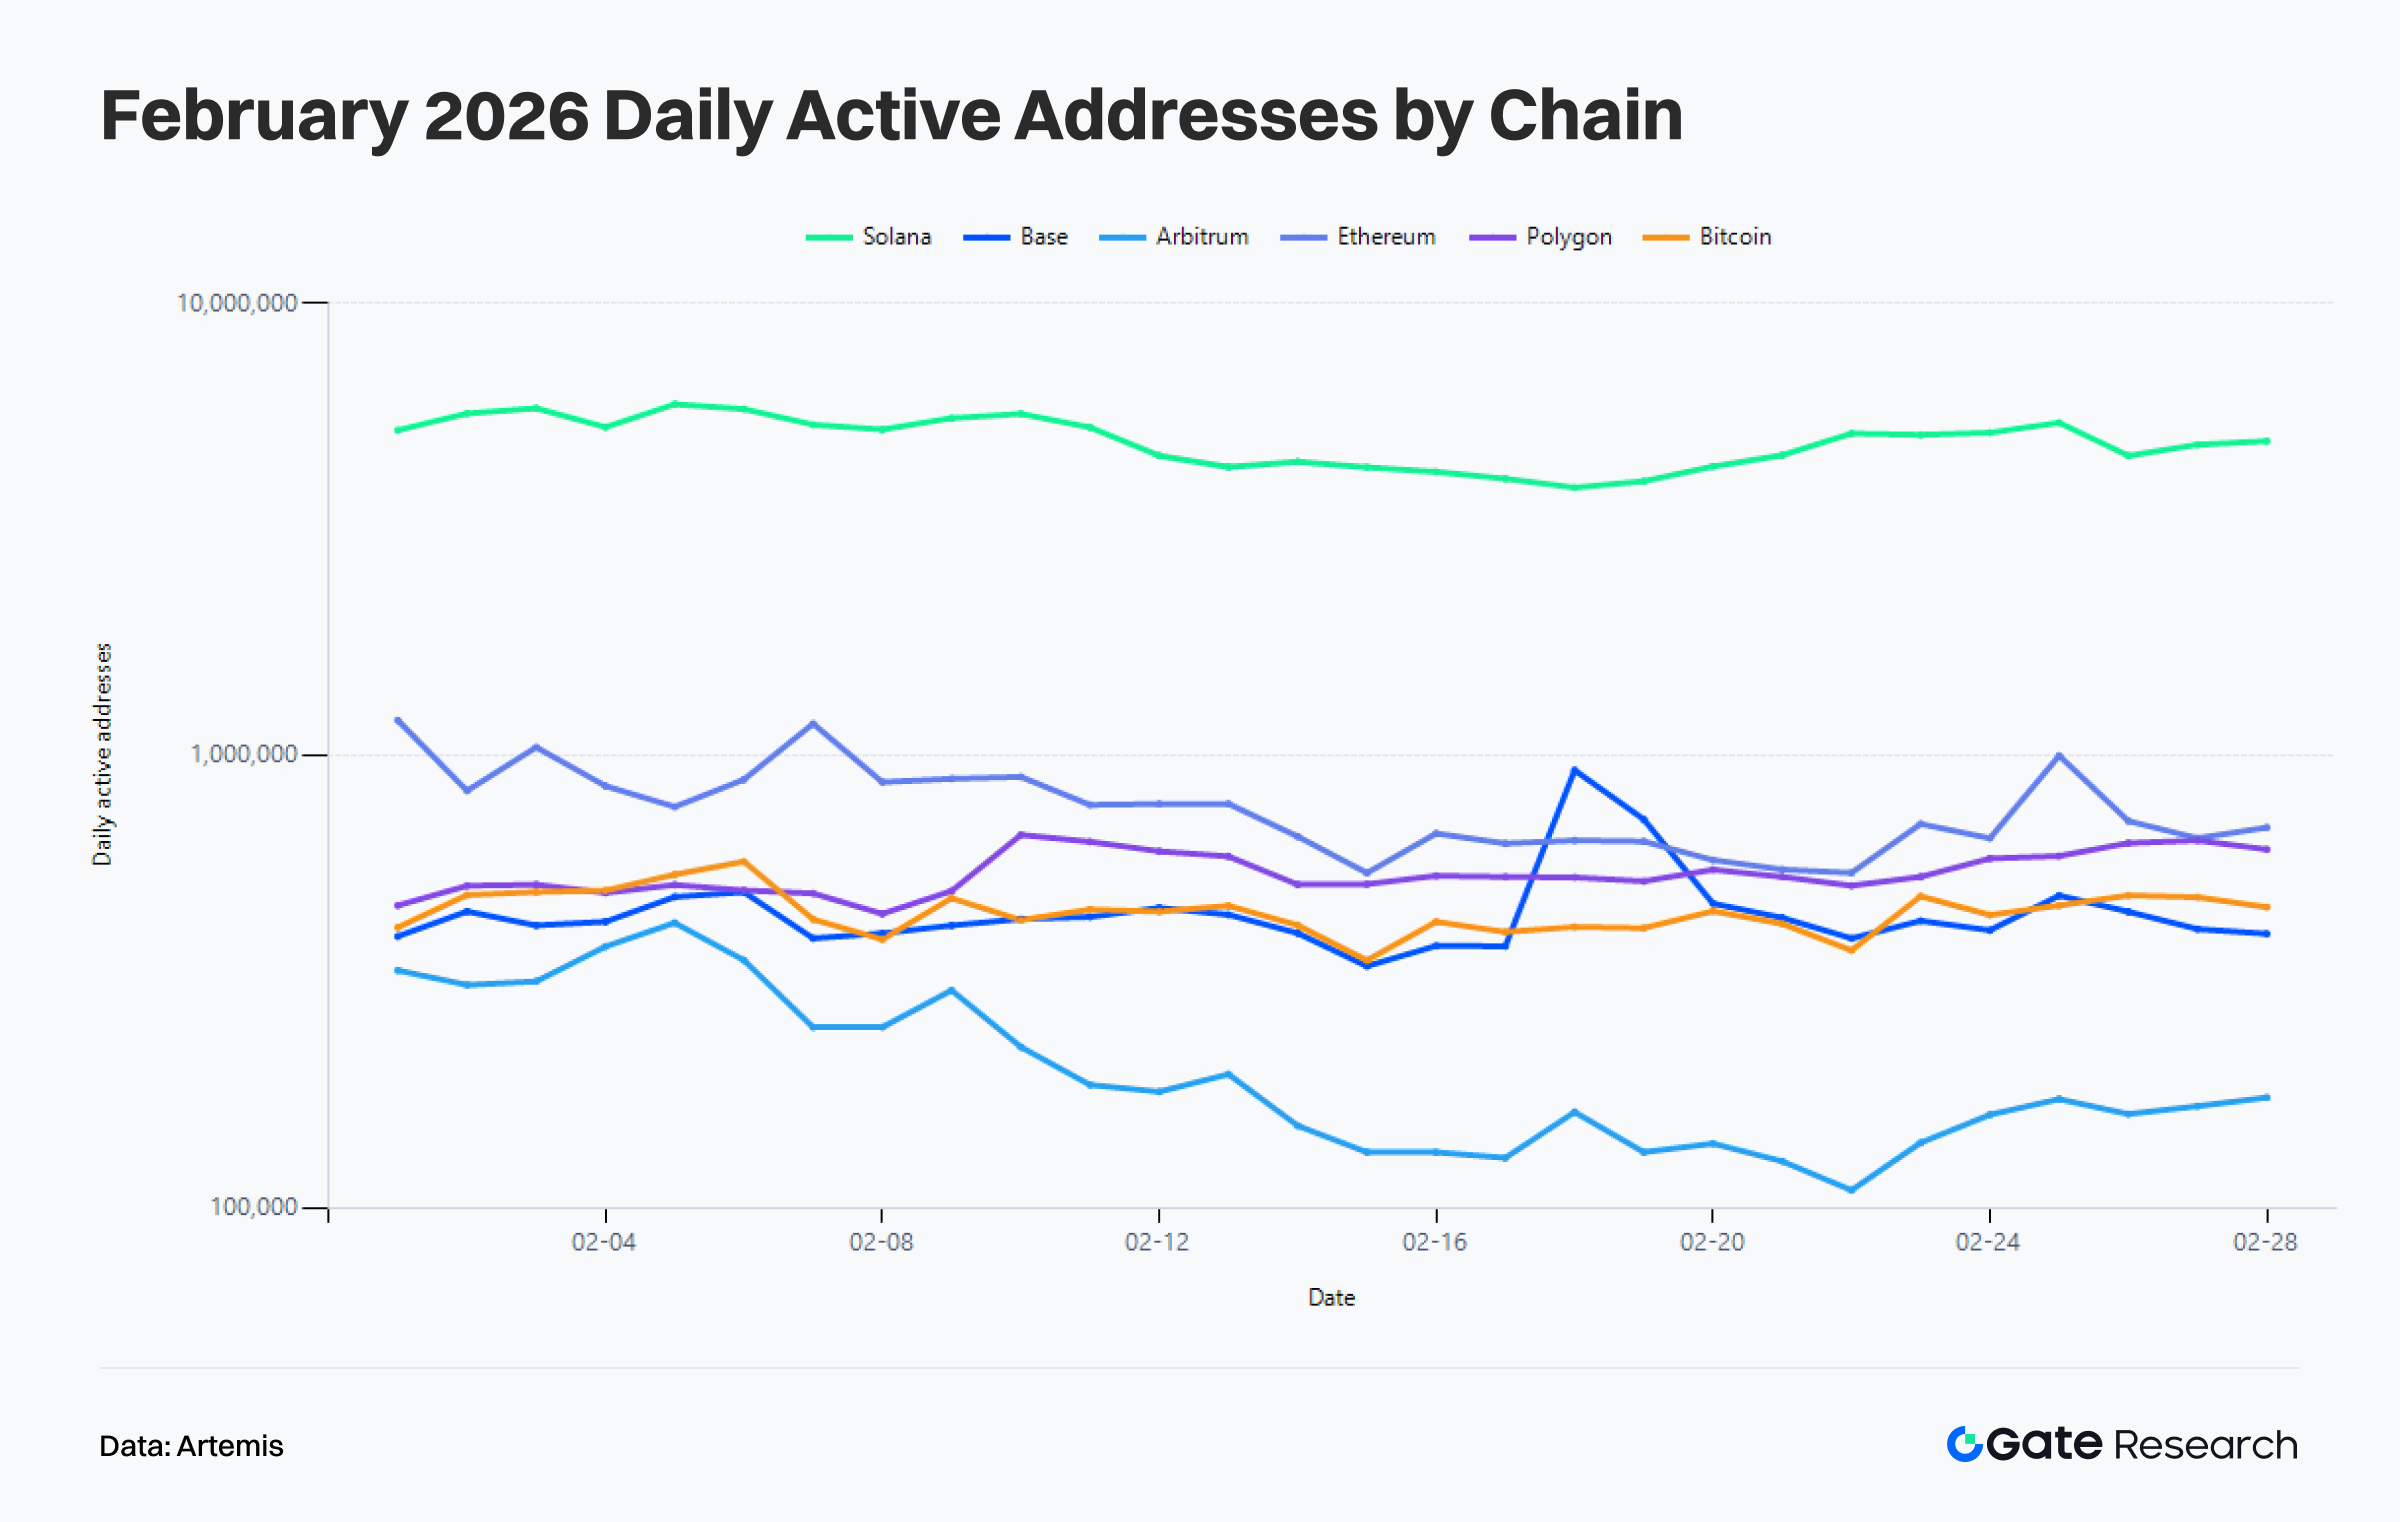
From the perspective of active addresses, on-chain user behavior in February shows a more pronounced stratification than transaction counts. Solana recorded about 4.96 million daily active addresses in February, continuing to grow by about 11.2% compared with January, remaining the strongest user aggregation network among all major chains. Polygon PoS had about 550,000 daily active addresses, up about 6.1% month over month. Arbitrum reached about 211,000, up about 14.8%, while Bitcoin had about 452,000, with a slight increase of about 1.7%. High-frequency usage and value transfer activities have not left the chain, but are becoming more concentrated in networks with clearer functional boundaries.
In contrast, Ethereum and Base saw their daily active addresses decline to about 774,000 and 454,000, down about 5.6% and 8.7% respectively compared with the previous month. This indicates that February was not a uniform cooldown across all chains, but rather a retreat of some lightweight addresses and short-term users previously driven by narratives, while those that remained are more inclined toward high-value coordination, high-frequency trading, or clear application demand.
Overall, compared with January, the transaction frequency and capital quality behind each active address improved in February. The rise in transaction counts without a corresponding expansion in active addresses also suggests that on-chain activity is increasingly driven by high-intensity users rather than low-barrier, scattered participants.
1.3 Fee Revenue Analysis: Ethereum and Base See Improved Value Capture While Solana Remains Highly Active with More Moderate Fees
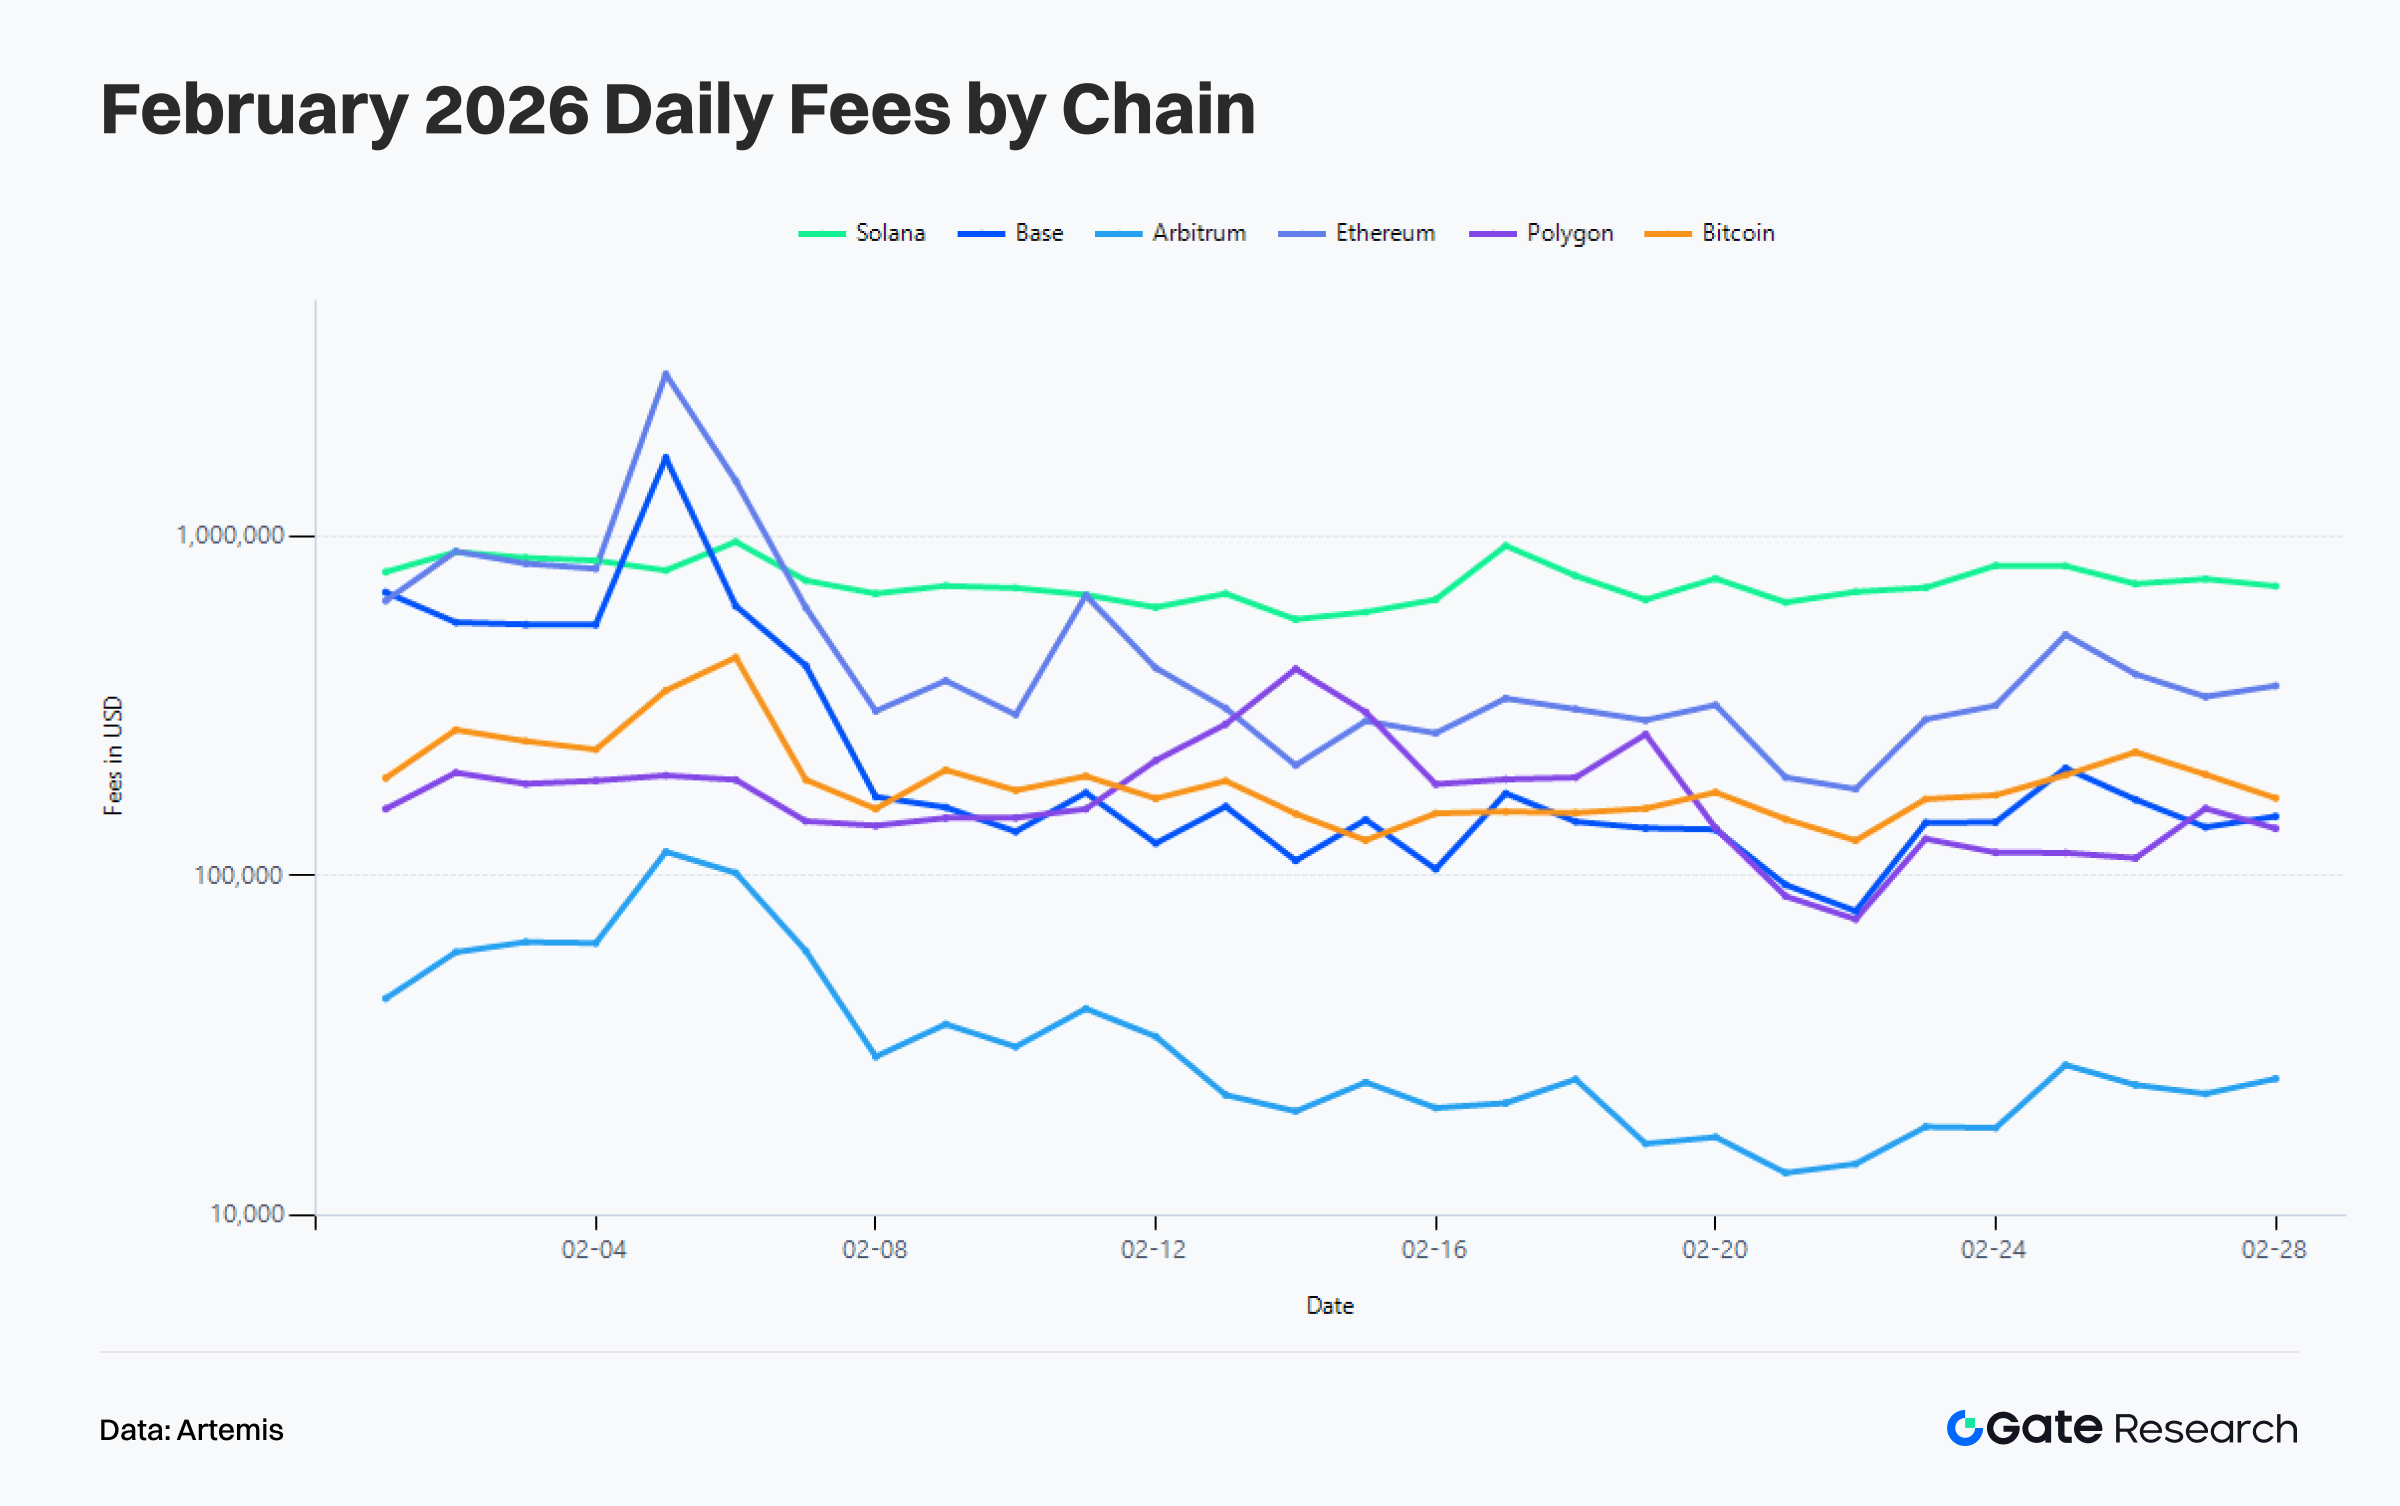
The divergence in fee revenue is more informative, as it directly reflects a network’s ability to price real demand. Solana recorded about $742k in average daily fees in February. Although it remains in the top tier, this represents a decline of about 23.2% compared with January. High-frequency interactions are still strong, but the value density per transaction and congestion premium have decreased. Ethereum shows the opposite trend, with average daily fees rising to about $544k in February, up about 20.4% month over month, and peaking above $3.01M during the month. This reflects that during periods of increased market volatility, the mainnet has taken on more high-value contract operations, asset coordination, and liquidation activities.
Base shows the most notable expansion in fees. Its average daily fees in February reached about $289k, an increase of about 53.7% compared with January. Although there was a clear decline toward the end of the month, its overall value capture capacity has significantly improved compared with January. Polygon PoS also increased from about $124k to $178k, up about 43.2% month over month. Arbitrum remained roughly flat at around $36k, while Bitcoin declined from about $232k to $197k.
Overall, the fee structure in February conveys a clear message to the market: not all high-activity networks can convert traffic into revenue at the same time. The real beneficiaries are those that can support high-value activities or maintain pricing power during periods of heightened demand. Solana preserved its activity, while Ethereum and Base more clearly preserved value.
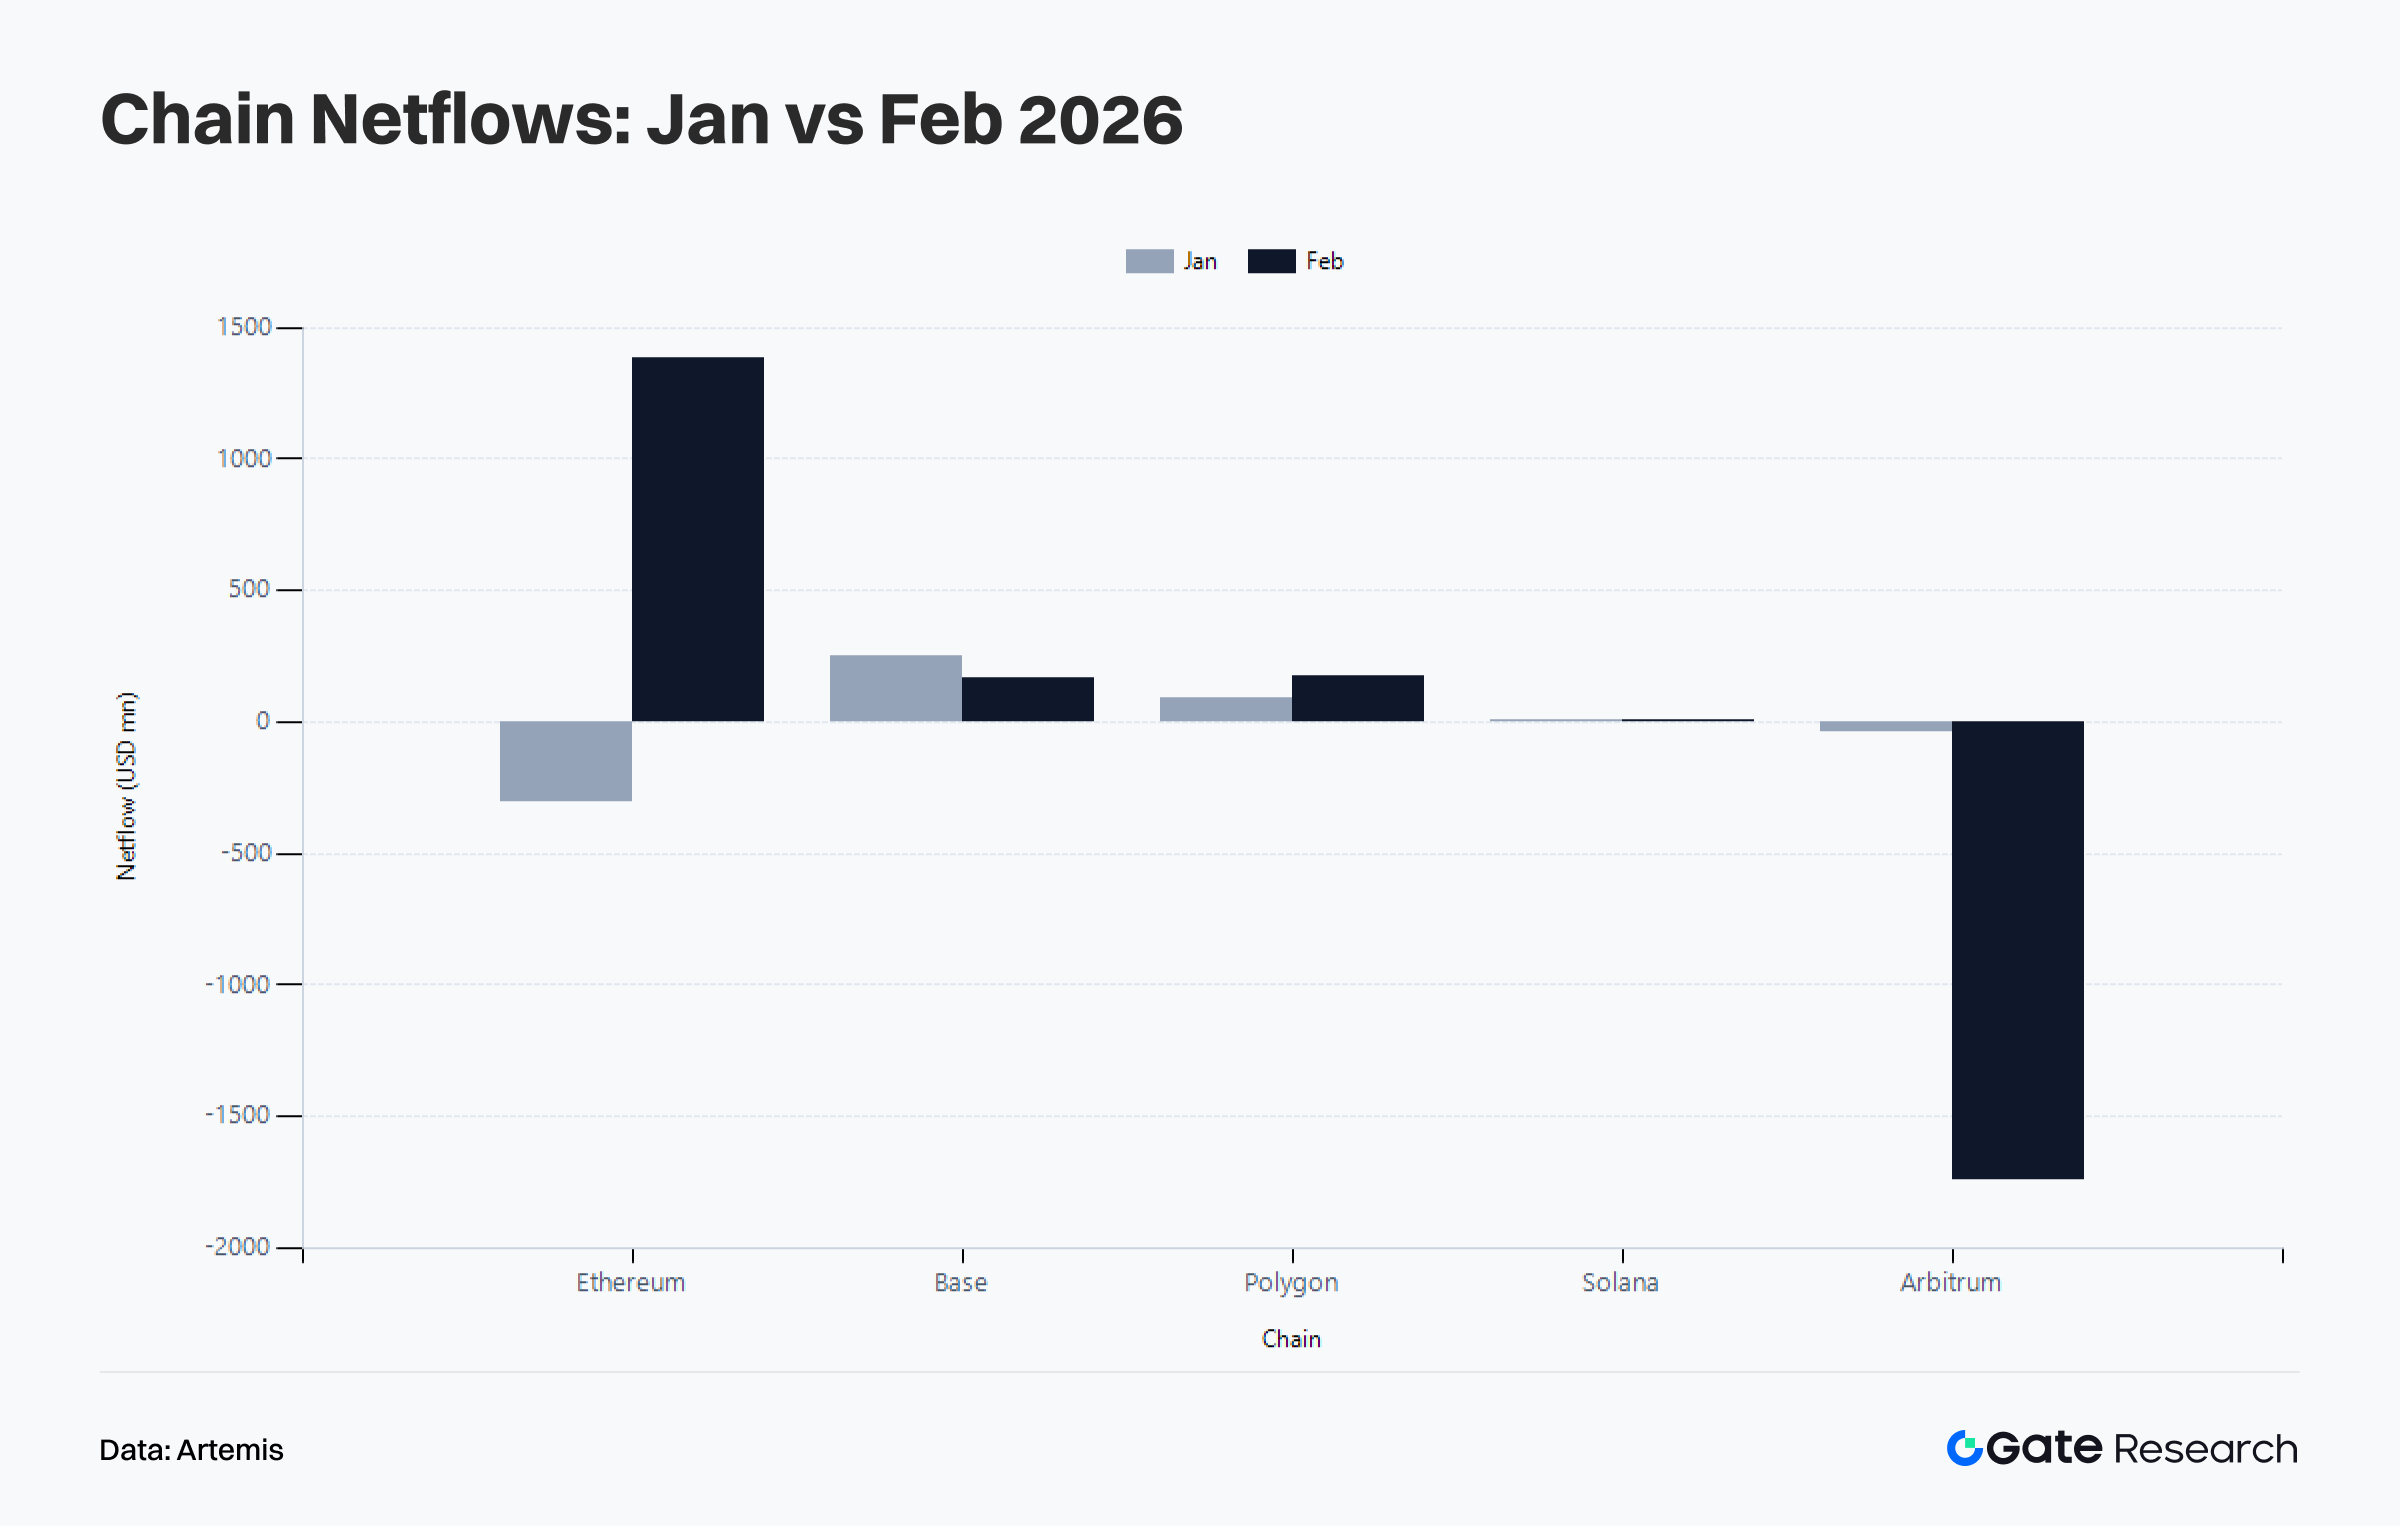
1.4 Public Chain Capital Flows: Ethereum Reverses from Net Outflow to Core Inflow Hub While Arbitrum Becomes the Main Drain
Capital flows are the most important structural signal in February. In January, Ethereum was still in a net outflow state of about $305M, but in February, it directly shifted to a net inflow of about $1.386B, becoming the core network absorbing returning capital in this cycle. This change may indicate that Ethereum’s role as the primary chain for tokenization of macro assets such as gold and silver has further strengthened amid macro volatility, and that market capital, under pressure from crypto prices, has not simply exited on-chain, but instead returned to the main settlement network with capabilities for macro asset exposure and large-scale capital coordination.
At the same time, Arbitrum’s net outflow sharply expanded from about $41.01M in January to about $1.742B in February, making it the most significant capital drain in this cycle. Although Base still maintained net inflows, the scale narrowed from about $253M in January to about $170M in February, indicating that it continues to absorb narrative-driven capital, but its phase of dominating attention has passed. Polygon PoS saw its net inflow increase from about $90.07M to about $177M, while Solana also rose slightly from about $3.59M to about $9.21M.
Overall, capital flows in February can be summarized as a shift from broad Layer 2 dispersion back to higher-certainty networks focused on main settlement and efficient macro asset transactions, reflecting more mature capital behavior as risk appetite cools.
II. Bitcoin Key Metrics Analysis
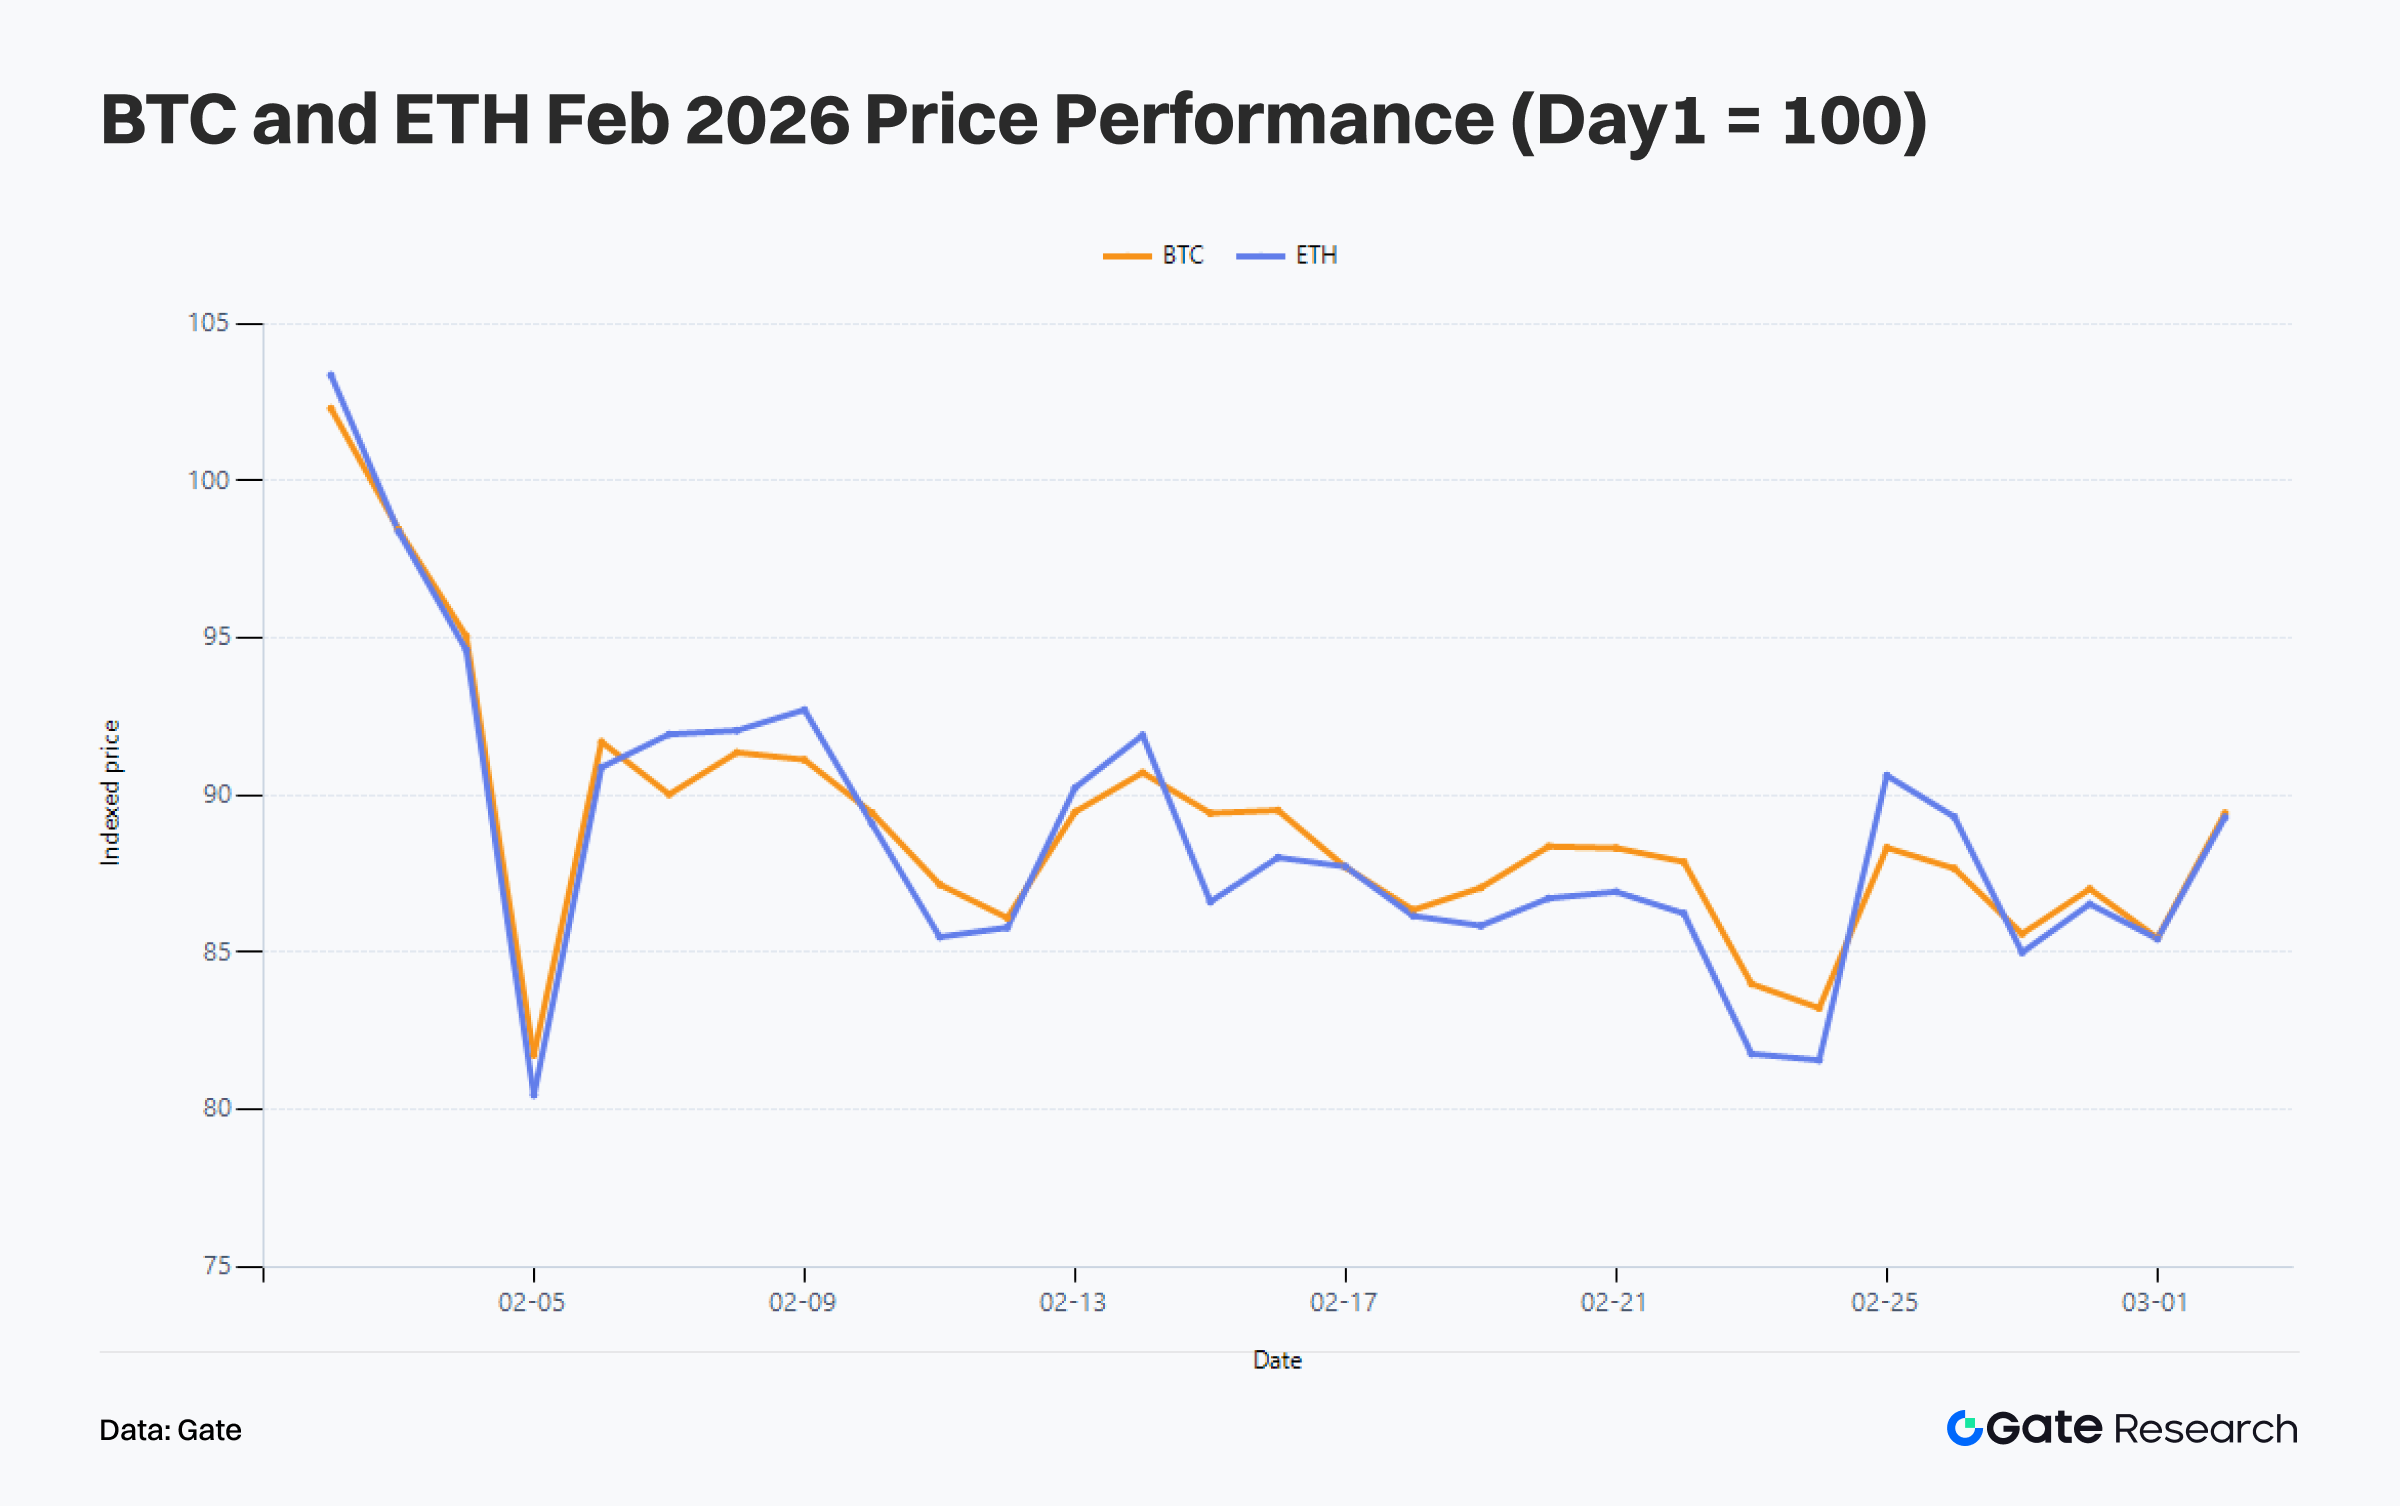
In February, the price structures of BTC and ETH weakened simultaneously. Using a normalized value of 100 at the beginning of February, BTC declined to about 85.5 by the end of the month, while ETH fell to about 85.4, with both experiencing a drawdown of around 14.5%. This indicates that the February decline was part of a broader risk asset pullback. The difference is that ETH showed weaker elasticity during rebounds, while BTC’s structure is more consistent with a pullback from higher levels followed by the search for a new medium-term equilibrium range. This aligns with on-chain indicators, which reflect short-term capital pressure while the long-term structure remains intact.
Glassnode data shows that after entering March, BTC’s Short-Term Holder MVRV (STH-MVRV) is 0.866, still below 1. Short-term holders as a whole remain below their cost basis, essentially meaning that the February correction has pushed a considerable portion of high-entry-position holdings into an unrealized loss zone. During the same period, the Realized Profit/Loss Ratio is 0.948. Being below 1 indicates that realized losses on-chain still slightly exceed realized profits, and the market has not yet returned to a phase where profits can be consistently realized.
In terms of holder structure, 59.8% of Long-Term Holder supply remains in profit, while only 3.5% of Short-Term Holder supply is in profit. Market pressure still mainly comes from short-term holdings. Although long-term capital is also experiencing volatility, there has not been a large-scale weakening.
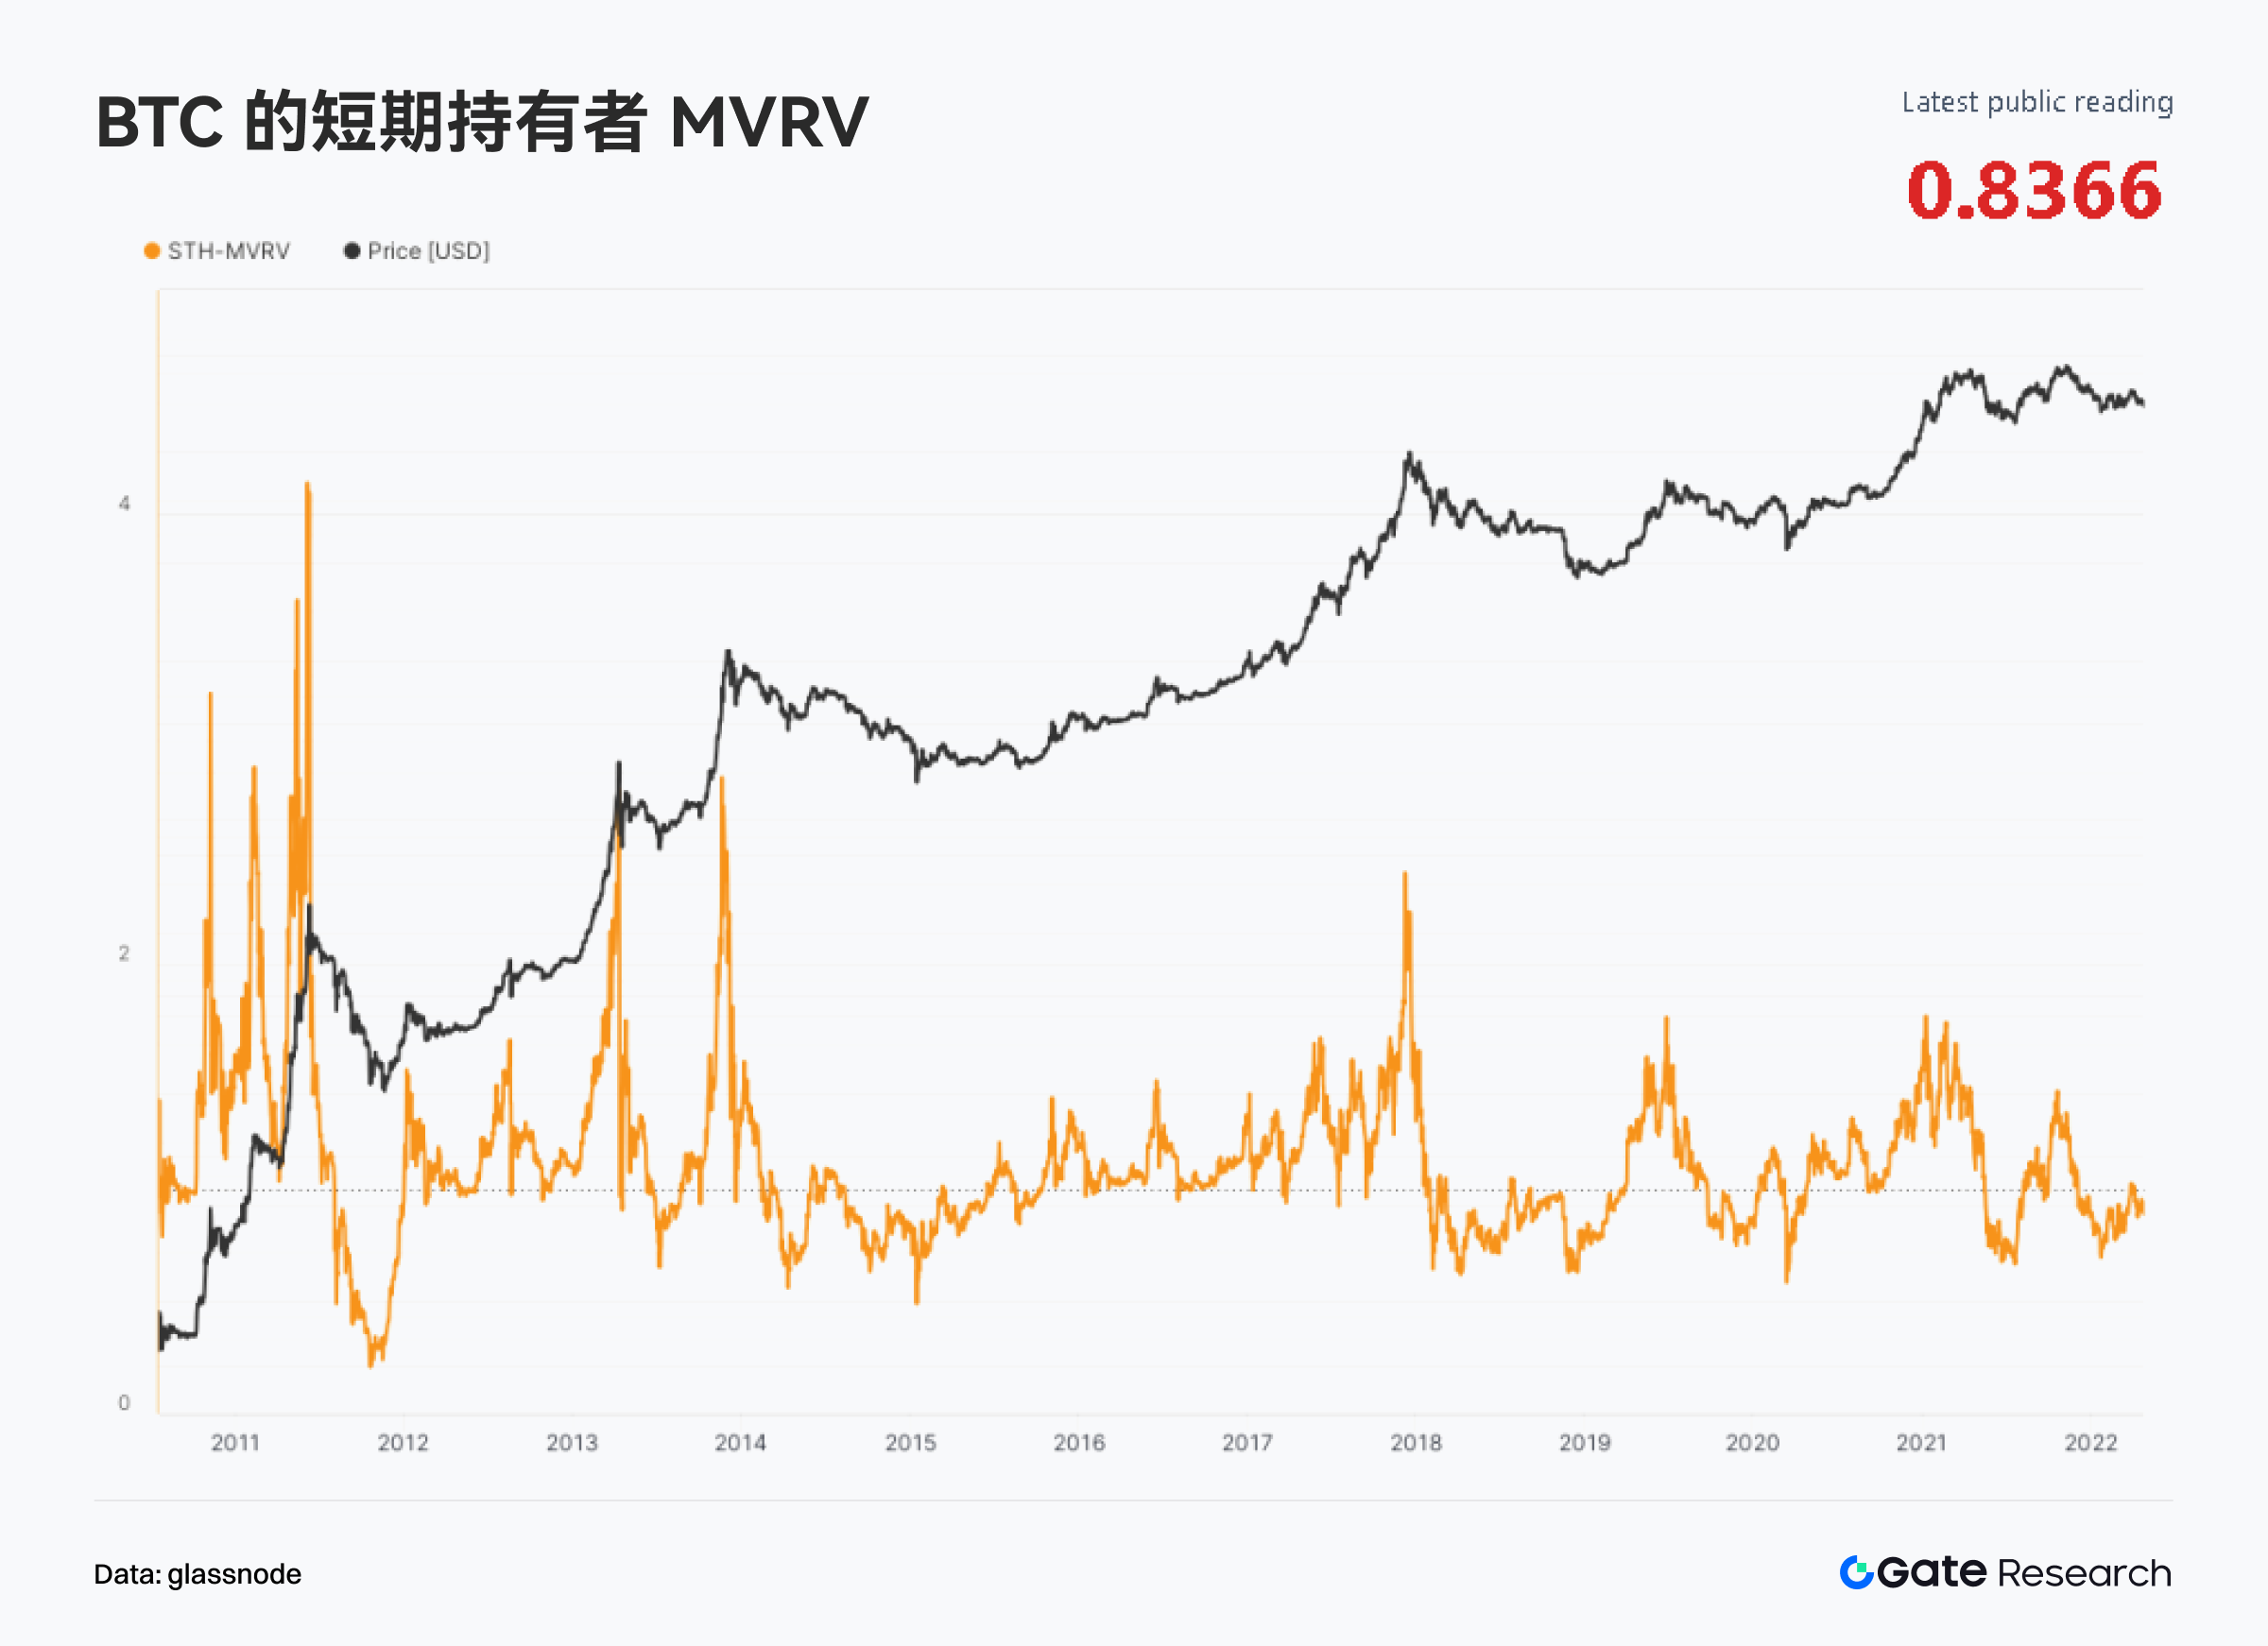
Overall, the market weakness in February represents a rebalancing and shakeout within a medium-term trend, rather than a systemic breakdown driven by a collective loss of confidence among long-term holders. Price pullbacks, the expansion of short-term unrealized losses, and the slowdown in profit-taking together typically correspond to a cooling-off at higher levels and a rebalancing shakeout, and do not necessarily indicate the confirmation of a full bear market. As long as long-term holders continue to maintain a profit-dominant position and selling pressure does not spread to a broader base of long-term holdings, BTC’s medium-term structure remains resilient. The key question for March is how long the market will need to absorb the short-term trapped positions and sentiment damage left by February, which will constitute resistance to further upside.
III. Trending Sectors and Token Dynamics
3.1 Overview of Trending Sectors: AI Agents, Supply Shock, and Institutional DeFi Moving in Parallel
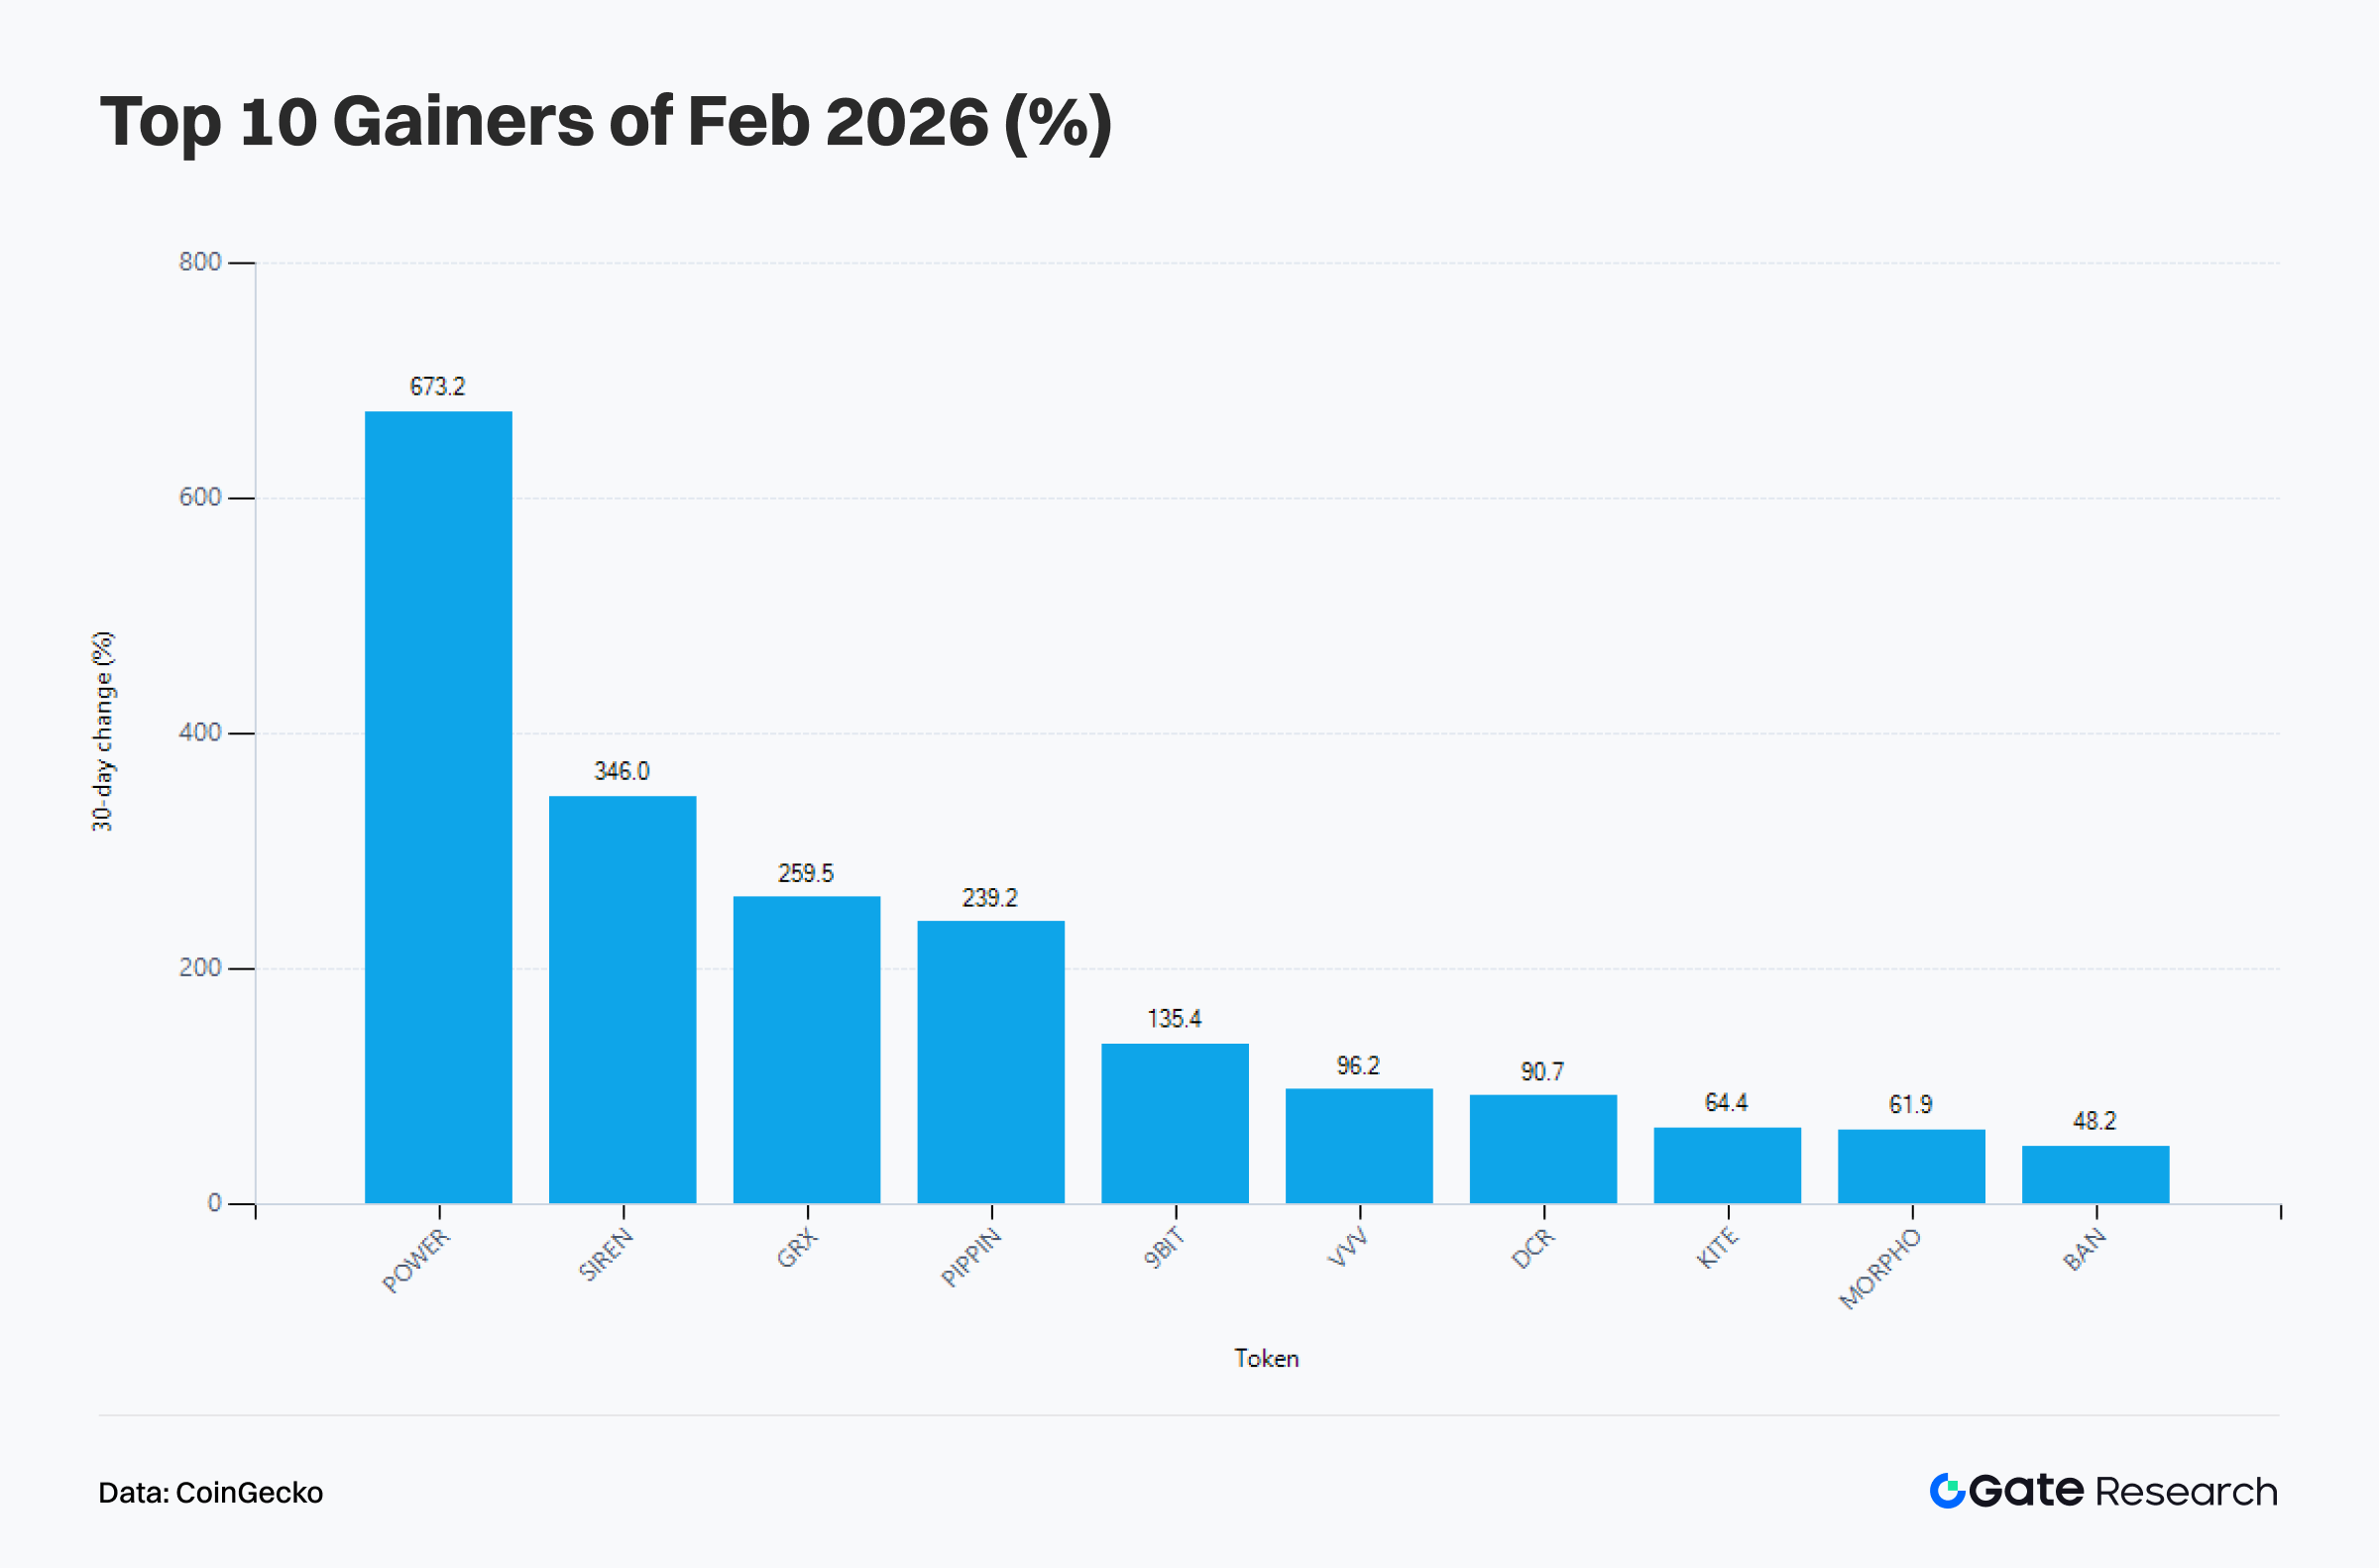
According to CoinGecko data, the top ten best-performing tokens in February did not come from a single narrative, but instead reflected three main types of catalysts: AI Agent and Compute, supply-side contraction, and institutional DeFi. Leading tokens on the list such as POWER, SIREN, GRX, and PIPPIN show clear characteristics of supply shock or AI-driven narratives, while MORPHO continues to rank among the top as a representative of institutional DeFi. As BTC and ETH faced price pressure and major large-cap assets lacked upward elasticity, capital did not fully exit the market, but instead shifted from large-cap beta to narrative-driven assets with stronger structural catalysts.
However, when combining the top gainers list with cross-chain capital flows, it becomes clear that true sustainability does not lie solely in sentiment-driven supply shocks. Ethereum became the largest net inflow chain across the market again in February, while Base continued to maintain positive net inflows. Ultimately, the market allocated more medium-term capital to networks capable of supporting macro assets, credit intermediation, collateralized lending, yield generation, and asset issuance. AI and supply shocks amplified profit elasticity in February, but the sectors that truly support medium-term allocation logic remain institutional DeFi and high-efficiency execution layers, which are more capable of retaining capital.
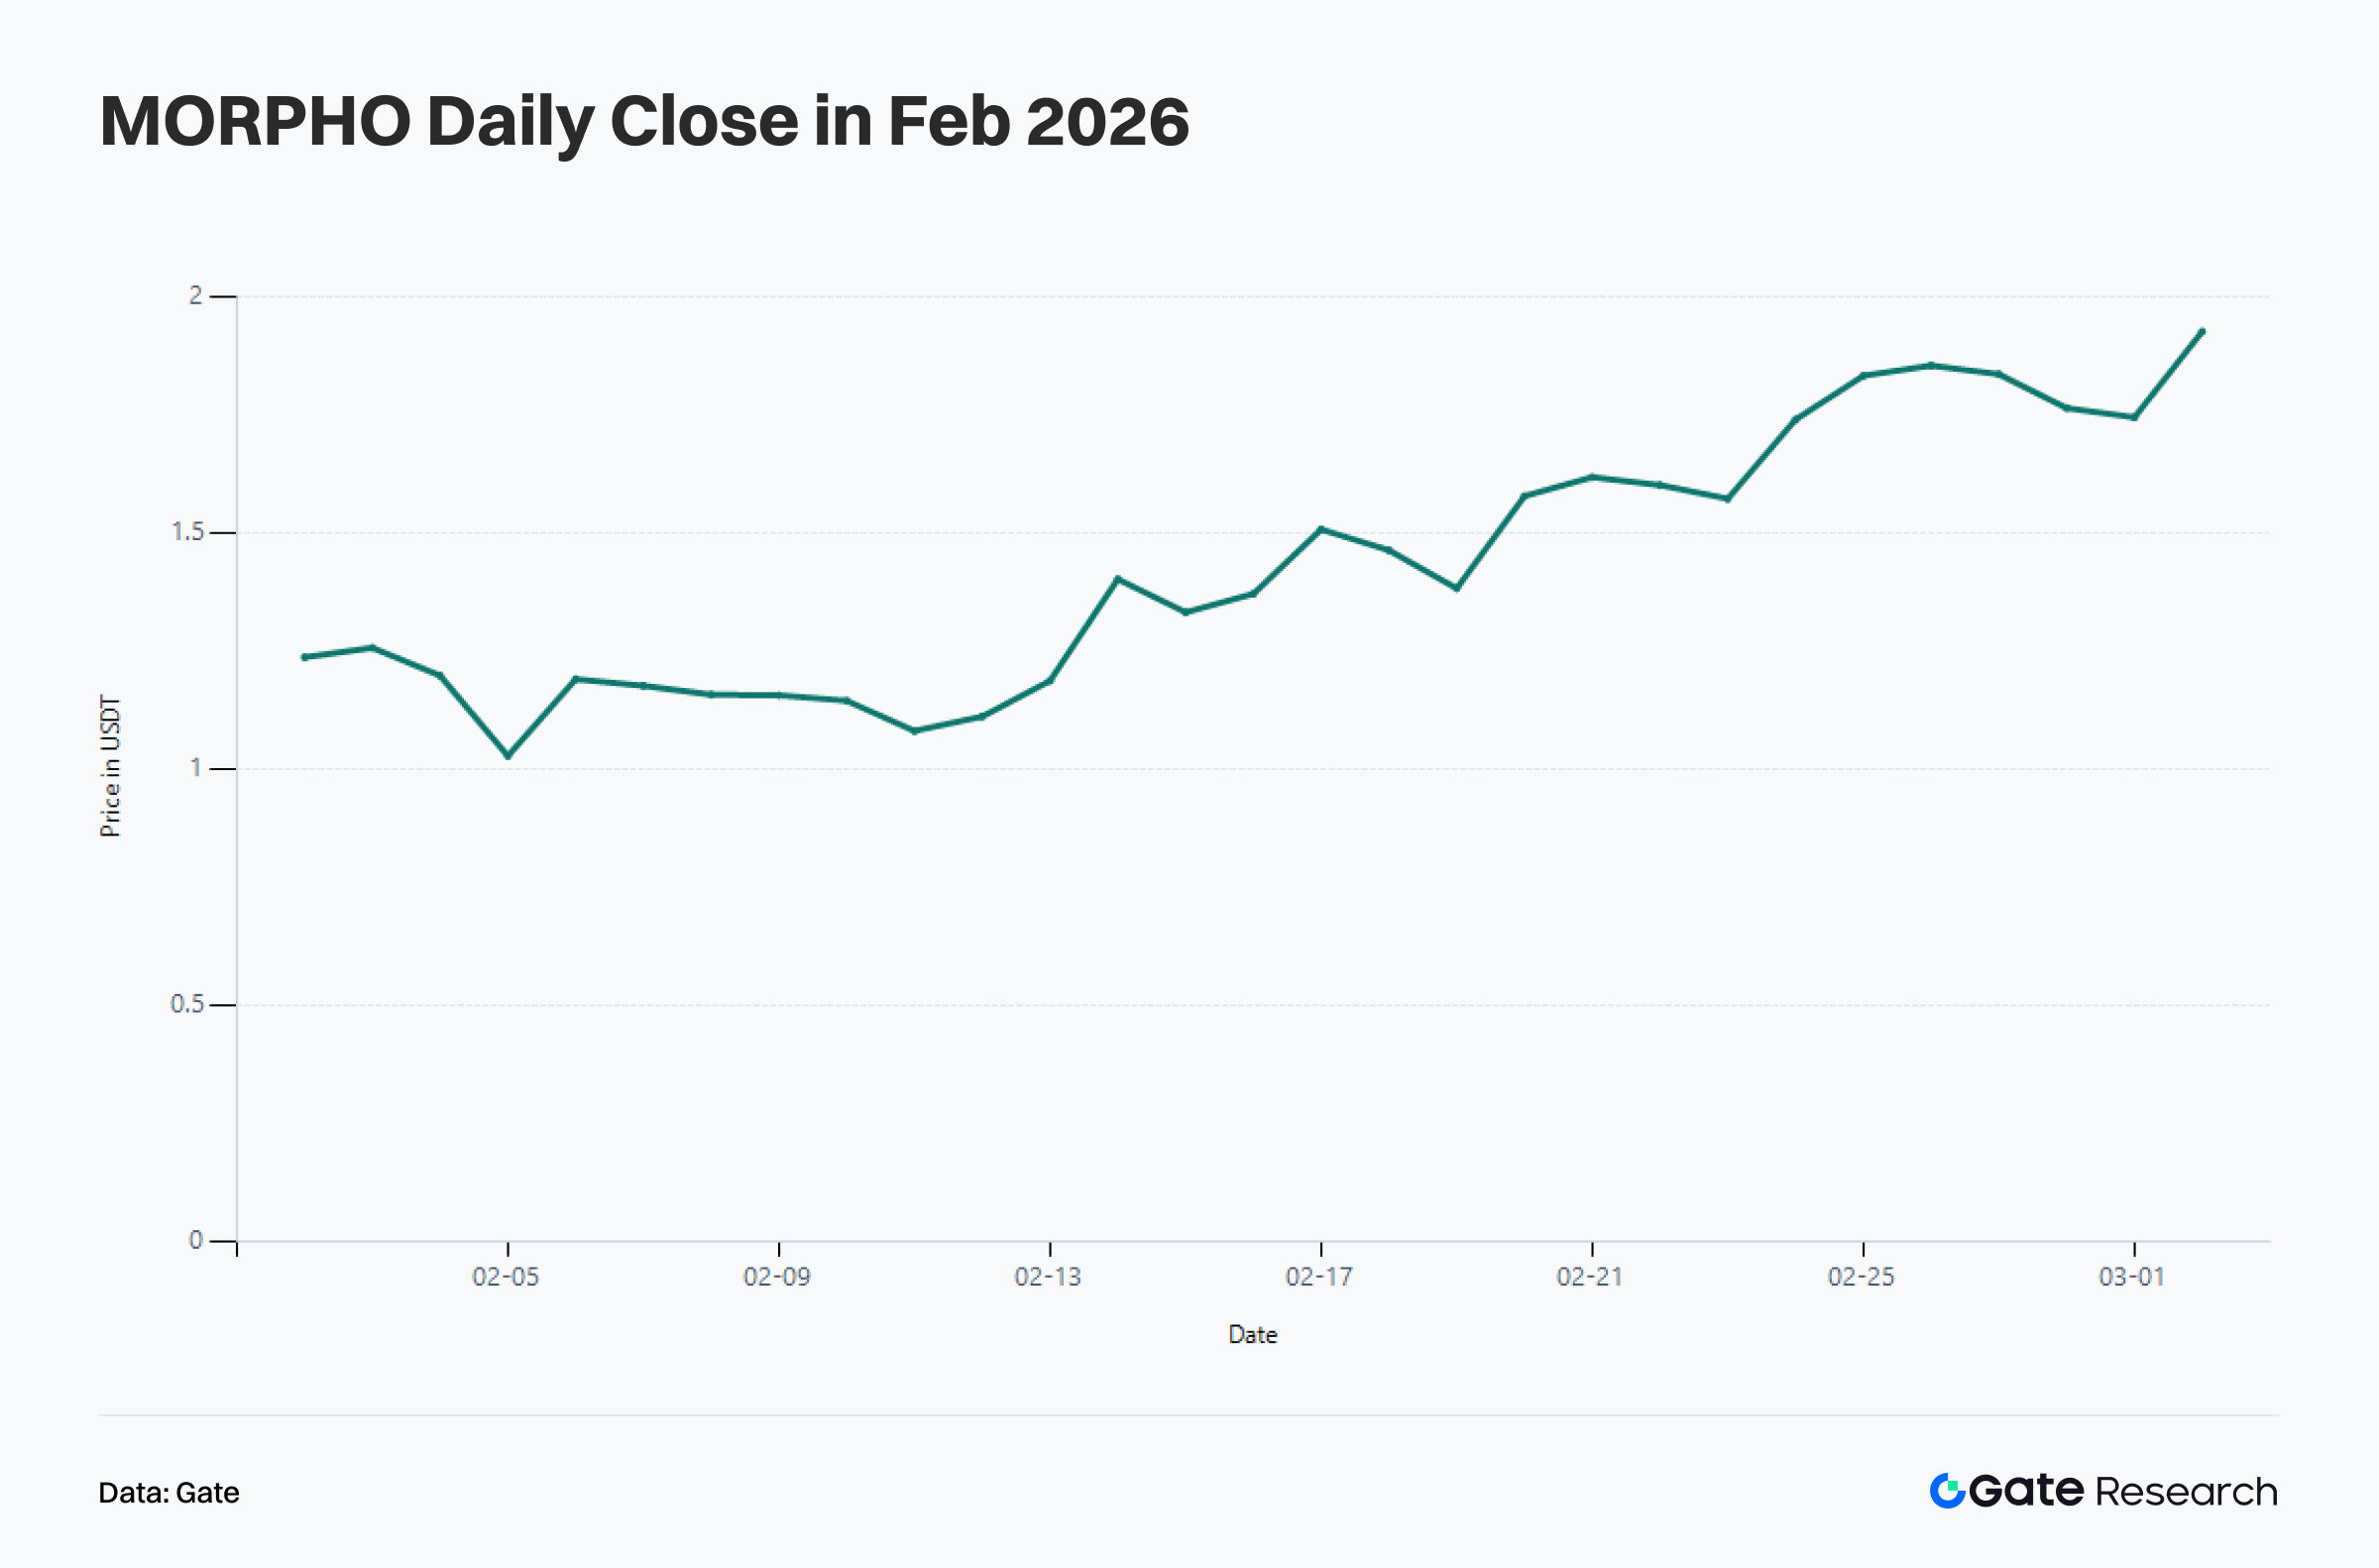
3.2 Overview of Trending Tokens: MORPHO’s Strength Driven by Repricing of Institutional DeFi Beta
Among the February rankings, MORPHO entered the top ten with a monthly gain of about 61.85%, making it one of the few tokens not driven purely by sentiment-based supply shocks, but supported by clear fundamental logic. Its rise is attributed to continued integration by the compliant exchange C*** and increasing institutional interest in fixed-rate and fixed-term lending products. This aligns closely with Ethereum’s shift from net outflows to net inflows in February, as the expansion of institutional DeFi fundamentally requires a main settlement network with stronger asset capacity, a more stable liquidation environment, and deeper liquidity.
From a price structure perspective, MORPHO did not experience a straight-line rally in February, but instead went through a more complete trend progression, including an early-month pullback, mid-month acceleration, and late-month high-level consolidation. The price center gradually moved from around 1.1 USDT to the 1.8 to 1.9 USDT range. Capital did not enter in a one-time surge, but continued to accumulate along the rhythm of narrative confirmation, increasing trading volume, and rising price levels. Unlike single-point explosive moves typical of meme tokens, this type of price action is more consistent with the gradual repricing of a sector beta asset by medium-term capital.
If Ethereum’s capital inflows continue in the future, assets like MORPHO, which focus on capital efficiency and institutional lending, are still likely to benefit. However, if the mainnet capital inflow weakens after February, it could easily enter a phase of high-level valuation digestion. This is because MORPHO’s core variable is not short-term sentiment, but whether the expansion of institutional credit and on-chain lending demand can be sustained. This gives it a stronger fundamental anchor than purely trend-driven meme tokens in the current market, but also means its performance is more directly constrained by the mainnet capital environment and DeFi risk appetite.
IV. Summary
In February, the most important feature of the on-chain market was the rebalancing and rotation of activity and capital. Transaction counts, active addresses, and fee revenue collectively indicate that real on-chain usage has not contracted overall, but has instead continued to concentrate in more efficient networks. Solana maintained absolute high frequency, Base and Polygon continued expanding, while Ethereum further reinforced its role as a high-value settlement layer and macro asset layer. From the perspective of cross-chain capital flows, the market has clearly shifted from the broad Layer 2 expansion logic to a more defensive reallocation toward main settlement networks and a few high-efficiency execution layers.
At the Bitcoin level, the February price decline did push short-term holders back into unrealized losses, but Glassnode indicators suggest the market is closer to a phase of rebalancing and position rotation rather than a long-term structural breakdown. Short-term capital is under pressure and profit realization capacity has weakened, but long-term holders still dominate the profitable supply.
At the sector and token level, the strongest assets in February did not belong to a single narrative. AI Agents, supply shocks, and institutional DeFi coexisted as three main themes, but those more likely to form a medium-term allocation logic are still the directions that align with mainnet capital inflows, credit expansion, and real usage demand. Following this logic, the on-chain market has entered a phase of refined competition over who can absorb capital, retain user interactions, and convert activity into revenue.
References:
Gate Research is a comprehensive blockchain and cryptocurrency research platform that provides deep content for readers, including technical analysis, market insights, industry research, trend forecasting, and macroeconomic policy analysis.
Disclaimer
Investing in cryptocurrency markets involves high risk. Users are advised to conduct their own research and fully understand the nature of the assets and products before making any investment decisions. Gate is not responsible for any losses or damages arising from such decisions.