There is a type of address on Polymarket that does not bet on directions, does not follow orders, places 34 trades per minute, 24/7 nonstop. Total profits have exceeded $1.13 million.
I analyzed 3,379 trades within the peak 100-minute period to reveal how a professional market-making bot operates, how it profits, and how it incurs losses. You can directly view this bot’s homepage and read along.
Basic Facts About the Bot
This address (0x1979…7c9d) maintained 100 positions simultaneously during the peak, covering BTC, ETH, SOL, XRP across 5-minute to 4-hour timeframes.
Total deployed capital is about $67,000.
The key feature: 100% buy orders, 0% sell orders.
Wait, how does it make money if it only buys and never sells? Explained later.
Trading Frequency: Not Placing Orders, But “Wall-Scrolling”
Within 100 minutes, 3,379 trades, averaging 34 trades per minute.
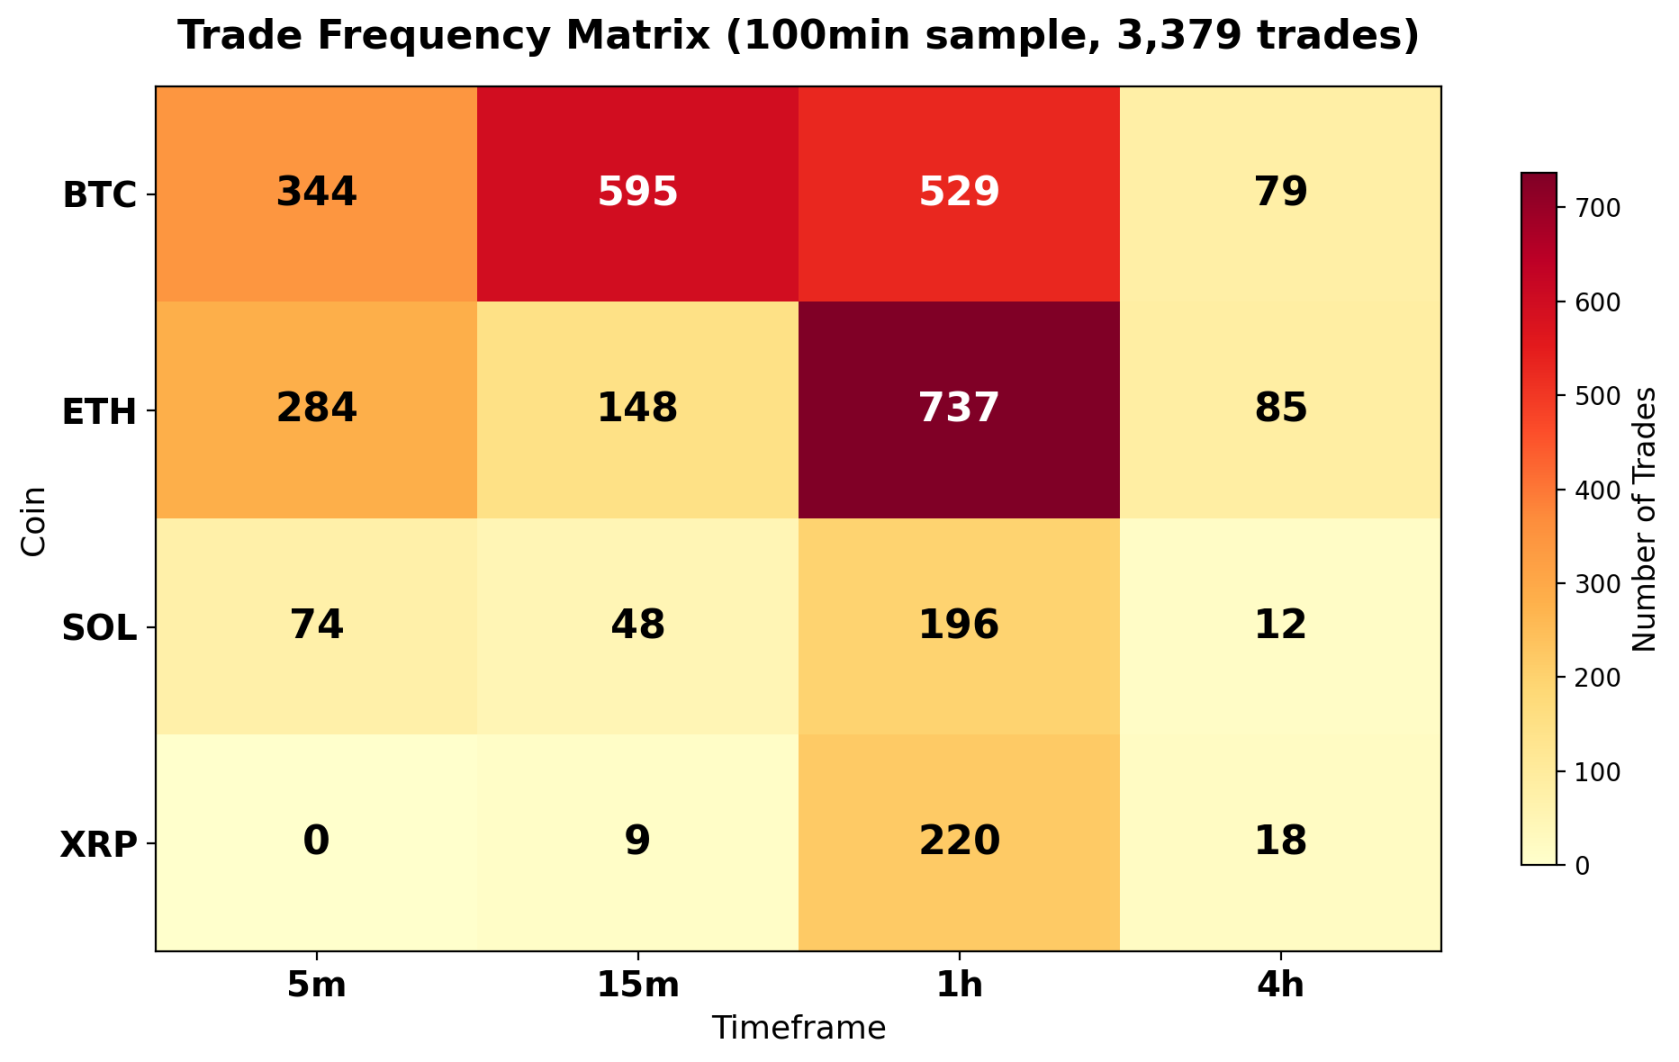
Trade Frequency Heatmap
Some intuitive observations:
- ETH 1h dominates (737 trades), contributing the most volume in a single asset
- BTC 15m is next (595 trades), maintained at high frequency
- XRP 5m is completely empty (0 trades), indicating the bot selectively abandons based on liquidity
- Within the same 10-second window, often 3-4 timeframes have trades happening simultaneously
This is not trader behavior “seeing signals and placing orders,” but market-making behavior maintaining order books continuously.
Entry Time: Bimodal Distribution Reveals Market-Making Logic
If it were signal-driven traders, entry times should be random. But this bot’s 1-hour entry time distribution looks like this:
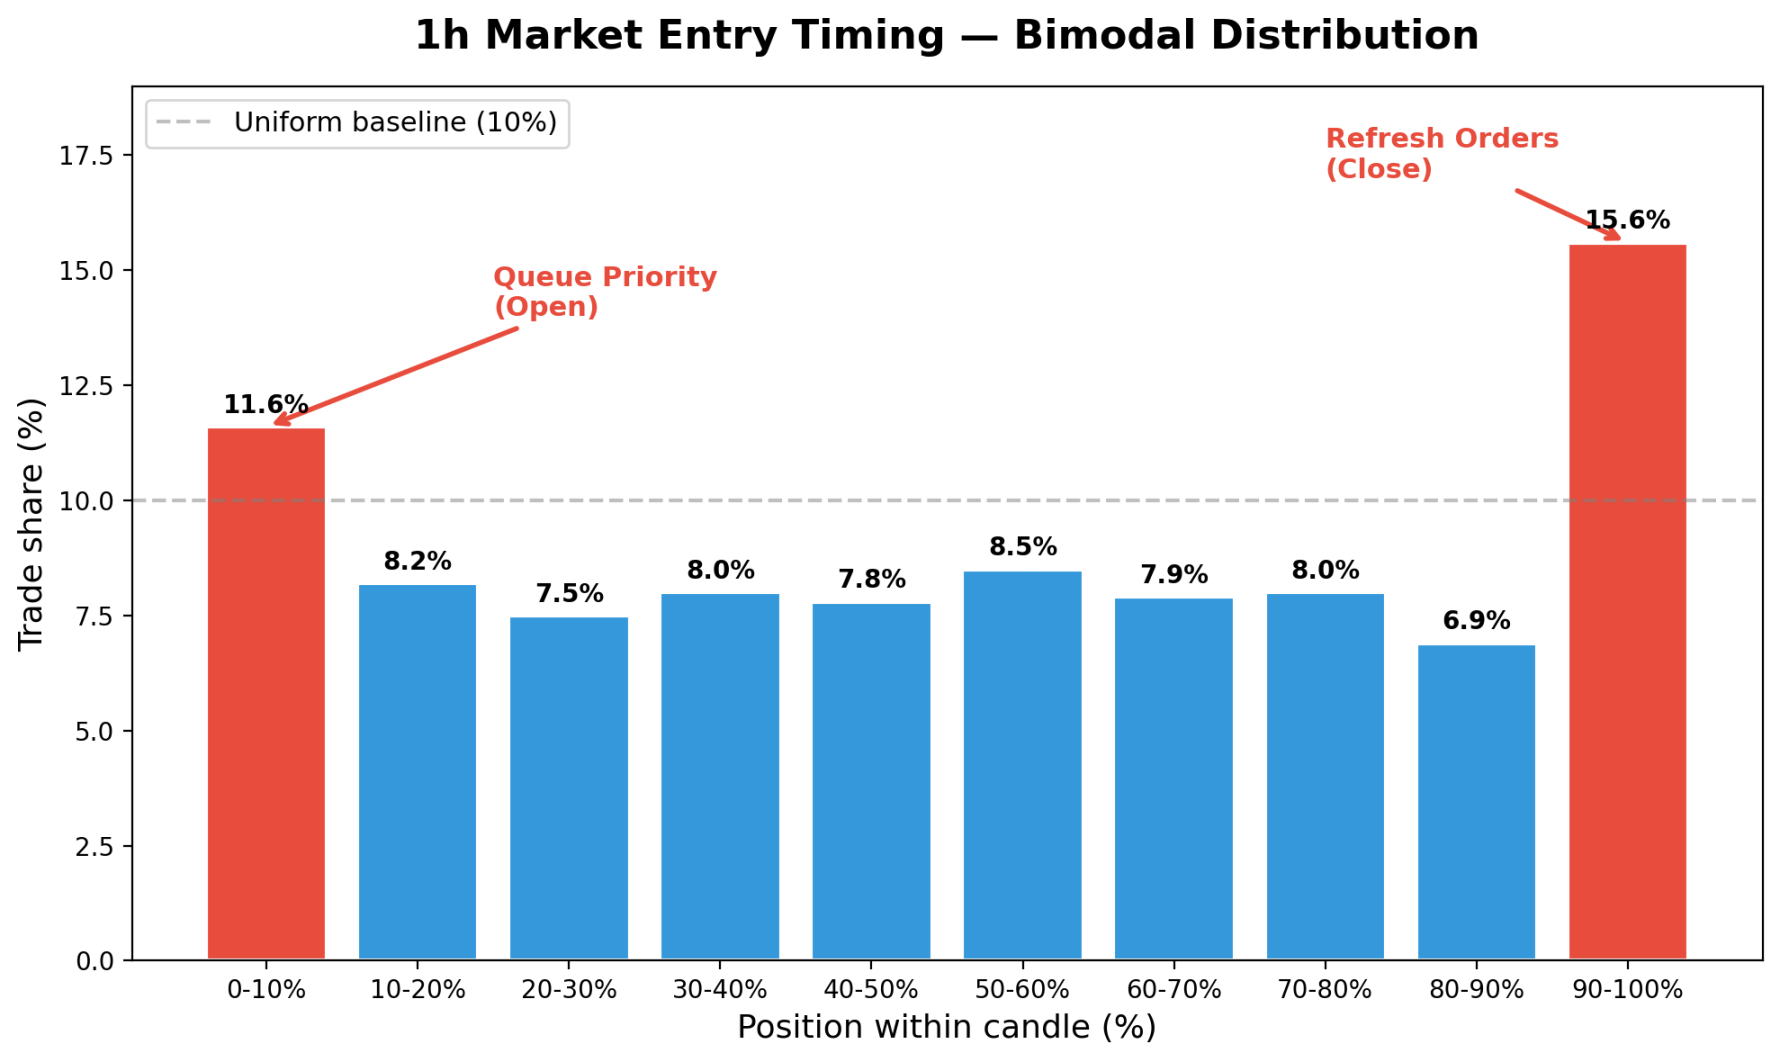
1h Entry Time Bimodal Distribution
Two obvious peaks:
- 0-10% of the candle: 11.6% (to抢 queue priority, front of order book)
- 90-100% of the candle: 15.6% (refreshing orders before candle close)
The middle ranges are evenly distributed at 7-8.5%.
The 4-hour market is even more extreme: 36% of trades occur before the open within the first 10%.
The core competitive advantage of market makers isn’t “predictive accuracy,” but “being at the front.”
Profitable and Losing Coins
Not all assets are profitable.
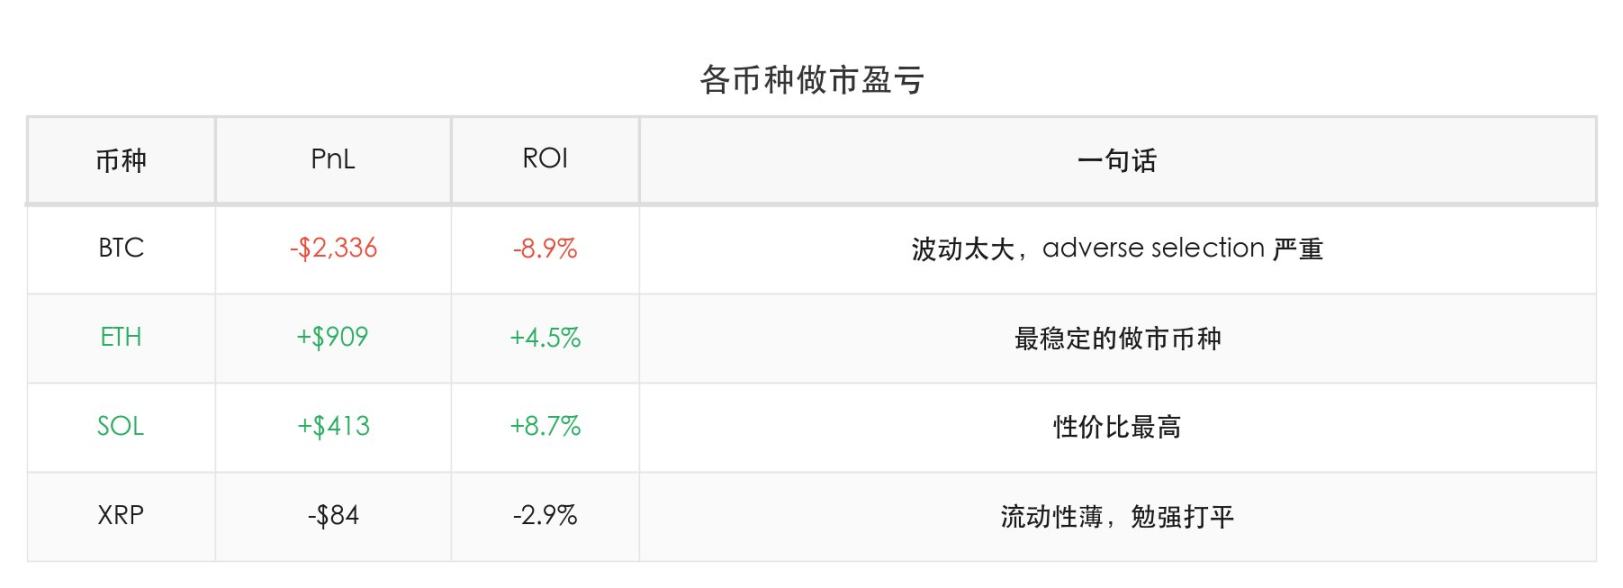
Profit and Loss by Asset
BTC is a minefield for market-making. A single 1h candle can lose $1,988 due to position size (20,138 shares), as adverse selection during sharp volatility eats profits.
Timeframes also show clear differences:
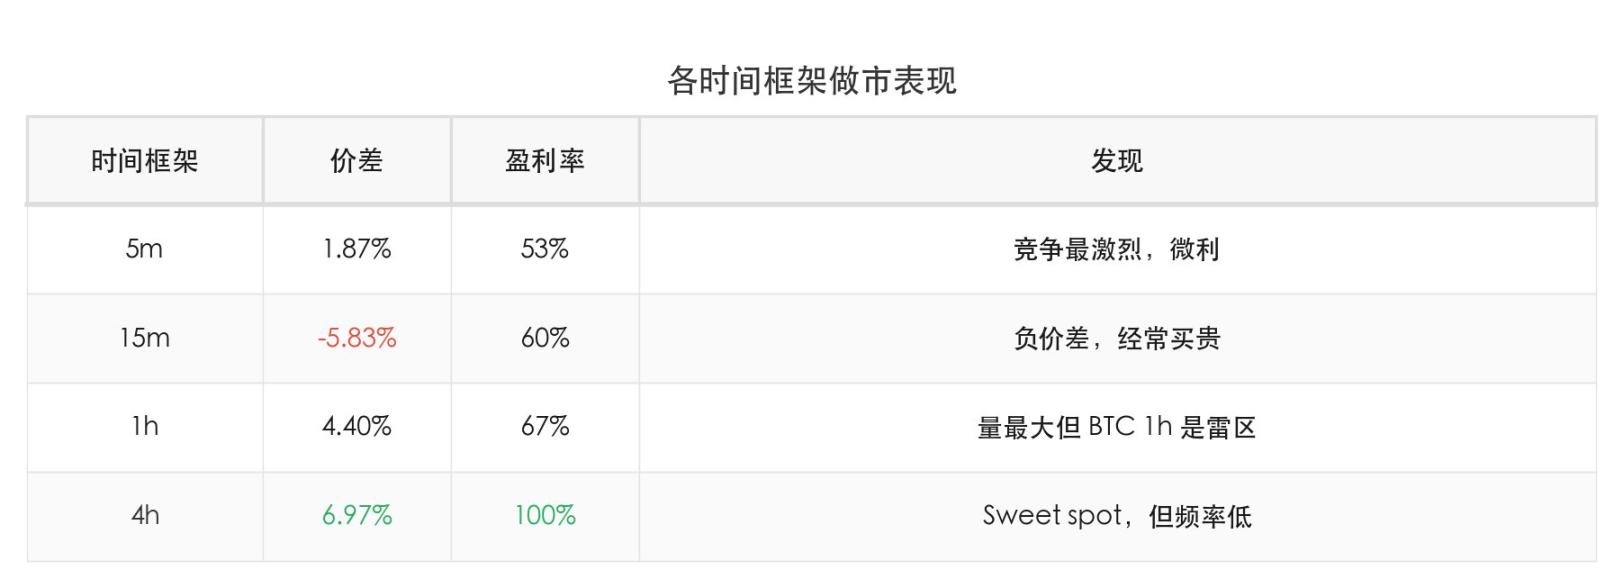
Performance by Timeframe
4h yields the highest profit rate, with 100% profitability. But it only accounts for 5.7% of trades. The dilemma: higher frequency means more competition; lower frequency means less volume.
Market-Making Is Not Risk-Free
Many think market-making is “sure profit.” Data says otherwise.
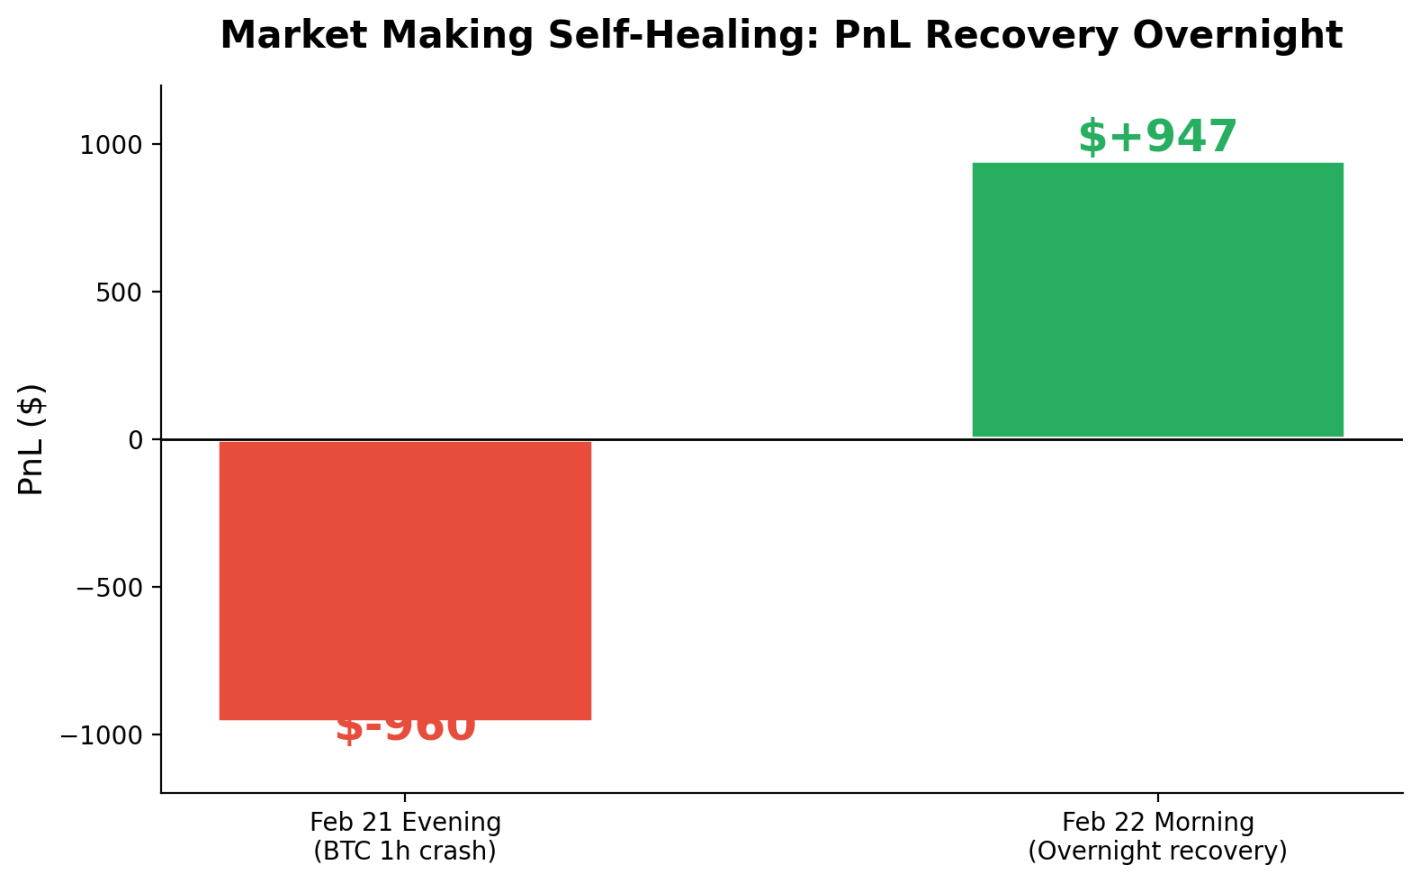
PnL Reversal Process
On the evening of Feb 21, BTC 1h experienced a big move, and the bot’s overall PnL shifted from positive to negative, losing $960.
But by the next morning, PnL recovered to +$947.
This is the “self-healing” ability of market-making: as long as the spread structure isn’t permanently broken, normal candle spreads will gradually cover previous big losses.
The prerequisite: you must withstand the drawdown.
It’s Not Pure Market-Making: Direction Signal Detection
Deeper analysis reveals an interesting fact: the bot isn’t purely bilateral market-making. It tracks Binance prices in real-time to adjust the buy ratio of Up/Down tokens.
I compared the bot’s Up/Down buy volumes with Binance price changes minute by minute, ruling out several hypotheses:
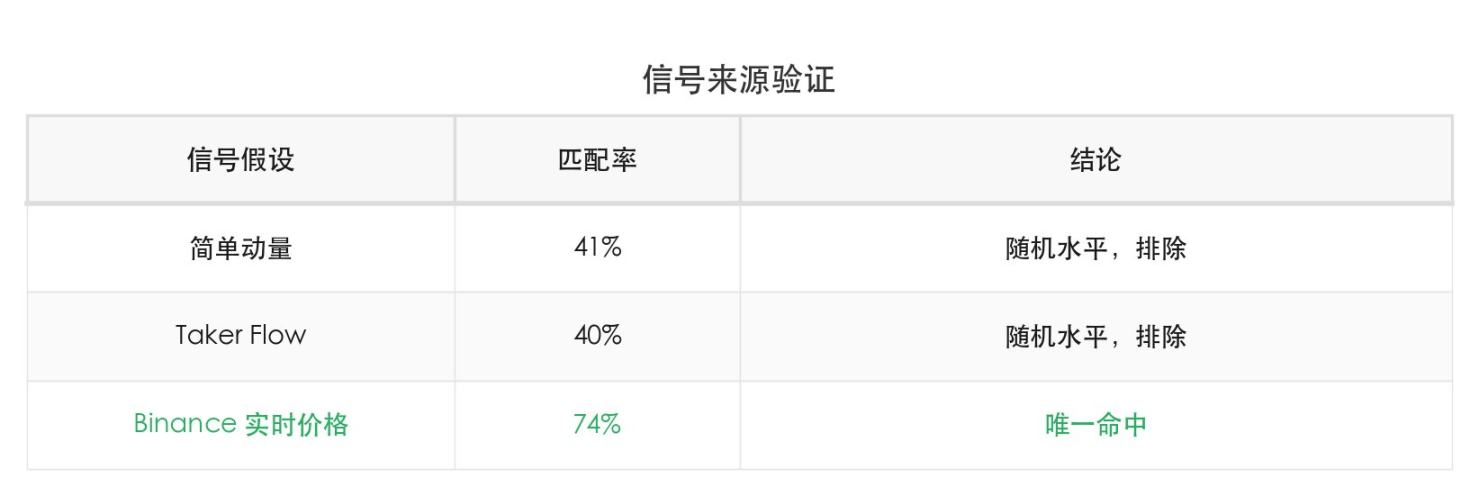
Signal Source Verification
The bot uses micro price signals (Binance real-time prices vs candle open), not trend-following. Verification data:
- Direction match rate: 74%
- Direction accuracy: 77%
- Buying the “expensive” side 100% (always buying the side it believes will win more)
- 1h momentum: 71% opposite, 74% in 15m
This means it overlays directional judgment on top of pure market-making. “Buying expensive” isn’t adverse selection; it’s an active choice.
But this also explains why it loses more during BTC’s big swings: wrong directional judgment combined with bias leads to larger unilateral exposure.
Market-Making Mechanism: Why 100% is BUY
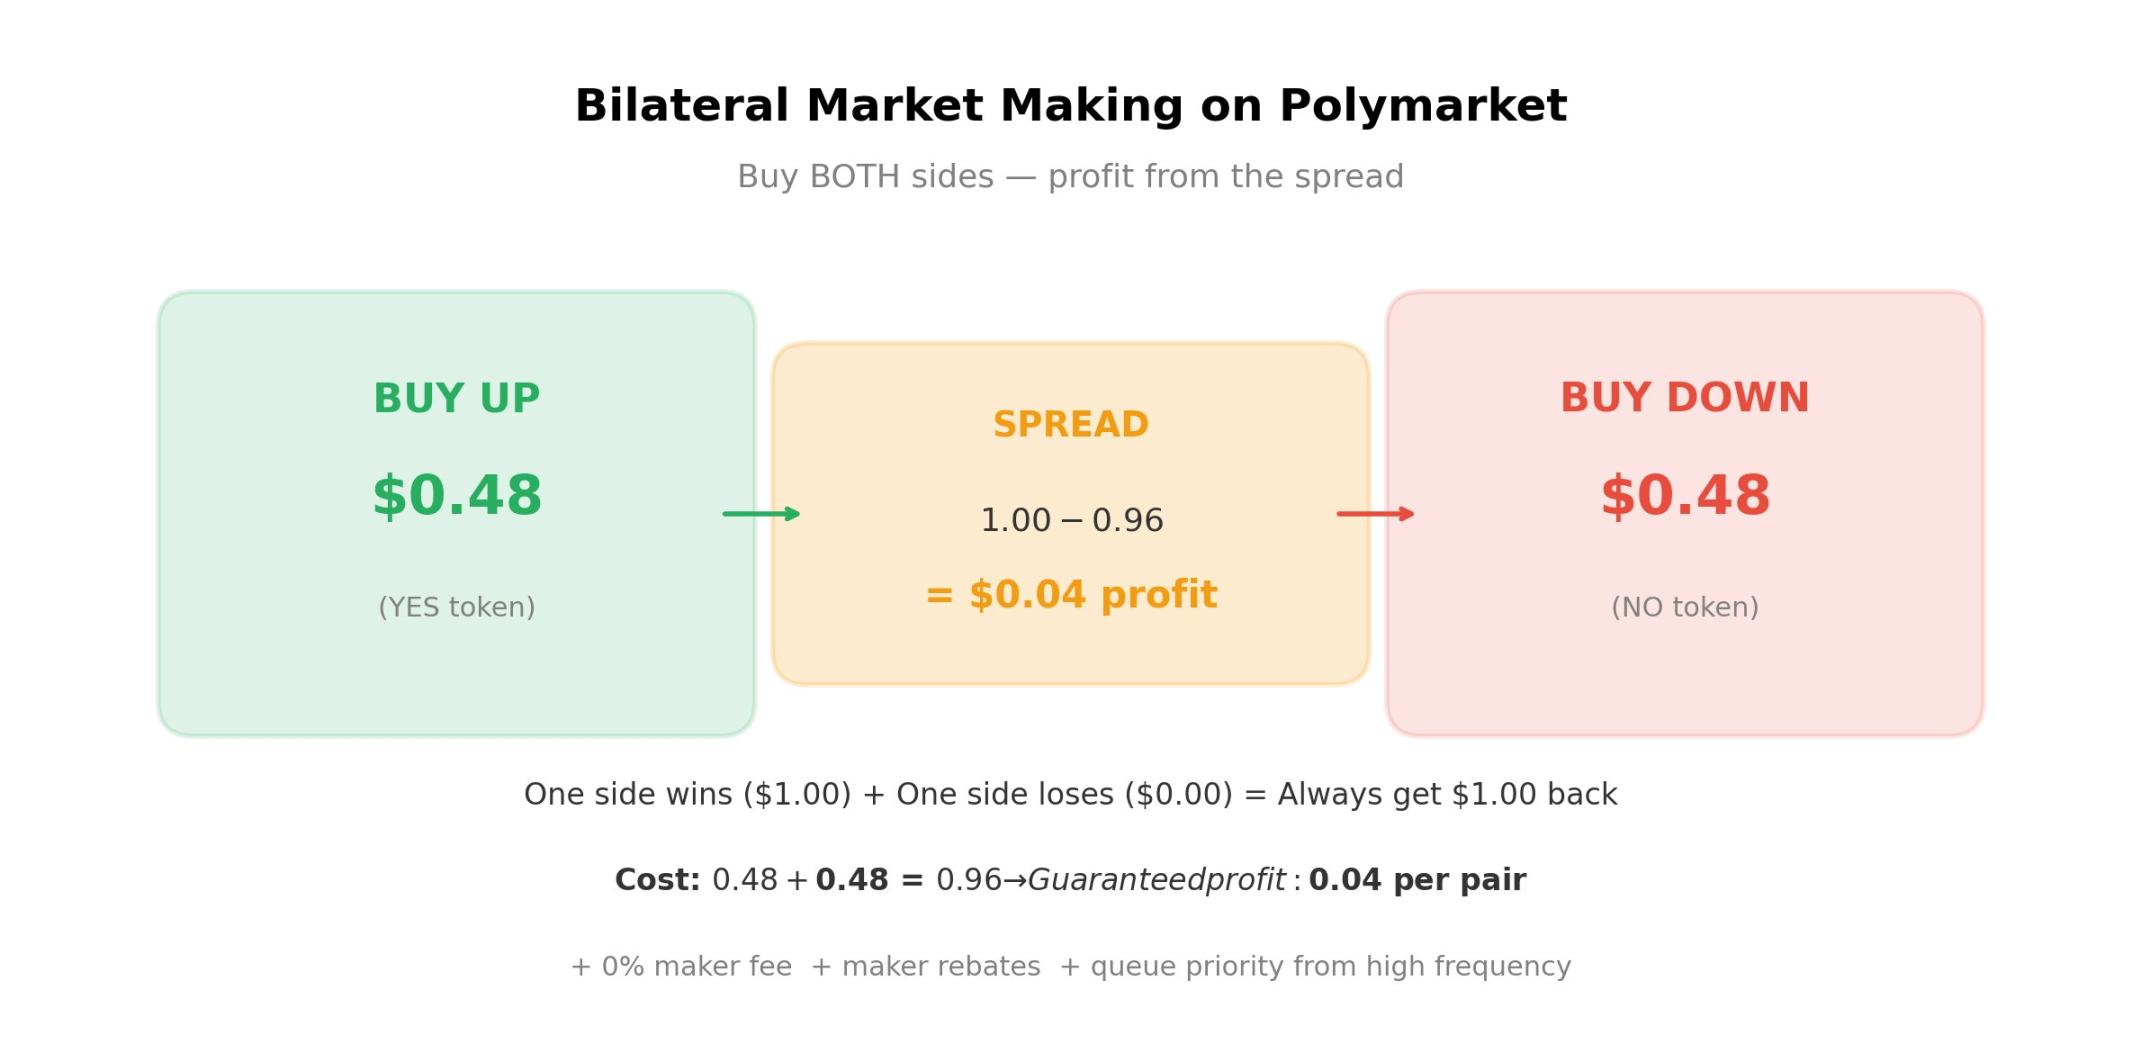
Bilateral Market-Making Diagram
On Polymarket, each market has UP (YES) and DOWN (NO) tokens. The market maker buys both:
- Buy UP at $0.48 + Buy DOWN at $0.48 = total cost $0.96
- Regardless of price movement, the winning side pays out $1.00
- Profit per pair = $1.00 – $0.96 = $0.04
Thus, all trades in the record are “100% buy”—because it’s buying both sides, earning the 4-cent spread.
Three additional advantages:
- Maker fee: 0% (Taker pays 1.5-2%)
- Maker rebate: volume-based cashback (the last rebate for this bot was $145)
- Queue priority: high-frequency orders get priority in the order book, increasing fill rate
Postscript: The Bot Has Stopped
As of March 6, this bot has ceased operation.
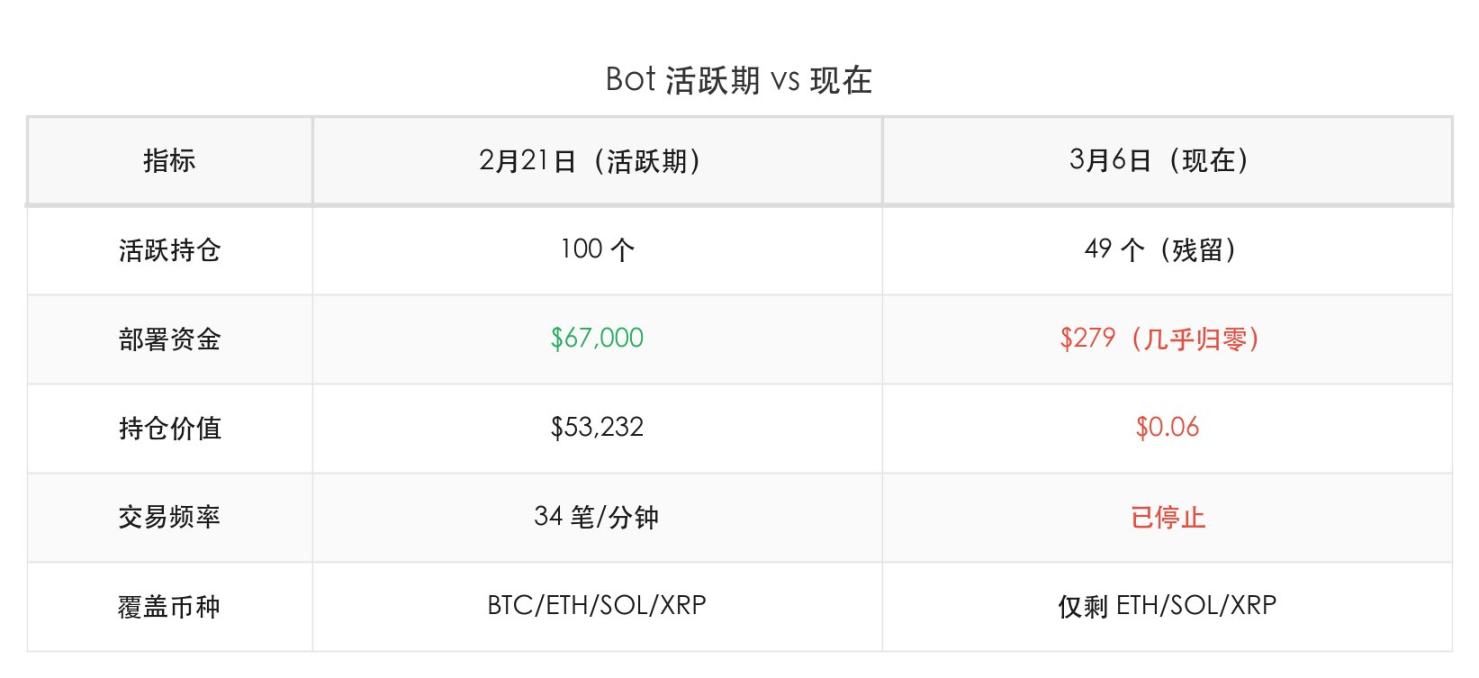
Bot Active Period vs Now
The final action was a large number of REDEEMs (130 trades)—batch settlement exits.
But the all-time PnL (leaderboard data) shows total profits exceeding $1.13 million.
With $67,000 deployed, it earned over $1.1 million cumulatively. This is the compound effect of market-making—not a single big win, but placing 34 small trades per minute, earning a few cents each, day after day.
Why did it stop? Possibly strategy adjustments, address change, or recent Polymarket rule changes (removal of 500ms delay caused many bots to vanish overnight). On-chain data only shows behavior, not decision-making.
Summary
- Market-making isn’t about betting on directions; it’s about earning spreads. 100% buy orders are because both sides are bought.
- Not all assets are profitable. ETH and SOL profit; BTC loses. Asset selection is a core skill.
- Market-making isn’t risk-free. A single 1h candle in BTC can lose $2,000, but it has self-healing ability.
- Frequency is competitive advantage. Queue priority determines fill rate; high-frequency trading is infrastructure, not strategy.
- Pure market-making has a ceiling; overlaying directional signals (like Binance real-time prices) can improve ROI but also magnify losses when wrong.
Data basis: 3,379 trades / 100-minute sample + Positions API snapshots (2026-02-21) + latest API data (2026-03-06)