Author: Frank, PANews
Whenever the market enters a state of uncertainty, there are always people trying to predict the next trend using a “marking the boat to seek the sword” style of historical retrospection. In such cases, people often see history repeating itself in these theories and charts, automatically overlayting future market movements with past segments for validation.
This kind of overlap seems to have a magical effect and is often validated. Some bloggers claim that their prediction accuracy can reach 75% to 80%.
This “marking the boat to seek the sword” style of price prediction, which frequently goes viral on social media, is it really helping the market identify phases, or is it just packaging noise as prophecy?
From “Tick-Tock Fractal” to “Historical Rhyme”
The peak operation for predicting the market top in October 2025 was conducted by an analyst named CryptoBullet. He created a method called “tick-tock” fractals, which, starting in May 2025, predicted that Bitcoin’s price would peak in October.
Ultimately, this model successfully predicted the end of the bull market. However, CryptoBullet forecasted a top of $150,000, while the actual high only reached about $126,000.
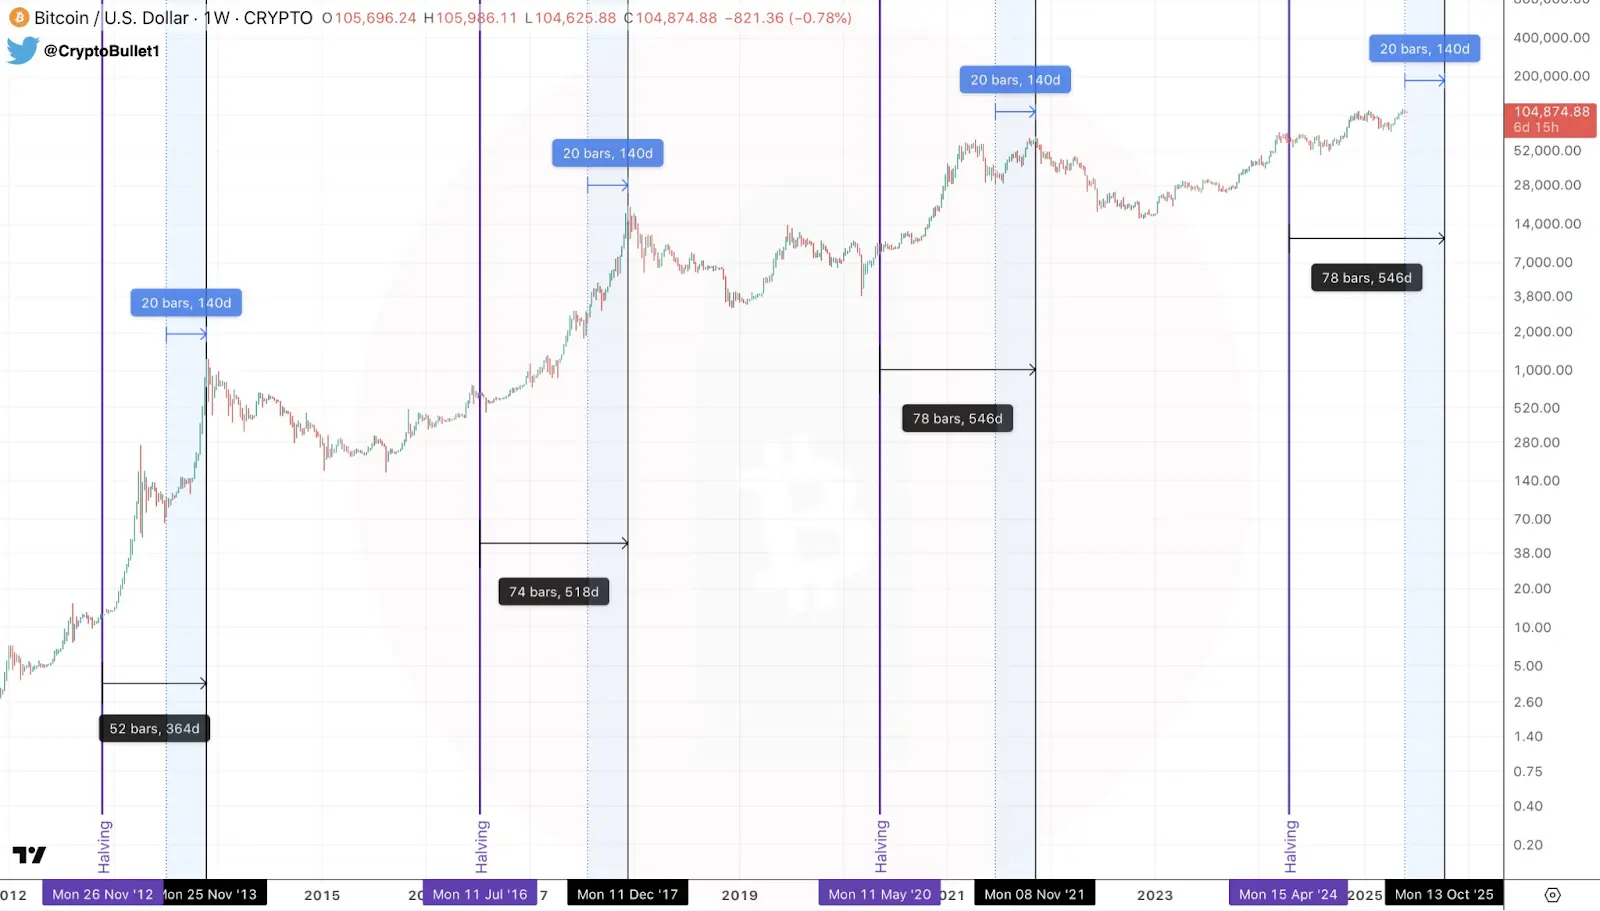
Based on the principles of his prediction model, such an outcome was expected. His main logic is: in past cycles, a certain number of days after halving, the market often reaches a top. When the market enters a similar window, projecting the same time interval and price development could lead to a prediction of October with a peak of $150,000. The most critical parameter in this logic is the time cycle, so the timing prediction was relatively accurate, but the price prediction missed.
Another example is KillaXBT. His core idea is: history doesn’t repeat exactly, but it often “rhymes.” He combines time cycles, historical pivot windows, and structural symmetry to adapt to the current market.
For example, he doesn’t rigidly apply all time cycles with a fixed ratio, claiming that certain events will happen at specific times. Instead, he compares the current price window and trend with a phase in historical price movements, then makes a fuzzy forecast of the possible future trend.
This kind of prediction doesn’t involve very specific prices or exact timing. It’s more about judging whether the market will go up or down next.
KillaXBT claims that this prediction method can achieve an accuracy of 75% to 80%.
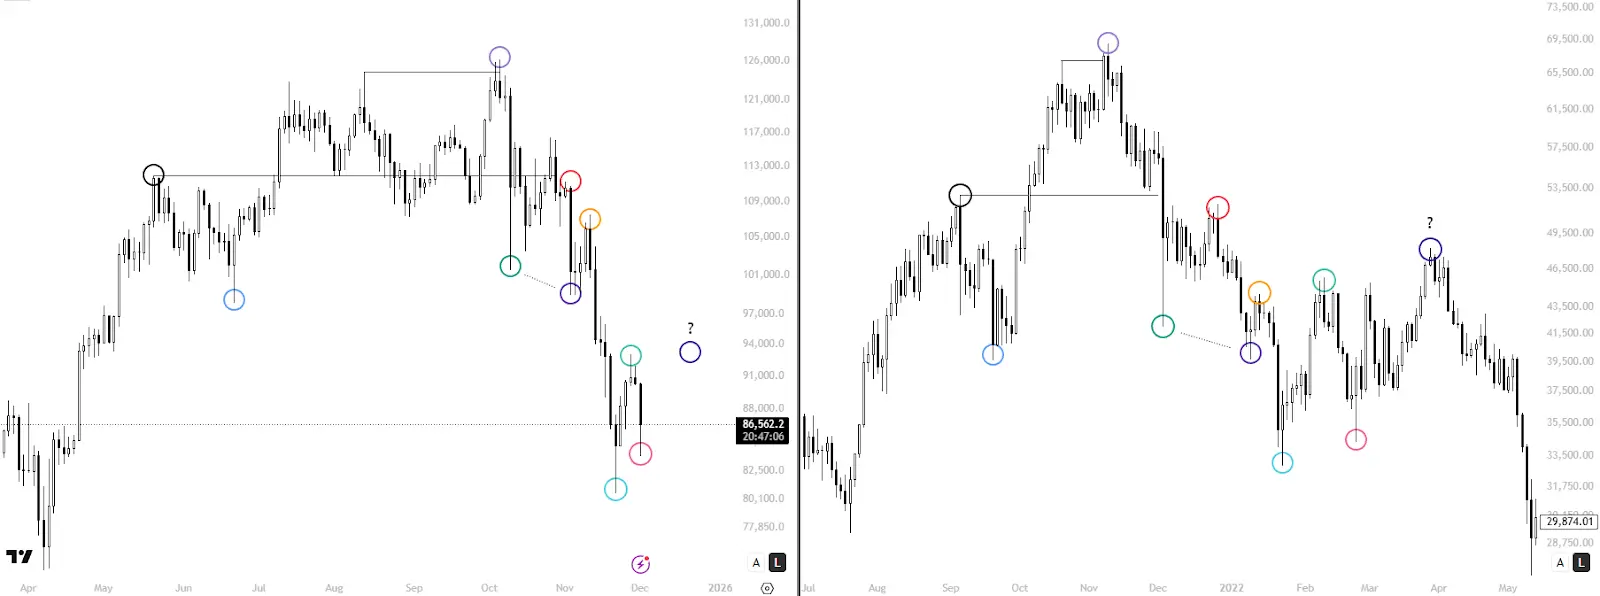
PANews reviewed several of his recent predictions. For instance, in December 2025, he analyzed that the price movement at that time was highly similar to 2021. He predicted a possible bottom around $80,000, then a breakout above $90,000. The actual movement was that the price didn’t fall below $80,000 but did break past $90,000, reaching close to $98,000. Although the exact price wasn’t predicted accurately, the trend was quite similar to his 2021 model.
In January 2026, based on another prediction method, KillaXBT indicated that, based on statistical patterns over the past seven months, the market tends to decline about 8% within two weeks after the 14th of each month. Therefore, he predicted that after January 14, the market might enter another downtrend, at least dropping 8%.
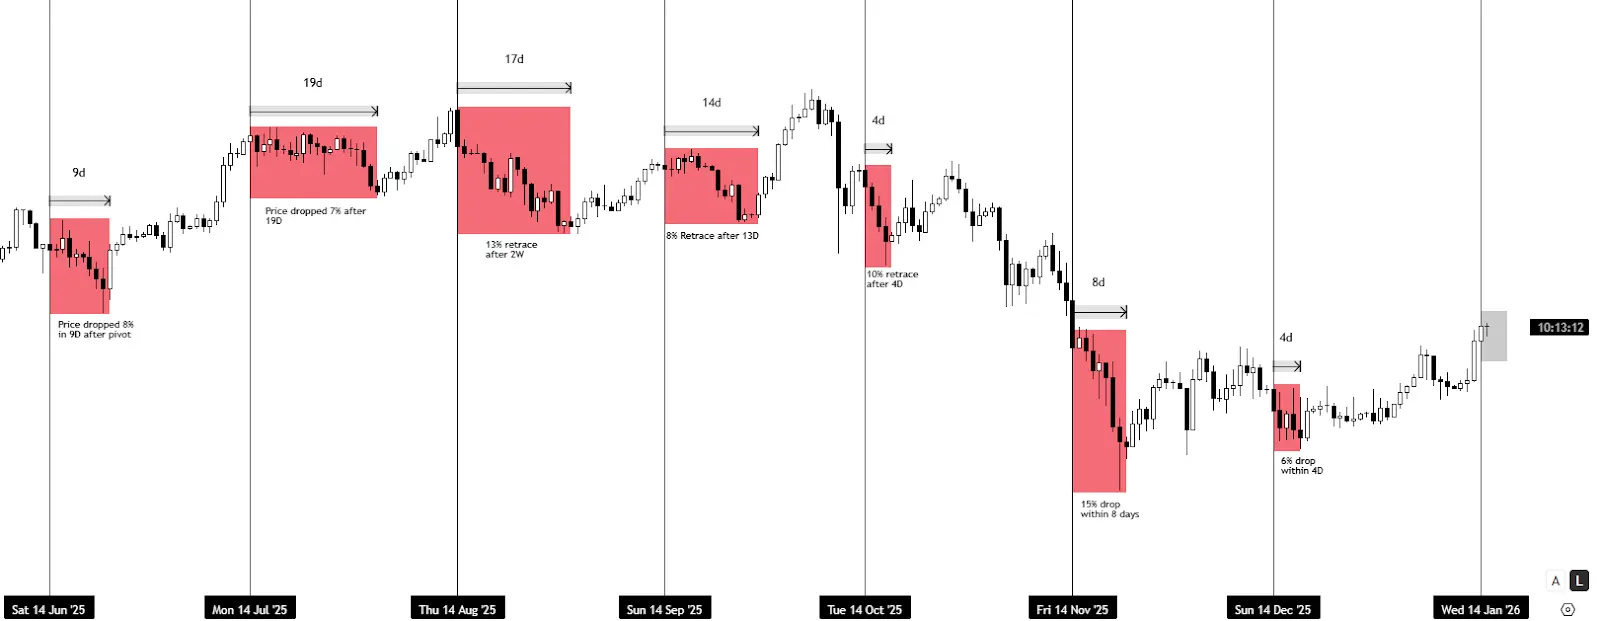
This prediction also proved accurate. After a short-term top on January 15, the market indeed entered a rapid decline, with a maximum drop of over 38%.
In February 2026, he again predicted that the trend would resemble the 2022 scenario—possibly a rally followed by a dip below $60,000 to form a bottom zone. This prediction hasn’t been fully validated yet, but the recent rebound to around $74,000 did partially confirm some aspects of his forecast.
At first glance, KillaXBT’s predictions seem quite accurate, which has earned him a lot of attention and followers.
Mysticism or Science? The Three Main Logics Behind the High Win Rate of “Marking the Boat to Seek the Sword”
But the more practical question is: why are these “marking the boat to seek the sword” predictions often accurate? Is it mysticism or is there some scientific basis?
First: history does rhyme, but the essence of rhyming is caused by liquidity and market enthusiasm, which lead to similar market structures. For example, in “Wyckoff Trading Method,” the market is divided into four stages: accumulation, markup, distribution, and markdown.
The repeated evolution of these stages reflects the recurring market sentiment—fear turning into greed, and greed turning back into fear.
Second: this predictive effect isn’t exclusive to “marking the boat” methods. Most commonly used technical indicators can achieve similar predictive results. When you review how indicators like MACD, RSI, trendlines perform on historical data, you’ll find they often give early warning signals at tops and bottoms. However, first, these indicators are too familiar to traders, lacking mystery. Second, compared to “marking the boat” methods, these indicators don’t directly show specific trend structures (e.g., a rise followed by a fall). Still, people instinctively prefer this straightforward, simple expression.
Third: the luck bias in many predictions. The book “The Drunkard’s Walk” gives an example: if you put an infinite number of monkeys in front of typewriters, one of them will inevitably produce the exact text of the “Iliad.” This isn’t to say analysts are just randomly guessing, but it illustrates that on social media, many predictions are made daily—most are ignored or quietly deleted. The ones that are remembered as high quality are often just lucky guesses. Influencers aim for traffic, while traders aim for real profits.
“Marking the boat to seek the sword” predictions in crypto aren’t new. Years ago, many similar theories emerged, such as TechDev overlaying Bitcoin’s monthly chart with the 2013 cycle and 1970s gold trends, projecting a top between $200,000 and $390,000; PlanB using stock-to-flow and floor models to extend halving cycles to near $100,000; and many analysts directly applying 2017 and 2021 local ranges to current trends.
By this cycle, most of these predictors have fallen by the wayside, with little discussion. When old prophets are phased out, new “charting masters” with fresh mysticism appear. (Related reading: When “Old Maps” No Longer Fit: 8 Failed Classic Crypto Indicators and Their Structural Reasons)
Foreseeing the Direction Is Not the Same as a Trading Strategy—Fatal Flaws in Practice
Another more critical question is: do these “marking the boat” predictions have any real utility in trading?
Let’s revisit the earlier examples.
Take CryptoBullet’s prediction: market top at $150,000 in October 2025. In actual trading, factors like price direction, precise timing, stop-loss and take-profit levels, and position management are essential.
CryptoBullet only provided a vague timing estimate, and the price forecast was wrong. As an actionable trading strategy, such a judgment has limited value. You can’t precisely open a short position in early October just because of a “top in October” call, since it doesn’t specify entry points or clear invalidation conditions. If traders go short too early, they risk being caught in a rally; if they wait until signs of weakness appear, looking back at this prediction, it’s more of a post-hoc validation of “rough timing” rather than a system that can be directly traded.
Similarly, KillaXBT’s December forecast offers directional guidance rather than a detailed trading plan. It suggests “the trend will likely bottom out first, then break upward,” but doesn’t specify whether at $82,000, $80,000, or $78,000, nor does it specify at what point a breakdown invalidates the analogy. For medium- to long-term investors, this may help hold positions without panic selling during dips. But for traders needing precise entries and exits, it still lacks critical execution details.
KillaXBT’s January prediction might be the most accurate, but the price only started declining after the 15th. Following such a forecast blindly could lead to being stopped out on a breakout above the predicted bottom. Moreover, this prediction structure doesn’t specify exact prices, making it impossible to set stop-loss or take-profit levels based solely on it.
Overall, these “marking the boat” predictions are more like phase recognition tools rather than directly usable trading systems. They can occasionally help identify risk zones and sentiment turning points, providing some directional insight. But once packaged as high-confidence prophecies, their flaws become evident.
History rhymes, but it doesn’t copy-paste.
For ordinary investors, what’s truly valuable isn’t a “divine chart,” but the underlying emotions, liquidity, and structural shifts these charts attempt to reflect. The real danger lies in treating these vague phase judgments as precise trading commands.