Trade
Basic
Futures
Futures
Hundreds of contracts settled in USDT or BTC
Options
HOT
Trade European-style vanilla options
Unified Account
Maximize your capital efficiency
Demo Trading
Futures Kickoff
Get prepared for your futures trading
Futures Events
Futures Mall
Participate in events to win generous rewards
Demo Trading
Use virtual funds to experience risk-free trading
Earn
Launch
CandyDrop
Collect candies to earn airdrops
Launchpool
Quick staking, earn potential new tokens
HODLer Airdrop
Hold GT and get massive airdrops for free
Launchpad
Be early to the next big token project
Alpha Points
NEW
Trade on-chain assets and enjoy airdrop rewards!
Futures Points
NEW
Earn futures points and claim airdrop rewards
Investment
Simple Earn
Earn interests with idle tokens
Auto-Invest
Auto-invest on a regular basis
Dual Investment
Buy low and sell high to take profits from price fluctuations
Soft Staking
Earn rewards with flexible staking
Crypto Loan
0 Fees
Pledge one crypto to borrow another
Lending Center
One-stop lending hub
VIP Wealth Hub
Customized wealth management empowers your assets growth
Private Wealth Management
Customized asset management to grow your digital assets
Quant Fund
Top asset management team helps you profit without hassle
Staking
Stake cryptos to earn in PoS products
Smart Leverage
NEW
No forced liquidation before maturity, worry-free leveraged gains
GUSD Minting
Use USDT/USDC to mint GUSD for treasury-level yields
More
unfriend
The Convert Lucky Draw event is officially live. Complete a trade of just $1 to enter the draw—every draw is a winner. You can start a convert trade with as little as $1 and enjoy a fast, zero-fee trading experience. Complete simple tasks to unlock exclusive rewards and start your Convert journey now. https://www.gate.com/campaigns/3920?ref=XgRFBg1c&ref_type=132&utm_cmp=1ZLLP5ek
- Reward
- like
- Comment
- Repost
- Share
🚀📈💰⚡🪙📊🔗🧠🏦⛓️🔥
"Cryptocurrency is not just a financial innovation but a technology of coordination."
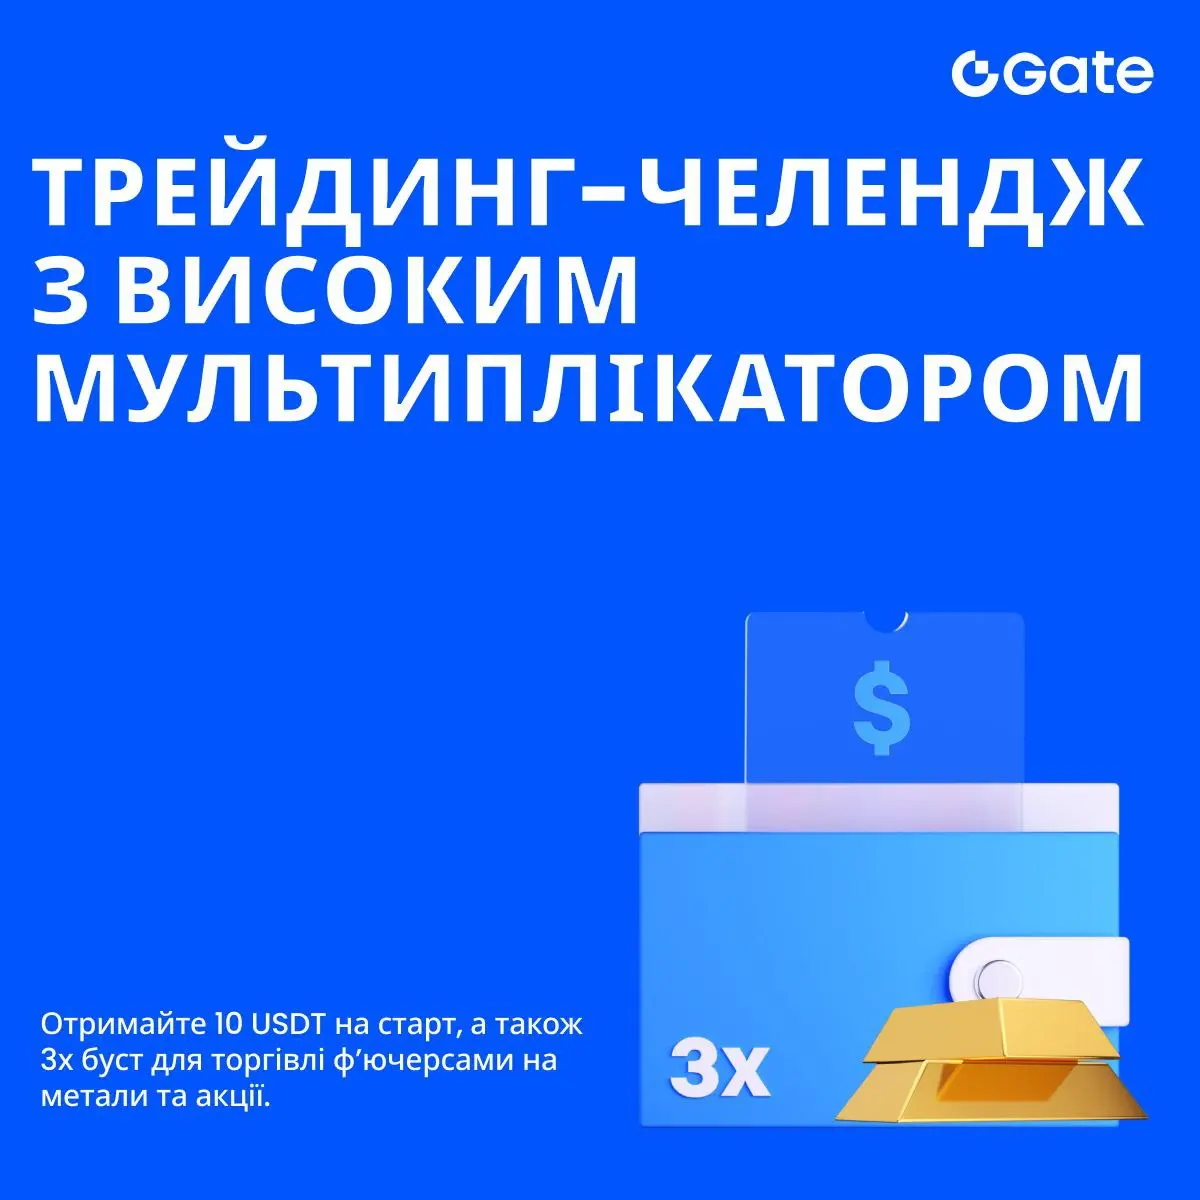
(Balaji Srinivasan). The high-multiplier trading challenge on Gate is an example of how exchange events can combine educational value, activity incentives, and real financial rewards. Against the backdrop of growing interest in futures on metals and stocks, Gate offers participants a structured participation format: a welcome bonus, sequential tasks, and a progressive reward system where activity directly translates into potential income.
The event is designed to be accessible to both ne
View Original"Cryptocurrency is not just a financial innovation but a technology of coordination."
(Balaji Srinivasan). The high-multiplier trading challenge on Gate is an example of how exchange events can combine educational value, activity incentives, and real financial rewards. Against the backdrop of growing interest in futures on metals and stocks, Gate offers participants a structured participation format: a welcome bonus, sequential tasks, and a progressive reward system where activity directly translates into potential income.
The event is designed to be accessible to both ne


- Reward
- 1
- Comment
- Repost
- Share
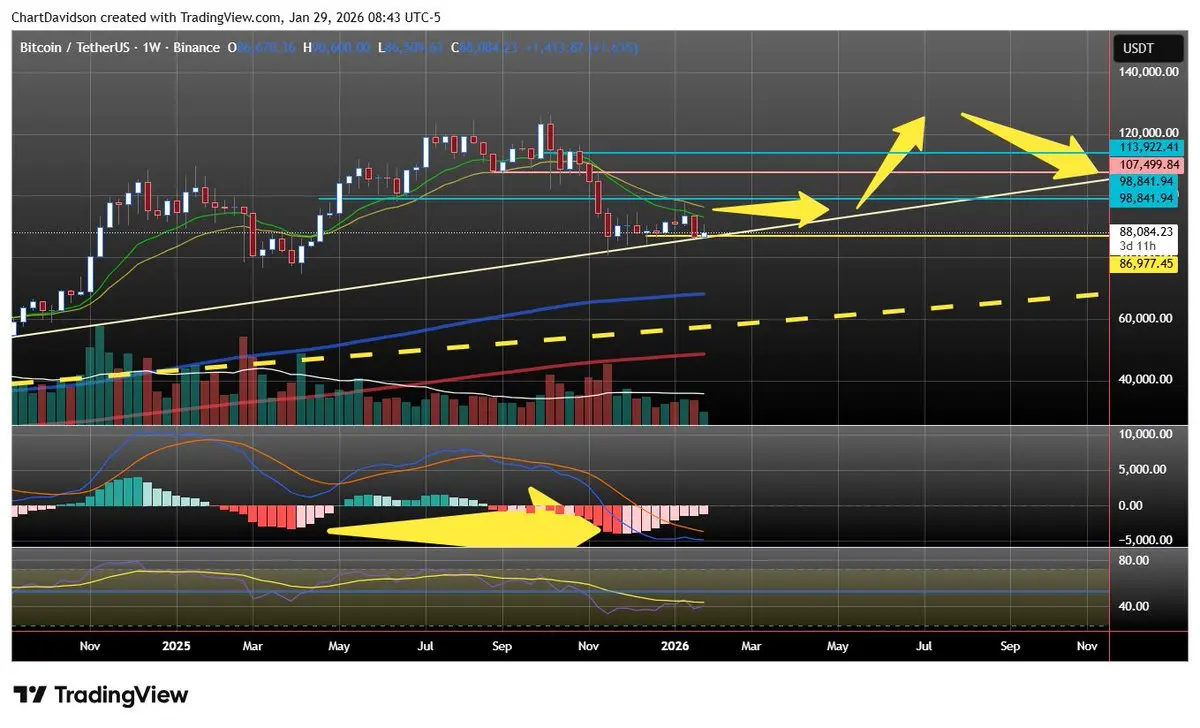
$BTCWe have 3 days to correct this weekly candle. If it closes red, bear market is coming. A long, crypto crippling bear market!
- Reward
- 1
- 1
- Repost
- Share
EmpressPhae:
emphasis on "crippling" whale and political actions for the past few months haven't been pleasant at all
在给你一次机会还会入圈吗
干就完了
Created By@2500YuanStart-upCapit
Listing Progress
0.00%
MC:
$3.33K
Create My Token
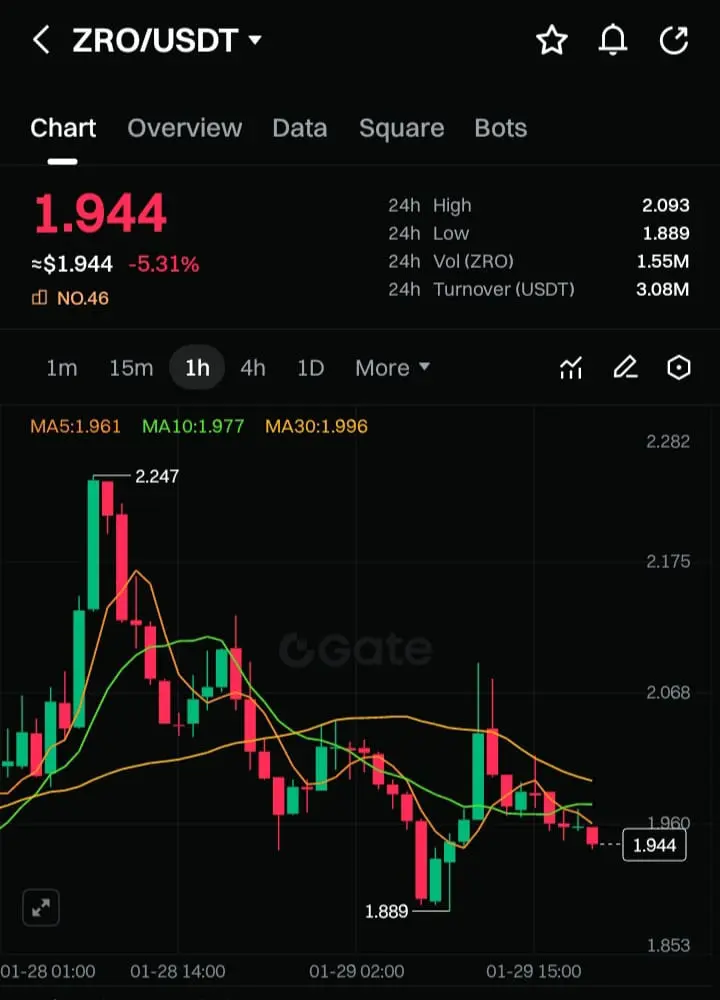
$ZRO /USDT Analysis
Current Trend: Price is showing bearish momentum at $1.944, trading below key Moving Averages.
Key Resistance: Sellers are active near $2.093 (24h high) and the $2.247 peak.
Critical Support: The recent low at $1.889 serves as the primary floor to watch.
Would you like me to set an alert for when price hits that support level?
#GateLiveMiningProgramPublicBeta
ZRO-3,48%
- Reward
- like
- Comment
- Repost
- Share
The schedule consistently fails to go live on time.
View Original
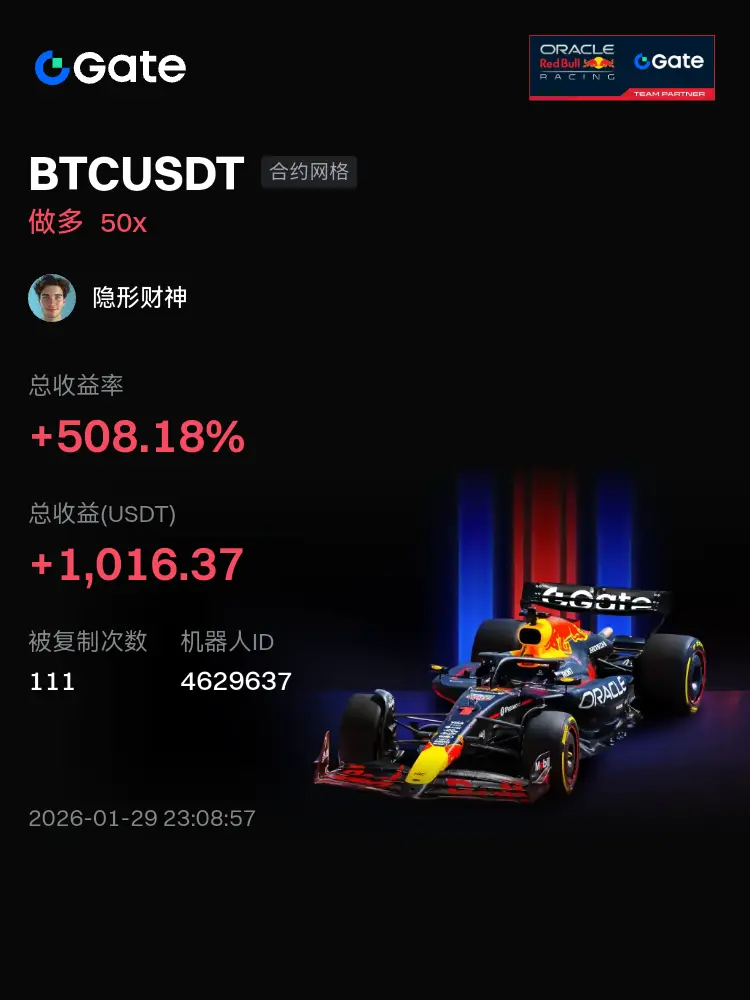
[The user has shared his/her trading data. Go to the App to view more.]
- Reward
- like
- Comment
- Repost
- Share
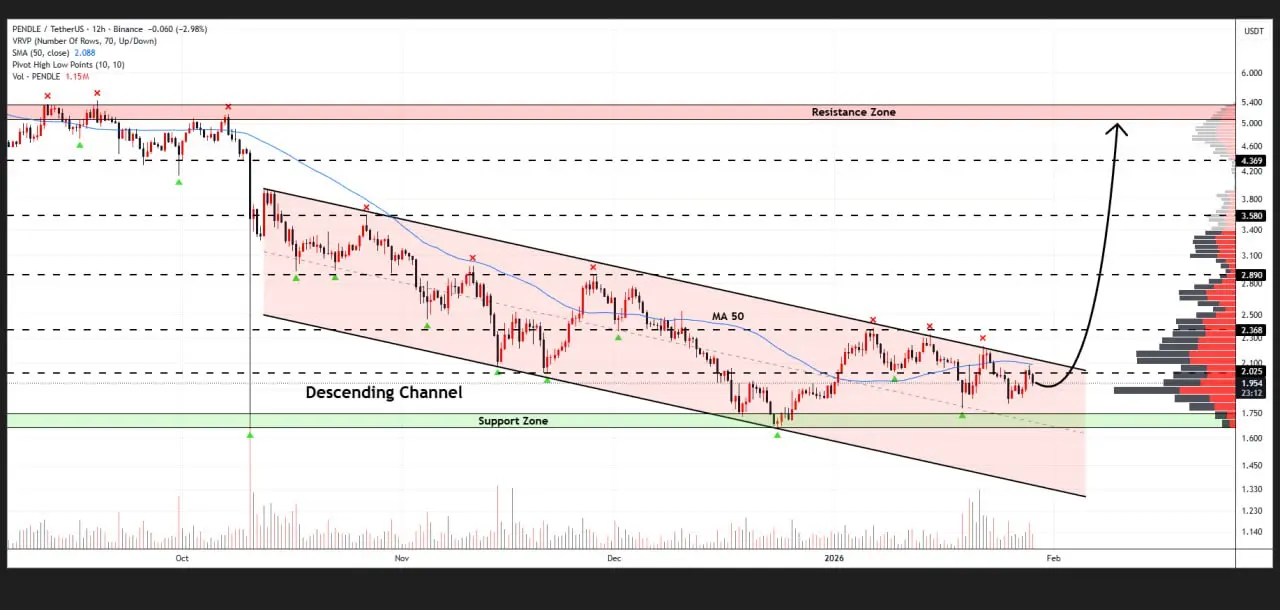
$PENDLE is moving inside a clean descending channel on the 12H chart.
Pressure is building slowly.
A confirmed breakout could flip the momentum bullish fast.
Eyes on the $5.30 zone.
#GoldBreaks$5,500 #GateLiveMiningProgramPublicBeta #SEConTokenizedSecurities
Pressure is building slowly.
A confirmed breakout could flip the momentum bullish fast.
Eyes on the $5.30 zone.
#GoldBreaks$5,500 #GateLiveMiningProgramPublicBeta #SEConTokenizedSecurities
PENDLE-5,97%
- Reward
- 3
- 2
- Repost
- Share
unfriend:
buy to learnView More
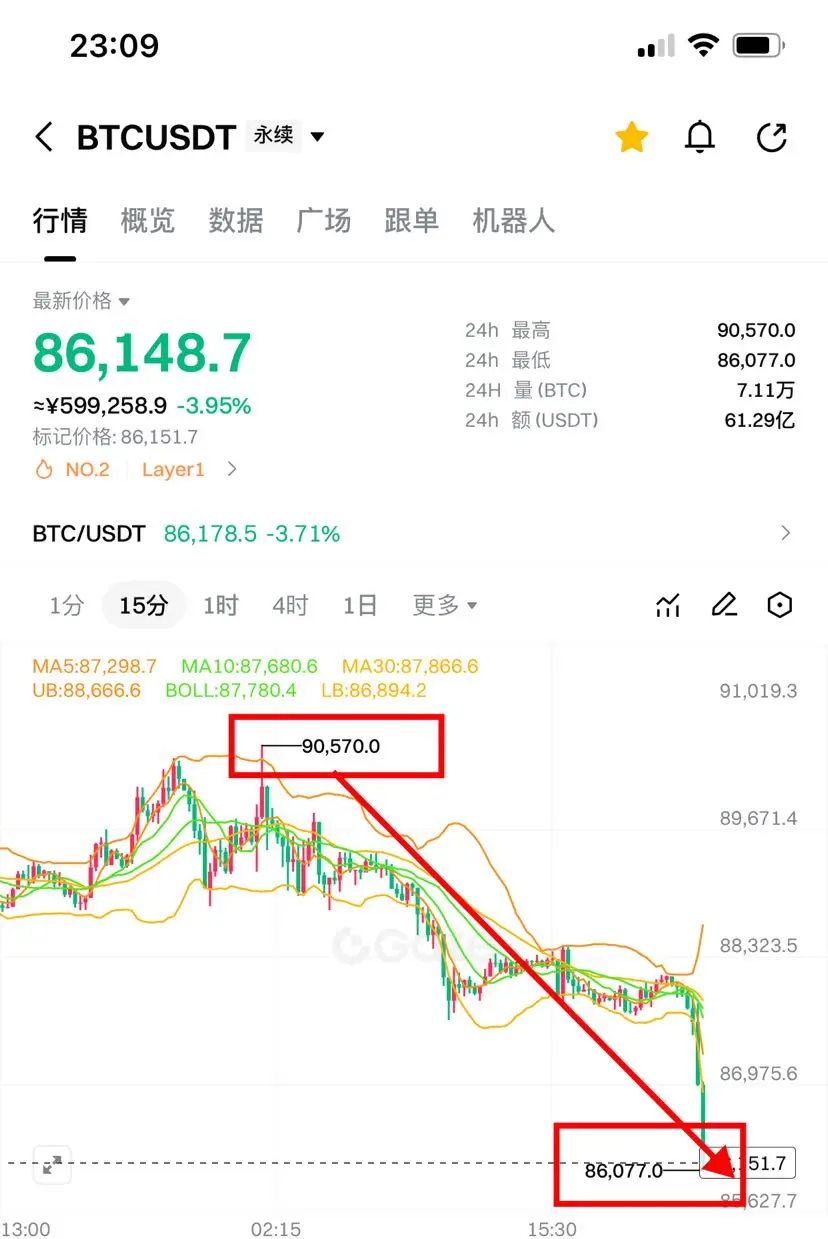
Don't just look at the candlestick charts! As US bonds are being sold off, gold is being accumulated, and Tether is being bought—this is the ultimate narrative for Bitcoin!
Recently, the surge in gold and silver prices has led many to see only the "hedge."
But what truly drives this round of market movement isn't panic, but a migration of global wealth anchors.
When central banks reduce their holdings of US bonds, they are not exchanging dollars but switching to an asset that doesn't need to be redeemed.
In extreme environments, credit can be weaponized, but gold requires no promises.
It is un
BTC-4,5%

- Reward
- like
- Comment
- Repost
- Share
- Reward
- like
- Comment
- Repost
- Share
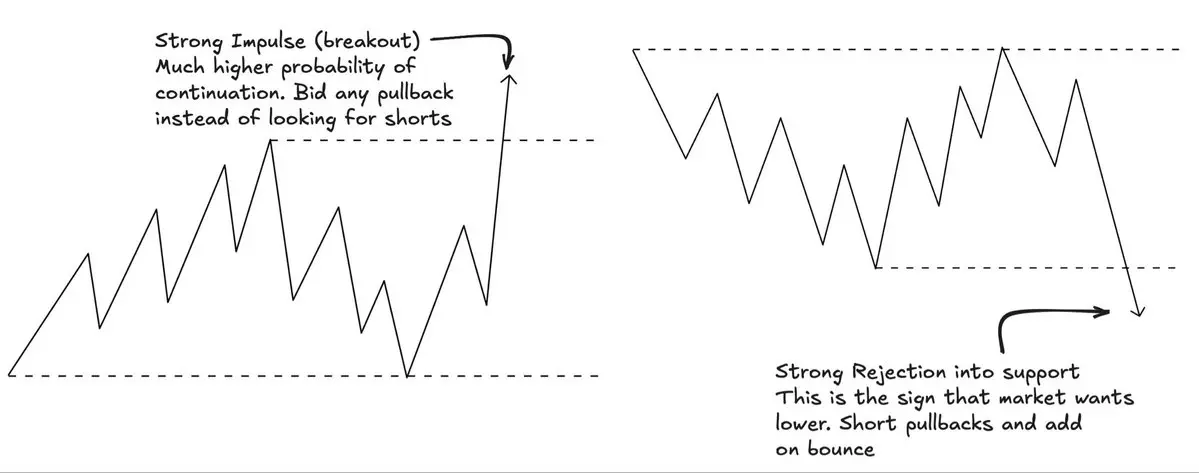
Bookmark ThisMost traders try to go against the market even when price shows its hand by strong impulse candles in one direction. When you see aggression by one side into key levels, try to trade with it.
- Reward
- like
- Comment
- Repost
- Share
🌹Guan Peace, family members, I give you‼️ Unknowingly, it has been the 4th year since subscribing, and the number of subscribers has also exceeded 280🀄️ The 5.4gt discount is about to end and will revert to 8gt. Friends who subscribe are not fools; if you don’t earn, then you definitely 😄 Apple click 👇 or copy it to the web page to subscribe:
https://www.gate.com/zh/profile/When will the autumn rain end
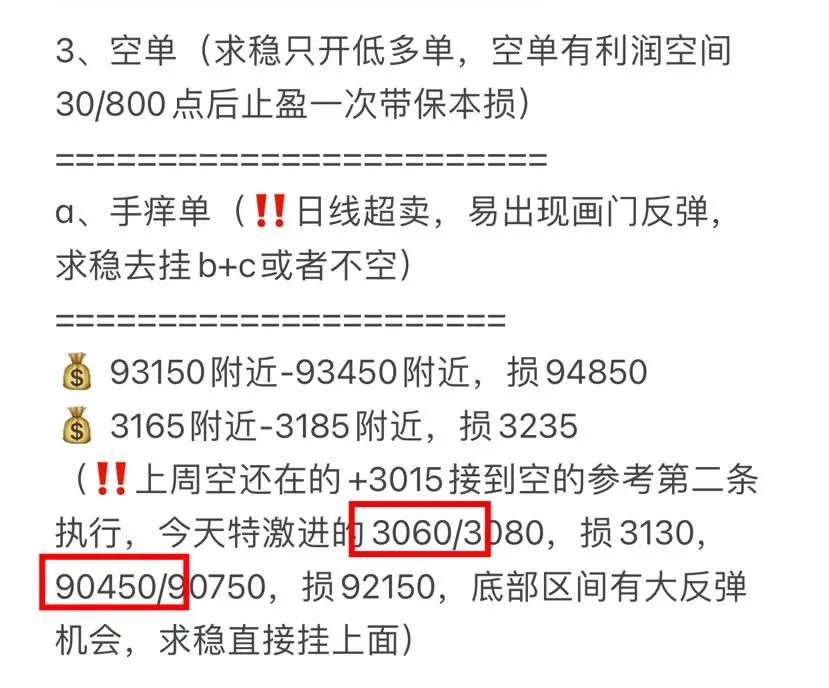
🌹 Last week 3400/97800 empty 2865/87250 eat big meat
🌹 Last week late 3015/90800 empty Monday 2785/86000 eat more meat
🌹 Monday 2785/86000 reverse hand add 3045/90400 eat meat
🌹 Reverse
View Originalhttps://www.gate.com/zh/profile/When will the autumn rain end
🌹 Last week 3400/97800 empty 2865/87250 eat big meat
🌹 Last week late 3015/90800 empty Monday 2785/86000 eat more meat
🌹 Monday 2785/86000 reverse hand add 3045/90400 eat meat
🌹 Reverse
- Reward
- 10
- 11
- Repost
- Share
KeepUpWithTheRhythmOfTheTimes :
:
Experienced driver, guide me 📈View More
🔤
abc
Created By@RideTheWavesToEarnBigRice.
Subscription Progress
0.00%
MC:
$0
Create My Token
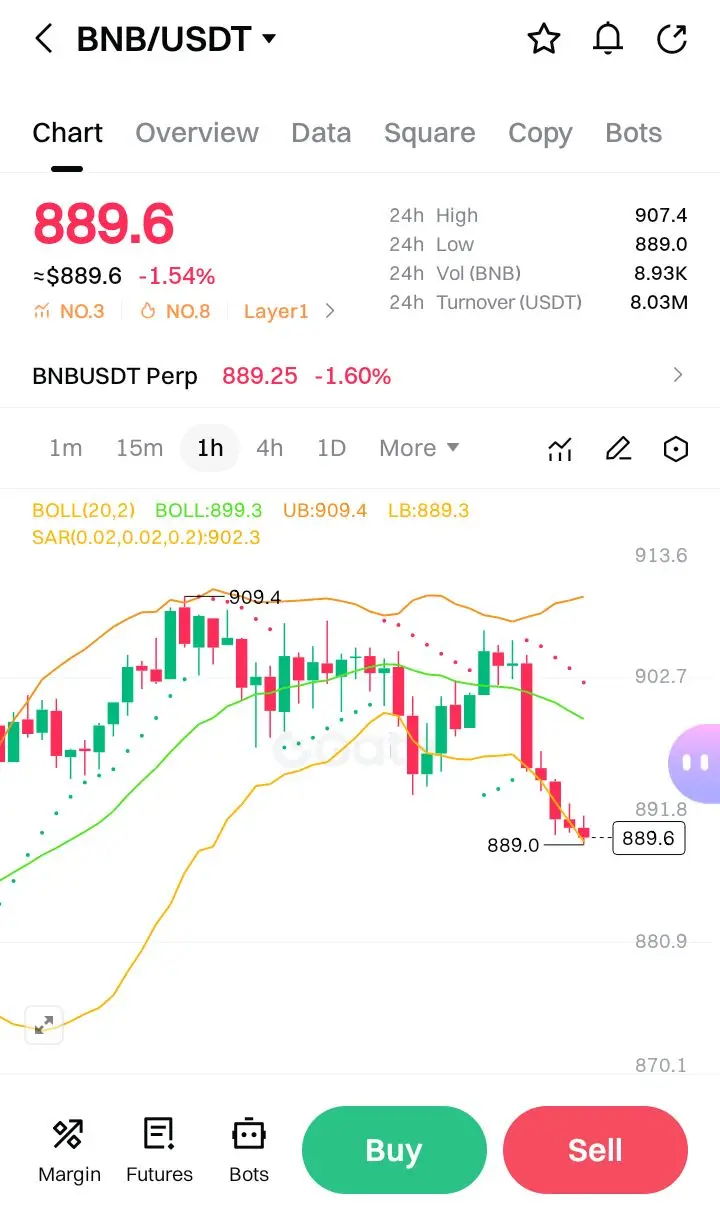
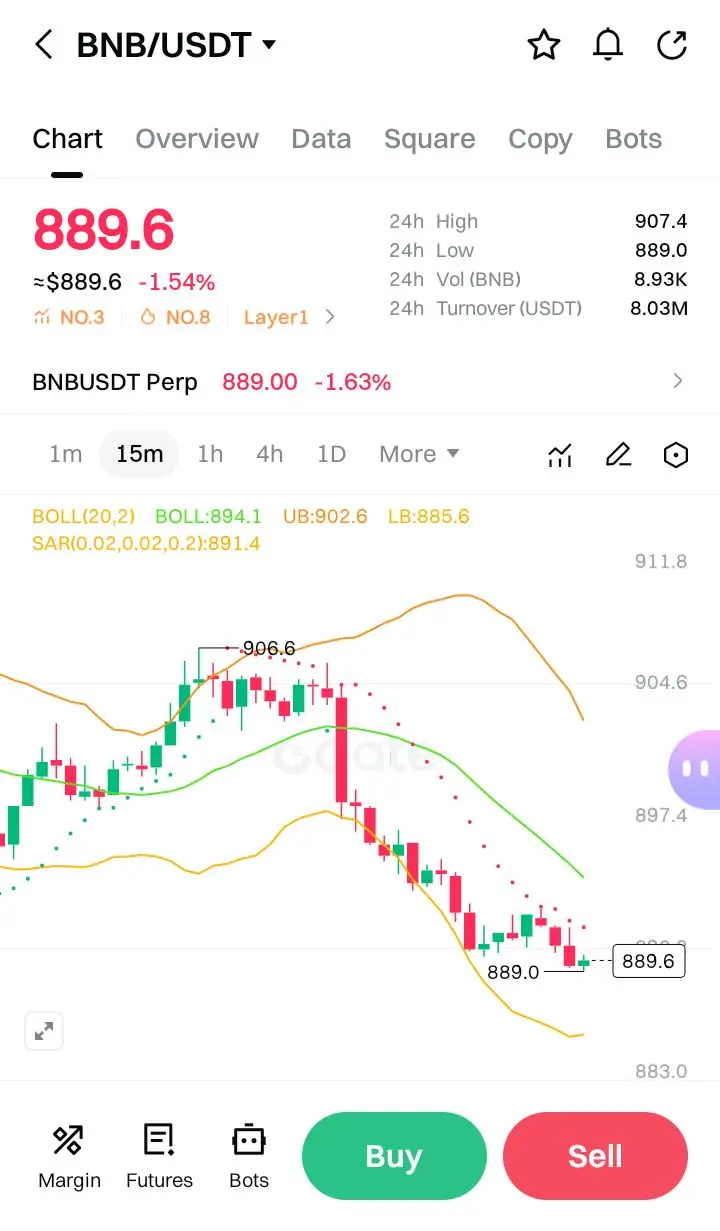
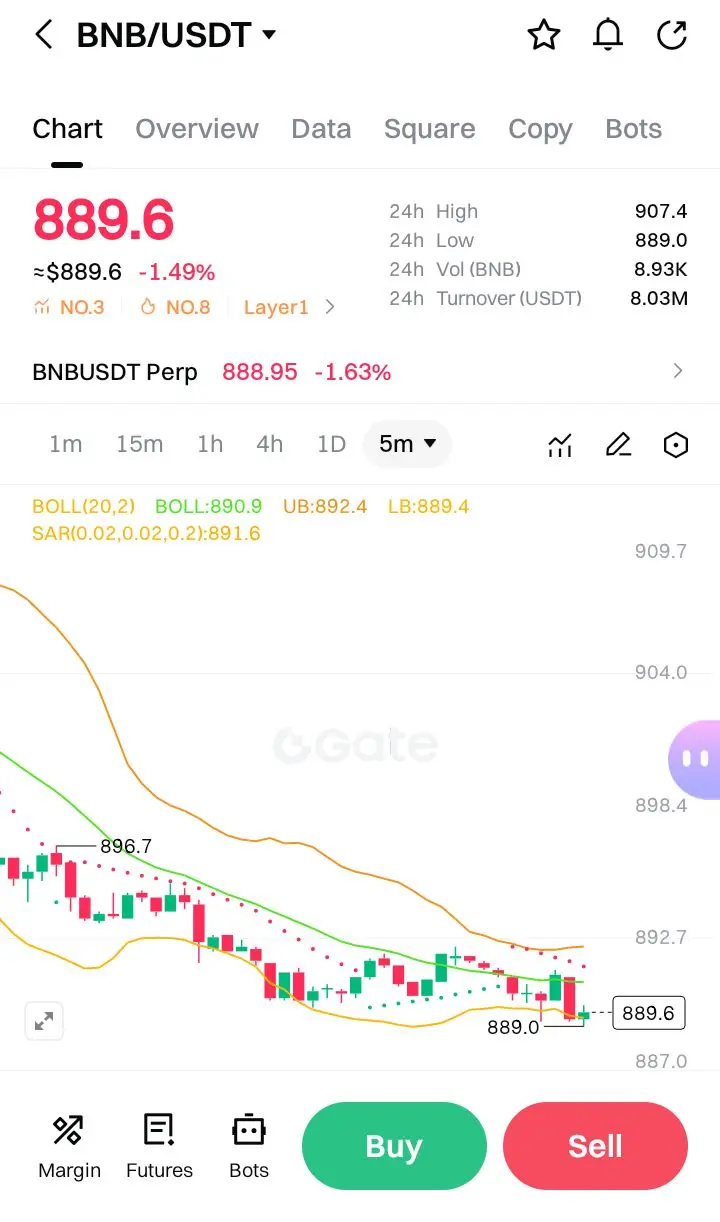
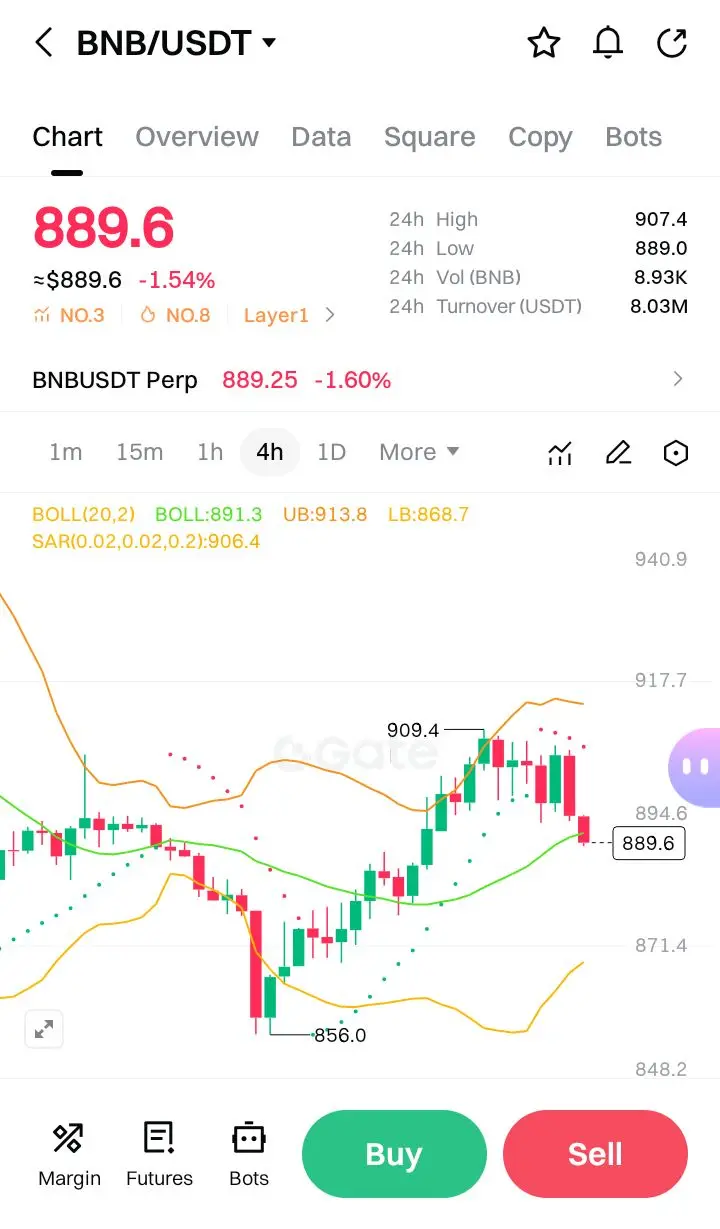
$BNB #GateLiveMiningProgramPublicBeta
BNB/USDT charts across multiple timeframes, Here is the professional analysis and trade plan.
1. 4H Chart - Identify Direction (Primary Trend)
Direction: Bearish.
· Price Action: Price at 889.6 is trading significantly below the 4H Bollinger Band midline (BOLL: 891.3), indicating bearish momentum.
· Structure: The chart shows a sequence of lower highs. The current price is near the 24h low (889.0), testing a key level.
· Key Level: The Parabolic SAR (SAR: 906.4) is well above price, confirming the downtrend. The Lower Bollinger Band (LB: 868.7) is the nex
BNB-3,79%
- Reward
- 2
- 3
- Repost
- Share
GateUser-77bdaf4a :
:
Hold on tight, we're about to take off 🛫View More
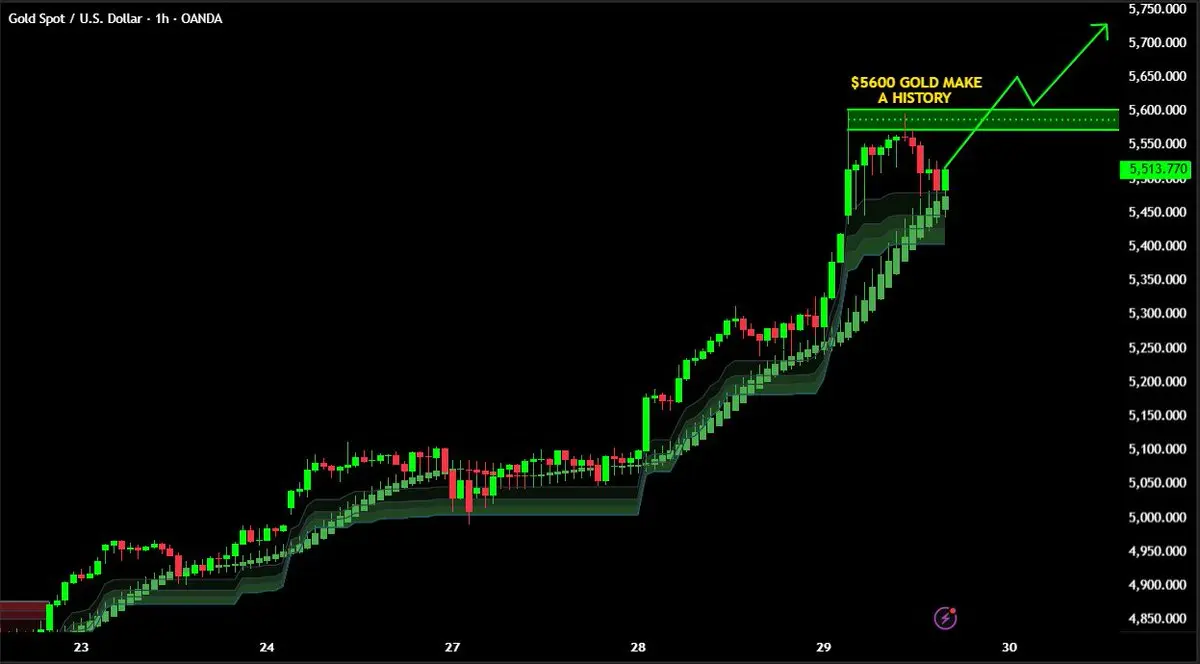
Profit from the peak and still fall, gold $XAU
View Original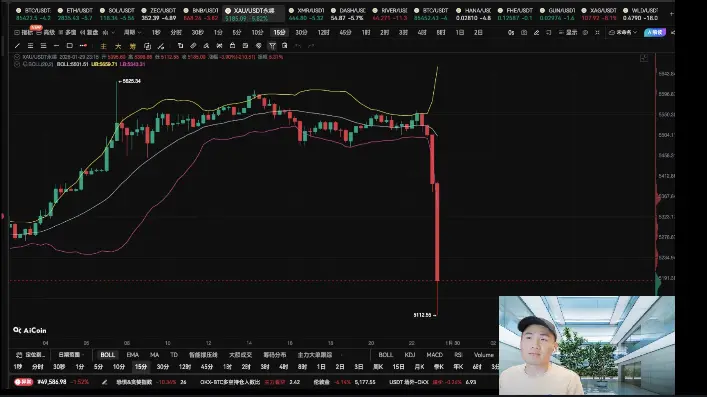
- Reward
- like
- Comment
- Repost
- Share
Robinhood is investing in #crypto #trading #platform Talos at a $1.5 billion valuation. #crypto
- Reward
- like
- Comment
- Repost
- Share
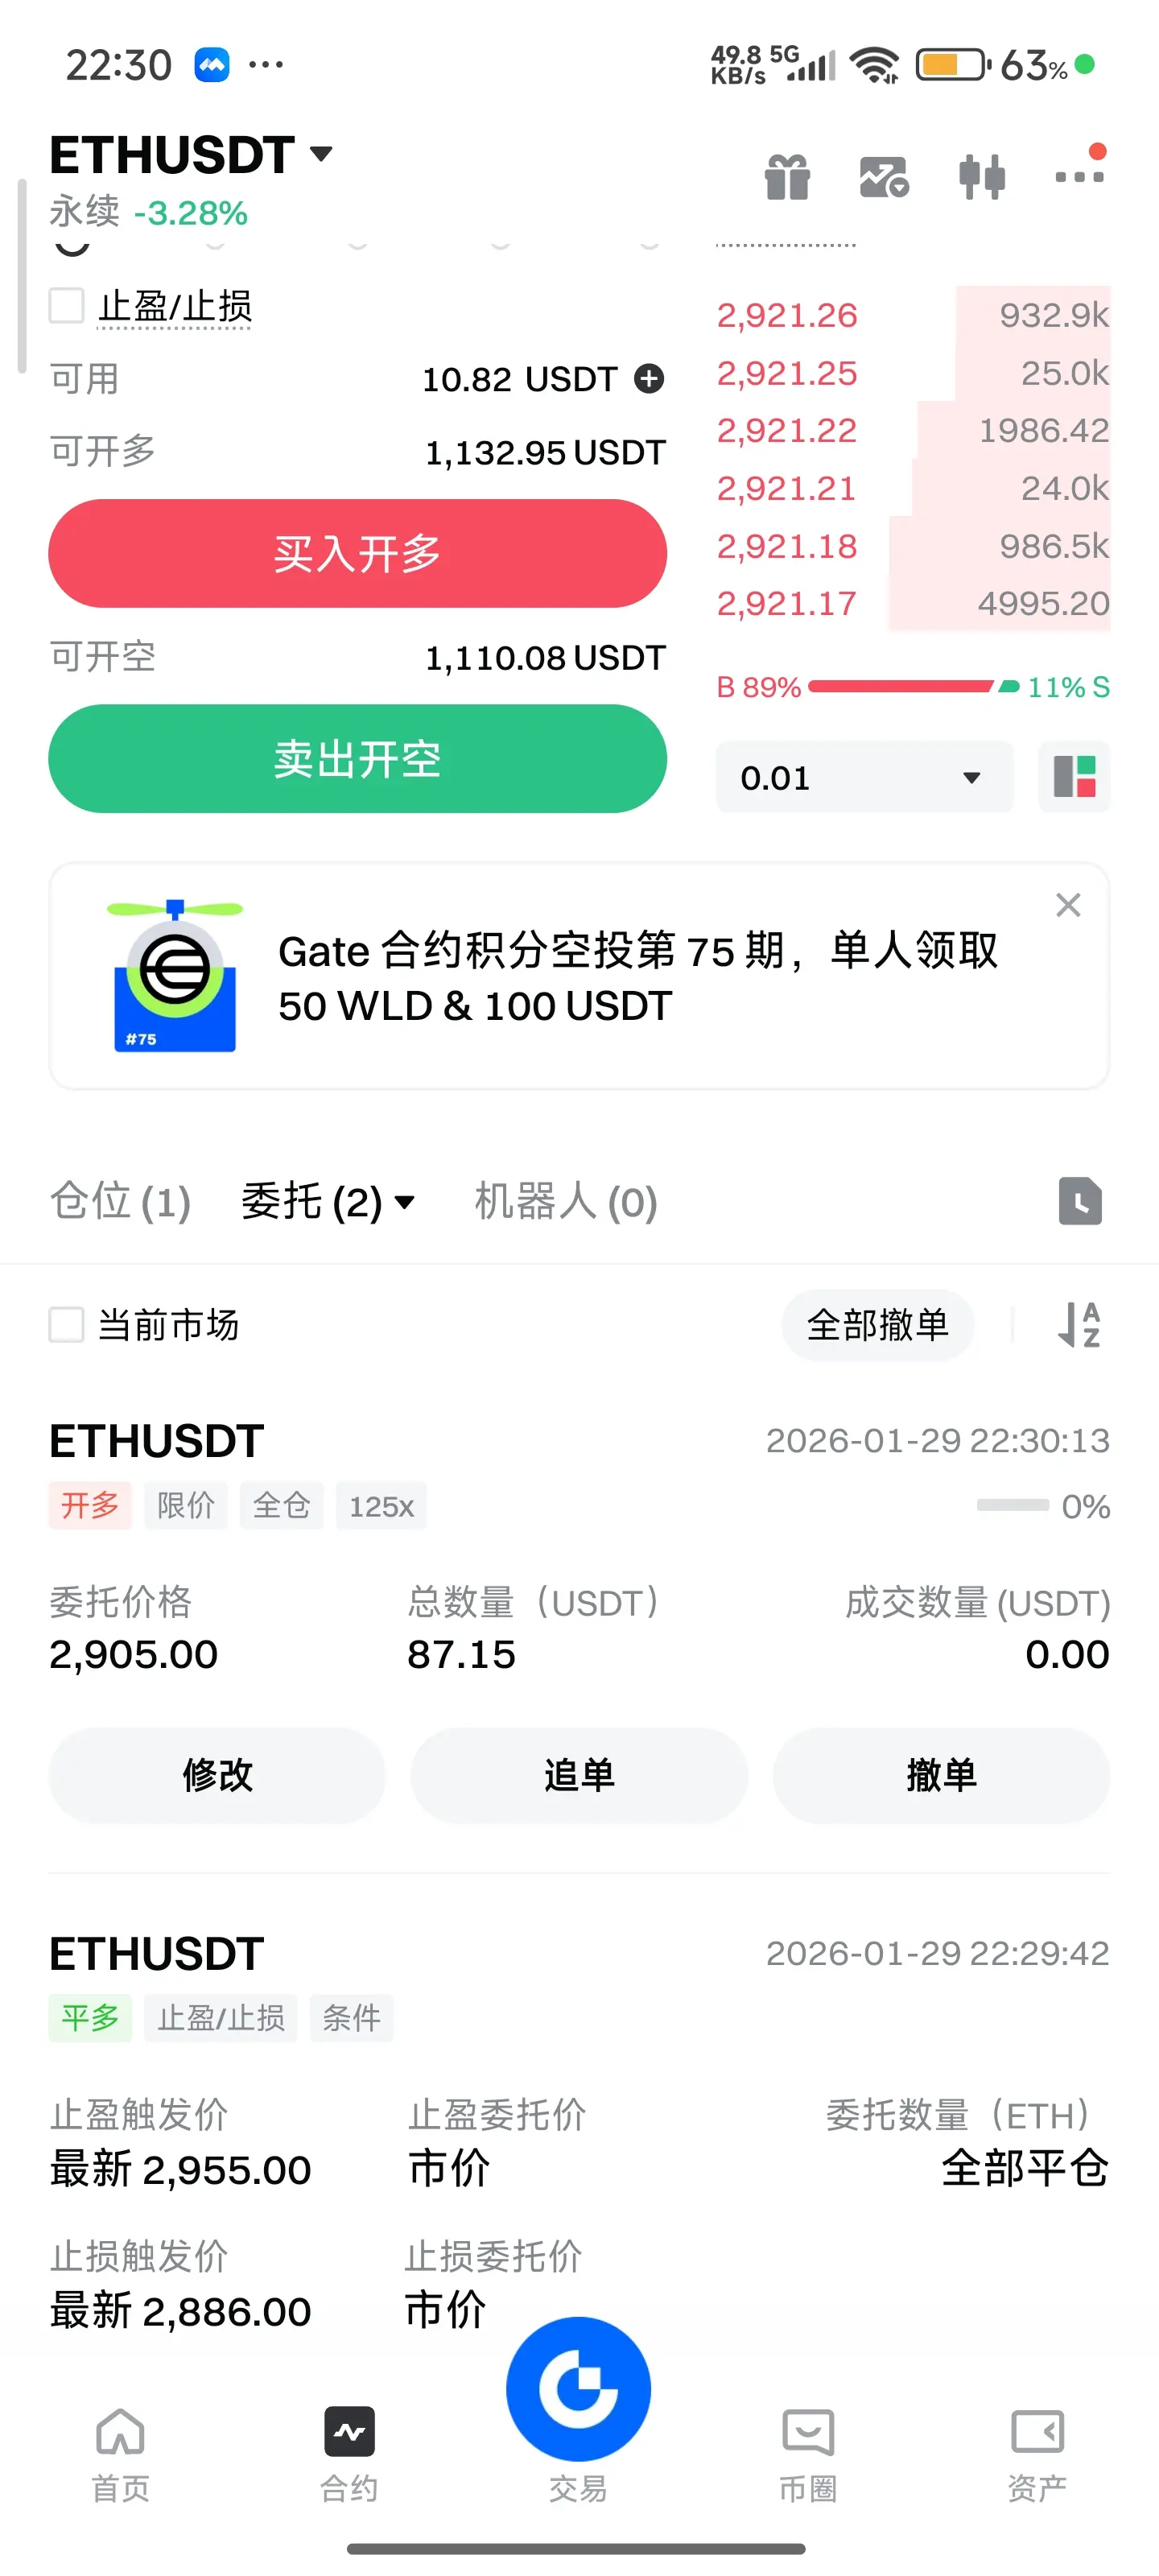
January 29
Yesterday I made money but didn't sell and lost 6 yuan
Today I opened a long position, keep going
View OriginalYesterday I made money but didn't sell and lost 6 yuan
Today I opened a long position, keep going
- Reward
- like
- 2
- Repost
- Share
阿宾稳健盈利:
The conservative can leave now, completing the position for profit, profit.View More
Sometimes, approaching a situation with the mindset of knowing nothing can actually open up new opportunities for learning and growth.
- Reward
- like
- Comment
- Repost
- Share
Aren't you giving me a year-end holiday?
View Original
- Reward
- 2
- 4
- Repost
- Share
SuperHotDog:
Replenishing medicineView More
🚨 JUST IN: Trump says, “We should be paying lower interest rates than any country in the world.”

- Reward
- like
- Comment
- Repost
- Share
Load More
Join 40M users in our growing community
⚡️ Join 40M users in the crypto craze discussion
💬 Engage with your favorite top creators
👍 See what interests you
Trending Topics
View More6.93K Popularity
6.73K Popularity
5.28K Popularity
2.57K Popularity
43.23K Popularity
Hot Gate Fun
View More- MC:$3.56KHolders:21.63%
- MC:$3.29KHolders:10.00%
- MC:$3.32KHolders:10.00%
- MC:$3.33KHolders:10.00%
- MC:$3.33KHolders:10.00%
News
View MoreSpot silver intraday decline once expanded to 8%, spot gold fell below the $5200 mark again
2 m
Trader Reverses Position on U.S. Government Shutdown Bet
2 m
The Ethereum Foundation and Vitalik will create a $220 million security fund funded by "TheDAO"
4 m
Ethereum Foundation and Vitalik plan to create a $220 million security fund
4 m
US stock cryptocurrency concept stocks collectively decline, BMNR drops 8.4%
6 m
Pin