Bitcoin (BTC) Under $30,000? This Cycle May Not Play Out That Way

Bitcoin price has been struggling for months. BTC price is down about 45% from the last all time high near $126,000 in September 2025. That drop has fueled calls that Bitcoin price still has a long way to fall. Some forecasts place the next major floor below $30,000.
ParabolicXBT, a chart analyst who posts under @ParabolicXBT, argues that this expectation may be leaning too heavily on old cycles. ParabolicXBT says several signals now line up with conditions that have marked major BTC bottoms in the past.
The point is not that Bitcoin must reverse tomorrow. The point is that the market structure around BTC has changed. That change can affect how deep downside moves can get.
ParabolicXBT describes the current BTC price area as multi year support. His view leans on cycle structure. Previous bear markets produced sharp drawdowns, yet each cycle has delivered a smaller peak to trough decline than the one before it.
That idea matters because many bearish targets still map Bitcoin price using the 2018 template. ParabolicXBT argues that repeating an $84% collapse assumes the market works the same way it did years ago.
He points to spot Bitcoin ETFs and larger pools of institutional capital as a difference that can influence downside behavior. He also notes that long term holders with large allocations often defend key cost zones. That dynamic can change how quickly panic moves extend.
Monthly RSI And Extreme Fear Add Context To This BTC Price Drop
ParabolicXBT also points to the monthly RSI, which he says has reset toward historic low territory. Momentum indicators do not predict exact bottoms. They can help frame when selling pressure has reached levels that tend to appear late in a drawdown.
ParabolicXBT also cited a Fear and Greed Index reading of 5. That metric tracks sentiment. A single reading does not confirm anything on its own. The message is that fear can cluster near turning points. Extreme readings often appear after large losses have already happened.
This combination gives ParabolicXBT a clear argument. He believes Bitcoin price is closer to a cycle low than many expect. He also believes downside targets near $20,000 to $30,000 assume the same crash structure will repeat in a market that now has different participants.
@ParabolicXBT / X
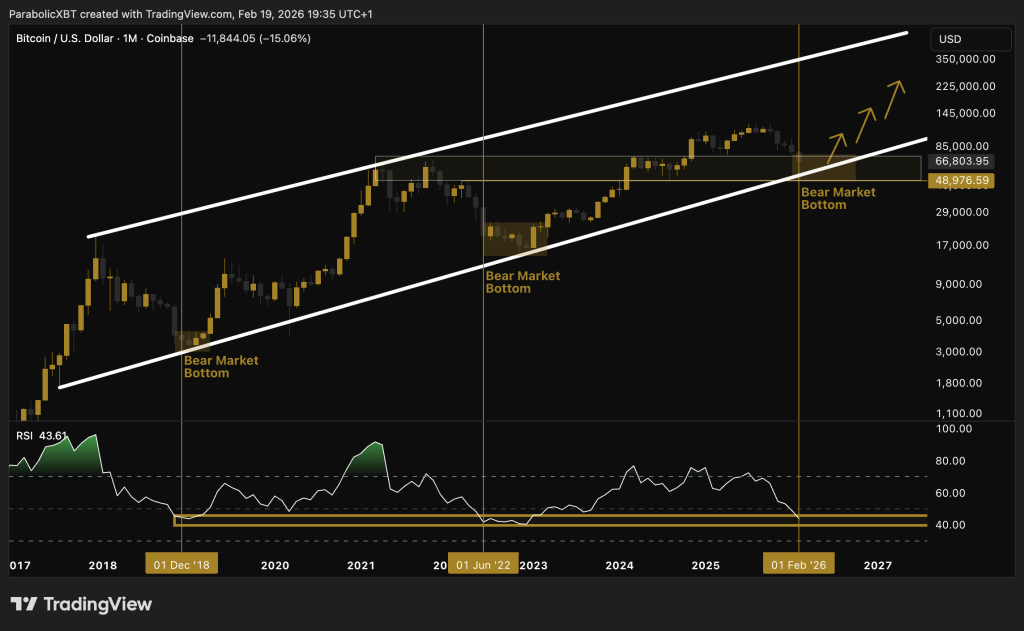
The Chart Shows Bitcoin Price Holding An Ascending Channel Since 2017
The attached chart adds a technical layer to this debate. It shows Bitcoin price moving inside a broad ascending channel that has guided BTC since 2017. Prior bear market bottoms on the chart sit near the lower boundary of that channel. Labels on the chart mark those low zones in late 2018 and mid 2022.
Price action now sits closer to that same lower region again. The chart also shows a potential base area near $48,976. That level appears near the lower channel support.
It also sits beneath the current BTC price region near $67,000. The structure implies that Bitcoin price could still dip further without breaking the long term upward channel.
ParabolicXBT frames this as a difference between a deep crash and a controlled base. The chart does not require Bitcoin to fall below $30,000 to complete a cycle reset. A move toward the lower channel, followed by stabilization and a bounce, fits the historical structure displayed on the chart.
Japan Stocks Flash Rare Signal Not Seen Since 2005_**
Bear markets can stay painful even after the worst selling ends. Bitcoin price can chop for months. BTC price can also retest lows more than once. ParabolicXBT does not claim that a bottom must be locked in today.
He argues that the conditions for a major bottom are already visible. He also argues that the path to $30,000 becomes less compelling when long term support, momentum resets, and market structure shifts show up together.
Related Articles
Bitcoin Whales Retreat as Retail Investors Buy: Market Trends Reveal Divide
When the "Old Map" No Longer Applies: A Review of 8 "Failing Classic Cryptocurrency Indicators"
Analysis: BTC believers' holdings have hit a new high for this cycle, and the bottom of the bear market is no longer far away.