Post content & earn content mining yield
placeholder
gatefun
gatefun
$PEPE pressing around 0.000003379 ... a pretty interesting zone right now.
As long as it defends the 0.000003370–0.000003375 support pocket, there’s room for a push up to the 0.000003385 – 0.000003395 area.
But if it breaks below 0.000003370, momentum weakens quickly and we could pull back to the 0.000003355 – 0.000003365 range.
#PEPE #Rmj-Trades
PEPE3,74%
post-image
  • Reward
  • Comment
  • Repost
  • Share
#GOLD
$4,999 is an important support level. If it breaks, it may want to move down into the support band. As the probability of Fed rate cuts keeps getting pushed back, the slowdown in GOLD is natural
post-image
  • Reward
  • Comment
  • Repost
  • Share
What do you call this pattern?
post-image
  • Reward
  • Comment
  • Repost
  • Share
MYJB
MYJB
蚂蚁金币
gatefun
Created By@MunanYiBufan
Listing Progress
100.00%
MC:
$1.59K
More Tokens
Bitcoin may be approaching the historical bear market bottom range.
gate liveLIVE
2.179
live-coin
  • Reward
  • 2
  • Repost
  • Share
Unoshivip:
Thanks for information
View More
Amy Madigan has won an #Oscar    award for Best Supporting Actress. Congratulations 🎉
post-image
  • Reward
  • Comment
  • Repost
  • Share
$SOL
After a sharp drop SOL has spent ~38 days consolidating around the $80–$90 range
Key things to watch 👇
• Strong sideways accumulation forming
• Resistance sitting near $95–$100
• Break above that could trigger momentum expansion
If buyers step in SOL → $100+ becomes a realistic next move.
If price fails to break above the resistance i mentioned then we can expect price to trade in the same range
SOL4,76%
post-image
  • Reward
  • Comment
  • Repost
  • Share
Dota Sniper
Maximum value [酷]
Do what you want to do right away, don't keep waiting just because you want to do it with someone else. Most likely you'll end up neither waiting for that person nor accomplishing what you wanted to do.
$BTC $ETH
BTC2,17%
ETH3,91%
View Original
post-image
post-image
post-image
  • Reward
  • 1
  • Repost
  • Share
MingLouXvip:

q
q
38591
38011
🔹 The XRP ETF has attracted $1.4 billion in capital inflows, with strong retail demand.
gate liveLIVE
1.520
live-coin
  • Reward
  • Comment
  • Repost
  • Share
$BTC SHORT
My stop-loss is set to 72 400$.
That way, no surprises and no real losses if Bitcoin pulls back and breaks above the highs.
Nothing has really moved lately.
However, $BTC could always try a bloody red candle back down so I'm prepared for both scenarios.
BTC2,17%
post-image
  • Reward
  • Comment
  • Repost
  • Share
Bitcoin Technical Outlook: Bitcoin Stabilizes After Sharp Correction, Attempts to Form Short-Term Base
Bitcoin remains within a broader corrective structure after failing to reclaim the 93,000–100,900 resistance zone, which corresponds to the 0.5–0.618 Fibonacci retracement cluster. The rejection from this zone accelerated selling pressure, pushing Bitcoin toward the lower end of its broad range.
Currently, the price is consolidating around the 70,000–72,000 zone, slightly above the cycle low near 59,980, suggesting the market is attempting to establish a short-term accumulation base following
BTC2,17%
View Original
post-image
post-image
asiftahsinvip
BTC Technical Outlook: Bitcoin Stabilizes After Sharp Correction, Attempting Short-Term Base
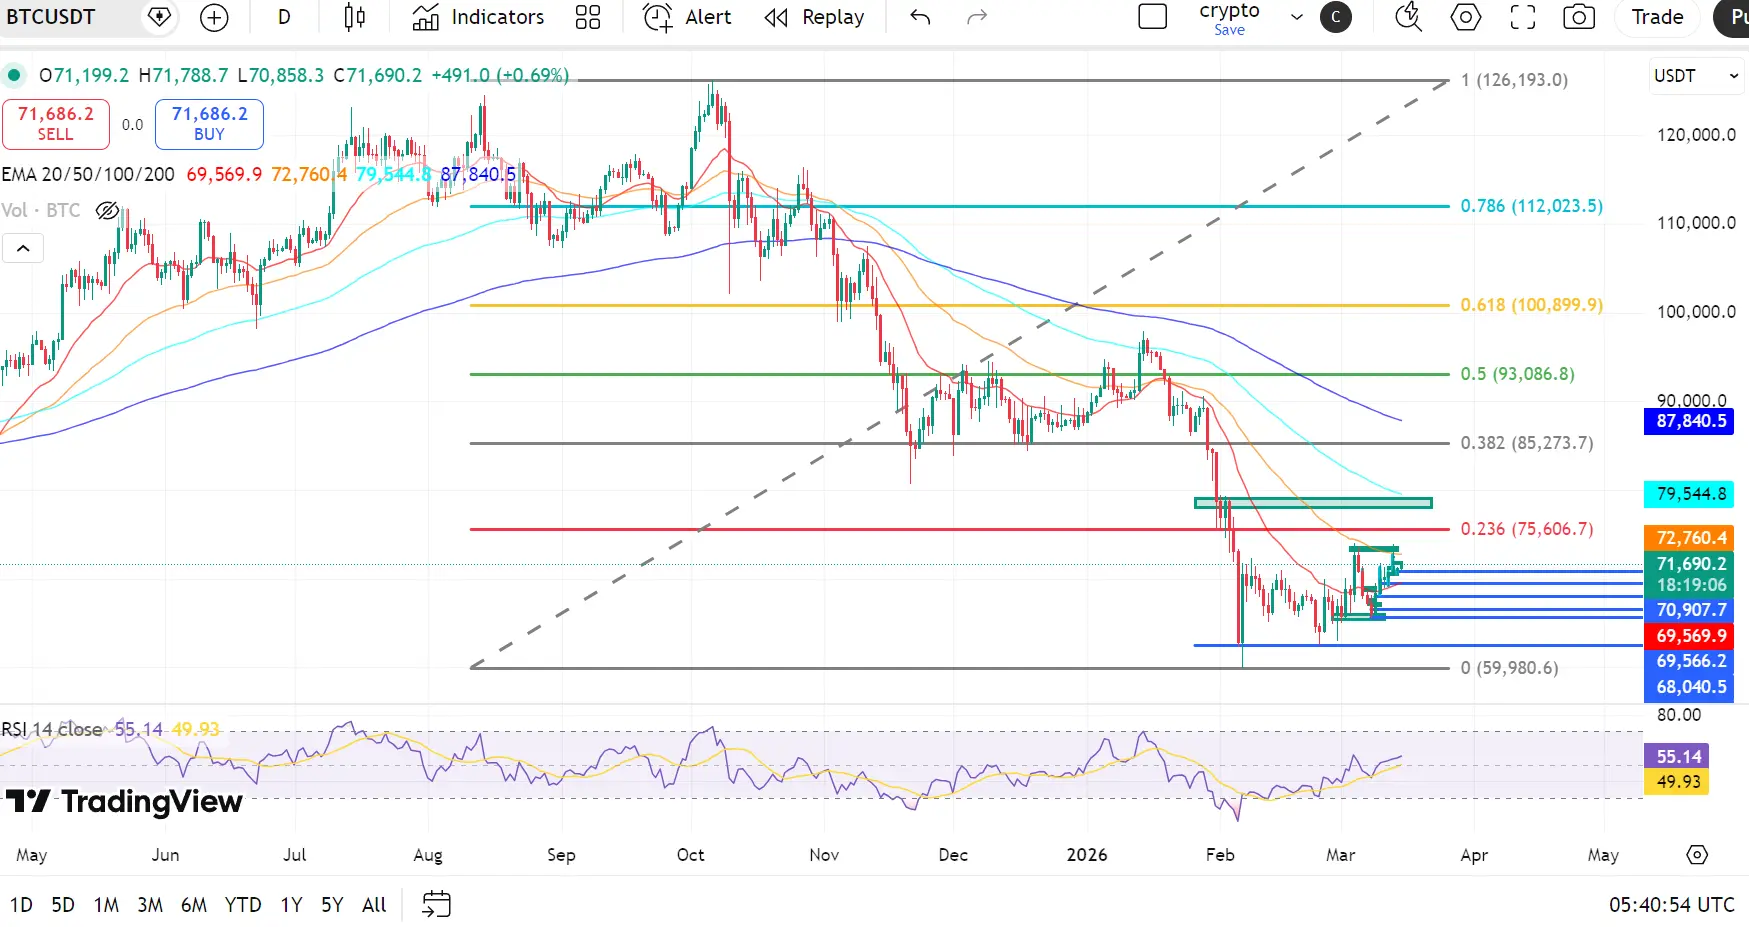
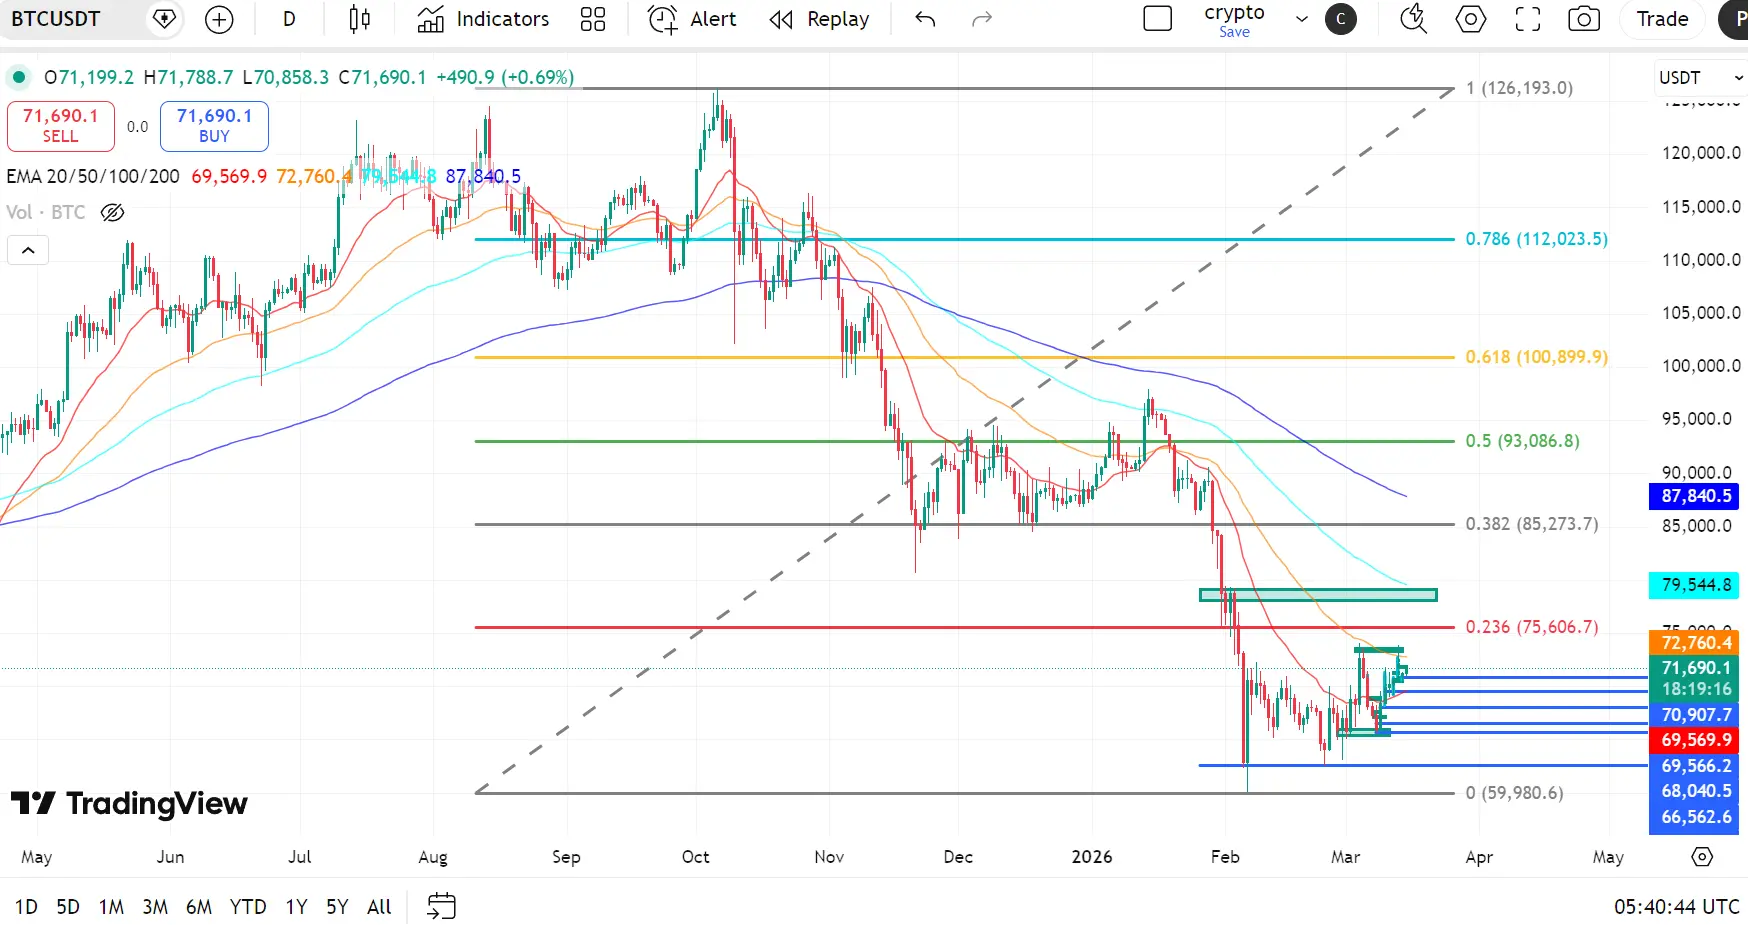
Bitcoin remains within a broader corrective structure after failing to reclaim the $93,000–$100,900 resistance zone, which corresponds with the 0.5–0.618 Fibonacci retracement cluster. The rejection from this region accelerated selling pressure, driving BTC toward the lower end of its macro range.
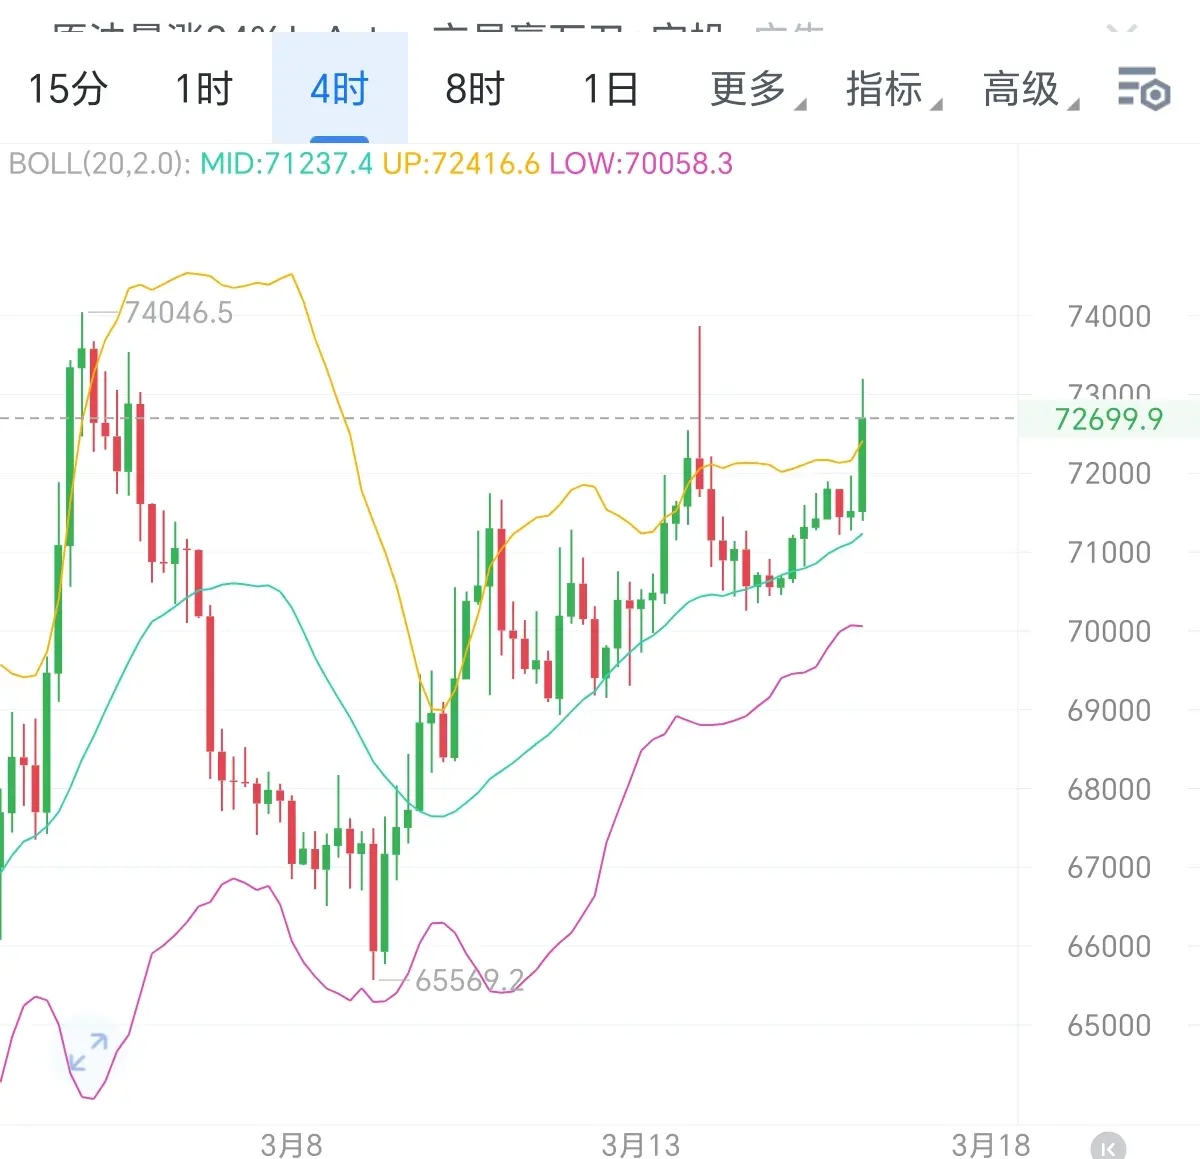
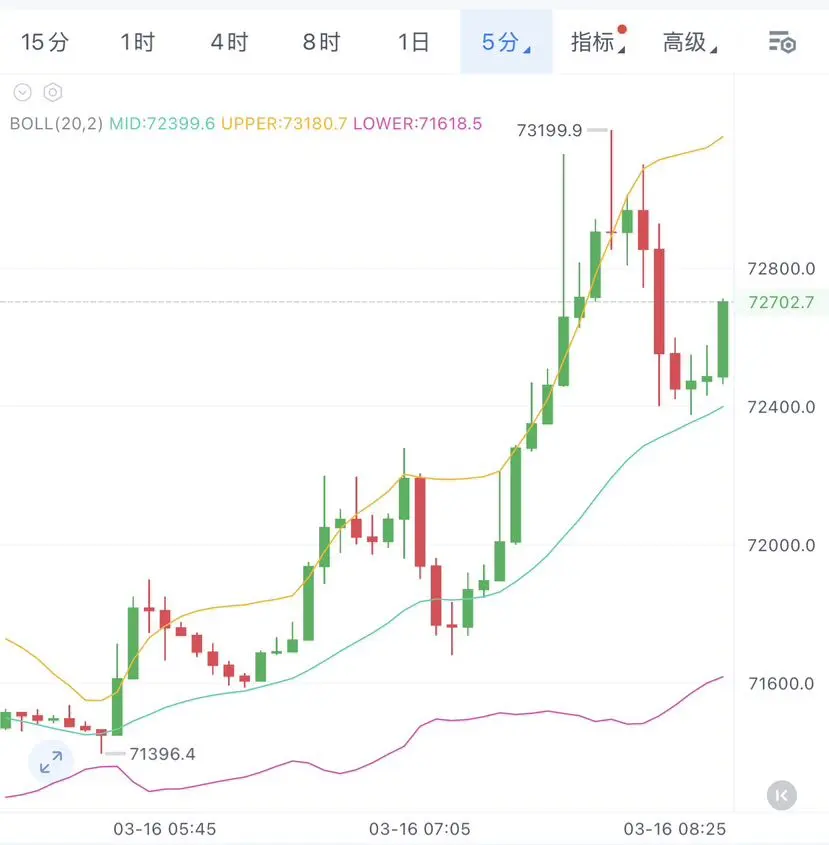
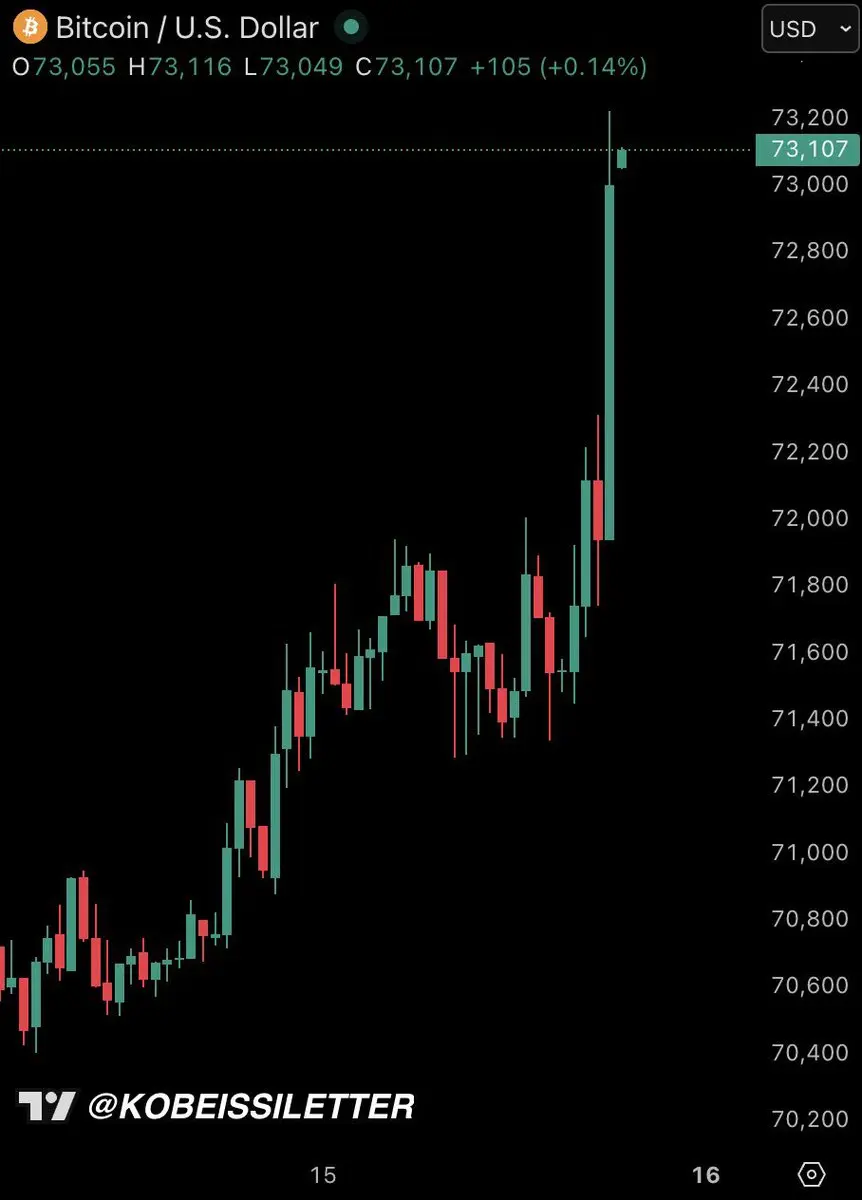
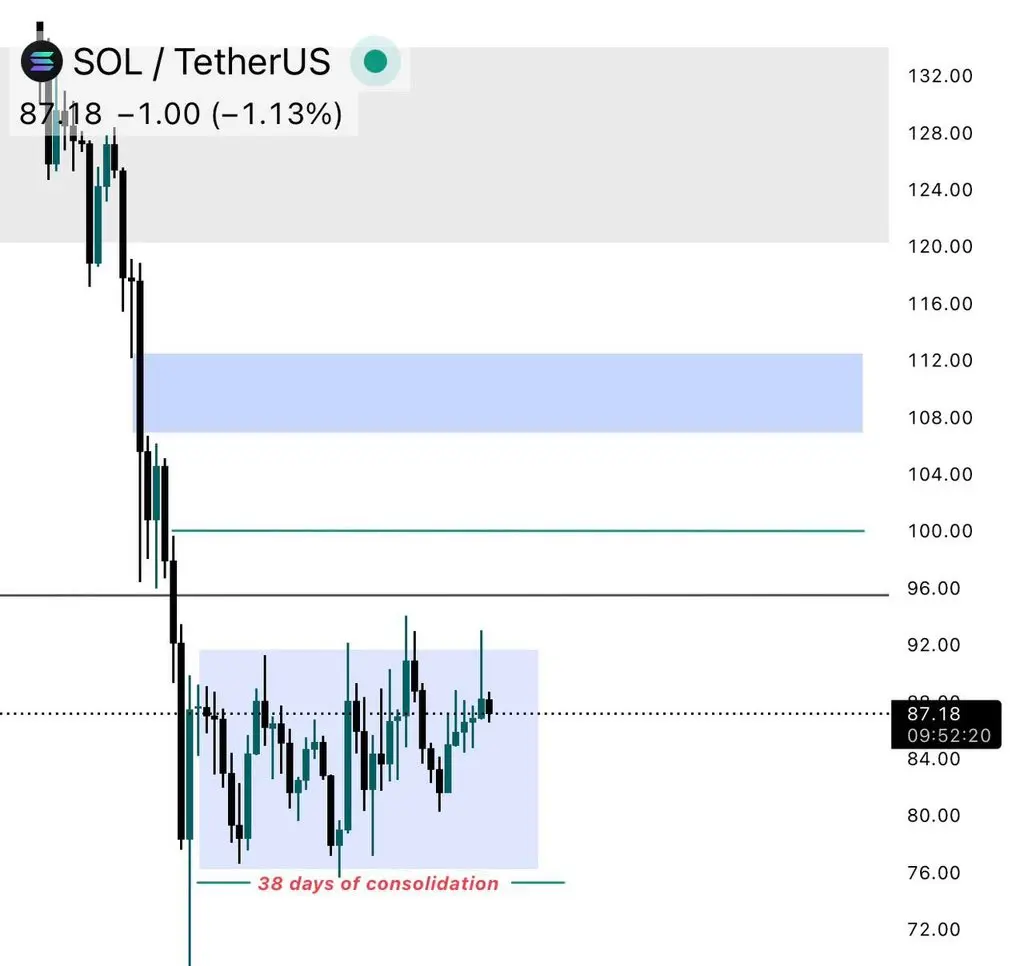
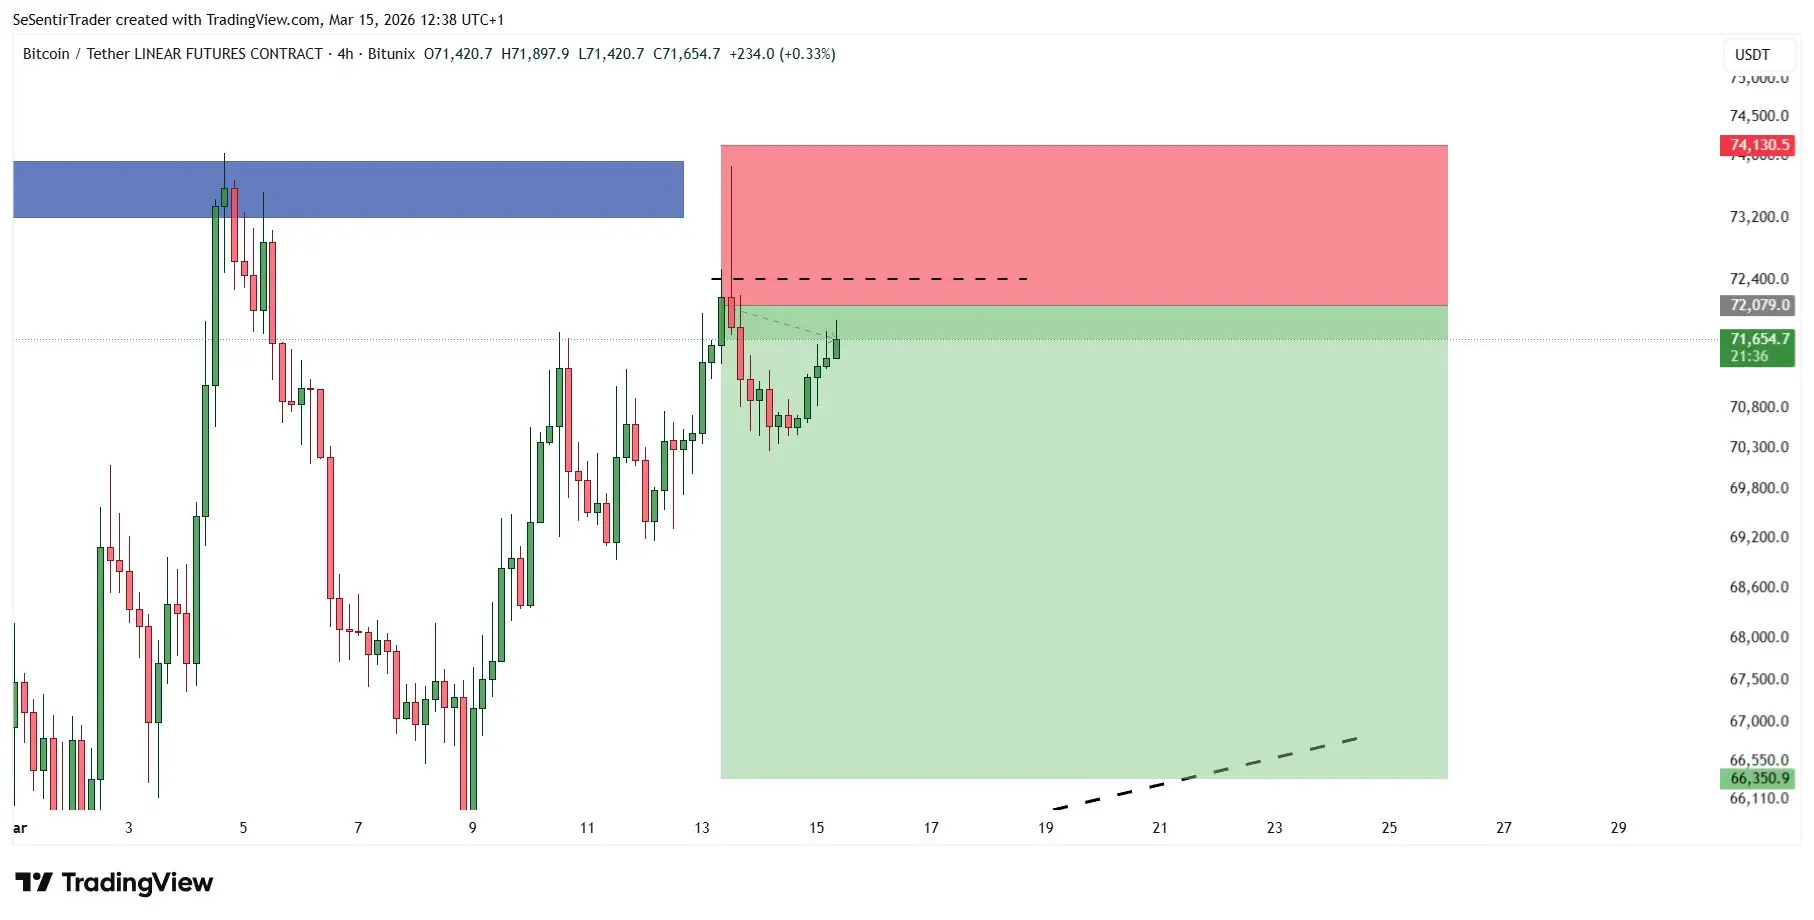
Currently, price is consolidating around the $70,000–$72,000 region, slightly above the cycle base near $59,980, suggesting that the market is attempting to establish a short-term accumulation base after the recent capitulation move.
EMA Structure (Bearish Bias)
20 EMA: $69,569
50 EMA: $72,760
100 EMA: $79,544
200 EMA: $87,840
Bitcoin is trading below the 50, 100, and 200 EMAs, confirming a bearish medium-term structure despite the recent short-term recovery.
The 20 EMA around $69,500 is currently acting as short-term dynamic support, while the 50 EMA near $72,700 represents the first significant resistance barrier. The larger gap between the 100 and 200 EMAs highlights the broader corrective trend that began after the macro rejection.
Fibonacci & Price Structure
0.786 Fib: $112,023
0.618 Fib: $100,899
0.5 Fib: $93,086
0.382 Fib: $85,273
0.236 Fib: $75,606
Fib 0: $59,980
Bitcoin is currently trading below the 0.236 Fib level at $75,606, confirming continued structural weakness on the higher timeframe.
The recent bounce from $65,000–$68,000 demand indicates that buyers are attempting to defend the region above the $60,000 macro support. However, the market must reclaim $75,600 to signal a meaningful shift toward a broader recovery phase.

RSI Momentum
RSI is currently around 55, indicating improving short-term momentum. The indicator has moved above the neutral 50 level, suggesting that buying pressure is gradually returning.
However, the absence of strong bullish divergence suggests that the current move may still represent a relief rally within a broader corrective trend.
📊 Key Levels
Resistance
$72,700 (50 EMA)
$75,600 (0.236 Fib)
$85,200 (0.382 Fib)
Support
$69,500 (20 EMA)
$65,000–$68,000 (short-term demand)
$59,980 (cycle base / Fib 0)
RSI: 55 — neutral to slightly bullish
📌 Summary
Bitcoin is currently consolidating around the $70,000–$72,000 zone after a strong corrective decline. While short-term momentum is improving, the broader market structure remains bearish below $75,600.
A sustained breakout above $75,600 could open the door for a recovery toward $85,000–$93,000, while failure to hold the $65,000 support zone would increase the probability of another downside expansion toward the $60,000 macro support level.
$BTC
#CryptoMarketBouncesBack
repost-content-media
  • Reward
  • Comment
  • Repost
  • Share
$SUI pressing around $1.0135 ... a pretty interesting zone right now.
As long as it defends the $1.005–$1.01 support pocket, there’s room for a push up to the $1.018 – $1.025 area.
But if it breaks below $1.005, momentum weakens quickly and we could pull back to the $0.995 – $1.00 range.
#SUI #Rmj-Trades
SUI2,23%
post-image
  • Reward
  • Comment
  • Repost
  • Share
Morning Analysis
1-hour cycle: Price oscillates and breaks through the downtrend channel, with downside room gradually opening; market rhythm is relatively slow, pullbacks accompanied by repeated corrections, frequent switching between long and short momentum, but the overall oscillating downtrend pattern is clear, short-term strategy focuses on selling on rebounds.
4-hour cycle: Overall still in a downtrend, short-term rebounds and pullbacks are just oscillating repetitions in weak market conditions, with high probability of a pullback after rallying higher, continuing the weak pattern. Core
BTC2,17%
ETH3,91%
View Original
post-image
  • Reward
  • Comment
  • Repost
  • Share
LUXY
LUXY
luxury
gatekol
Created By@Xyuge
Subscription Progress
0.00%
MC:
$0
More Tokens
🇨🇳 Hong Kong March 16, 8:17 AM, ETH Strategy
Reference Short: 2247————2260
Reference Long: 2140————2146
【Stop Loss 30 or 50 pips】Large volatility: Enlarge stop loss, wicks sweeping liquidity don't count as breakout or breakdown
Resistance: 2198———2210 (Probability 61%)
Resistance: 2247———2260 (Probability 45%)
Resistance: 2300———2320 (Probability 23%)
↕↔↕
Support: 2160———2166 (Probability 38%)
Support: 2140———2146 (Probability 55%)
Support: 2120———2126 (Probability 45%)
Support: 2090———2096 (Probability 38%)
Support: 2070———2076 (Probability 32%)
【The above content is for reference o
ETH3,91%
View Original
post-image
post-image
  • Reward
  • 5
  • Repost
  • Share
PresidentOfTheUnitedStatesvip:
Hop on board!🚗
View More
Today's Bitcoin Strategy:
The daily chart shows an ascending flag pattern, with the Bollinger Band's middle line turning upward, indicating a mid-term bullish bias; the 4-hour MACD shows a death cross and RSI is neutral, with bulls being blocked after pushing higher; the hourly chart is consolidating with low volume in the 69,500–71,500 range, awaiting directional confirmation.
Bitcoin:
Heading north around 72,800-73,300, target 73,500-74,000
$BTC
BTC2,07%
View Original
post-image
post-image
  • Reward
  • Comment
  • Repost
  • Share
【MYXUSDT Signal】Long: Confirmation of Volume Breakout with Pullback on 4H
The price completed a key breakout within the 4H timeframe on March 15th. The first 4H candle (04:00-08:00) surged from 0.3628 to 0.4357 with a volume of 60.47 million, followed by the second candle (08:00-12:00) continuing to expand volume to 102 million, with the price reaching a high of 0.5164. This is a typical volume-price resonance breakout, with clear signs of institutional capital entering the market.
After the breakout, the price retraced, but the retracement showed signs of decreasing volume. From 12:00 to 20:0
BTC2,17%
ETH3,91%
SOL4,76%
post-image
  • Reward
  • Comment
  • Repost
  • Share
【ENS Long Signal】4H Volume Breakout of Neckline, Institutional Capital Confirmed Entry
Volume breakout above key resistance at $6.154 on the 4-hour chart, trading volume at recent highs, Open Interest (OI) stable at elevated levels with no divergence, indicating genuine new capital inflow.
1-hour RSI strong momentum without overbought conditions, EMA20/EMA50 in bullish alignment, support holding effective.
✅ Direction: Long
✅ Entry: 6.056–6.061 (retest of EMA50 support)
✅ Stop Loss: 6.055 (break below entry zone floor)
✅ Target 1: 6.078 | Target 2: 6.087
📌 Strategy:
Reduce position by half at
ENS3,76%
ETH3,91%
BTC2,17%
View Original
post-image
post-image
蓝龙虾
蓝龙虾蓝龙虾
MC:$2.87KHolders:2
2.68%
  • Reward
  • Comment
  • Repost
  • Share
GM ☕🍃
One lesson for this morning: "Don't rush to get rich quickly" - enjoy the process, okay.
Don't go all in
Don't leverage excessively
Don't FOMO
Don't be greedy
Don't do unlawful things
Don't blame circumstances too much
Most importantly
Don't idolize influencers - they're human too, not gods
Everyone has their own destiny line
View Original
post-image
  • Reward
  • Comment
  • Repost
  • Share
#SOLETFNetInflow$3.92M
📈 SOL ETF Net Inflow $3.92M — Institutional Appetite Rising
The Solana ETF has reported a net inflow of $3.92 million, highlighting growing interest from institutional investors.
ETF inflows usually signal:
• Confidence in the underlying asset
• Increasing participation from traditional finance
• Potential momentum for broader crypto markets
• Measured adoption rather than speculative hype
Key angles traders and analysts are watching:
📌 Whether inflows continue in coming weeks
📌 Correlation with spot SOL price
📌 Impact on liquidity and market depth
📌 Momentum in re
SOL4,76%
DEFI-5,56%
post-image
  • Reward
  • 1
  • Repost
  • Share
Nancypolkvip:
To The Moon 🌕
Bitcoin OBV looking good. Bears will look to short the mean revision, bulls will be looking for continuation past it. Both scenarios in my opinion mean higher short term. Closing above $73,500 means higher soon, rejecting there just means delayed a bit.
$84k target in < 2 months
BTC2,17%
post-image
  • Reward
  • Comment
  • Repost
  • Share
American women are built differently.🪖🪖🎖️
post-image
  • Reward
  • Comment
  • Repost
  • Share
Load More