This comprehensive analysis examines Arbitrum (ARB) token's market position and investment outlook from 2026 to 2031. ARB, trading at $0.2219 with a $1.27 billion market cap, serves as a leading Ethereum Layer 2 scaling solution. The article analyzes historical price trends, market dynamics, and core influencing factors including token supply mechanisms, institutional adoption, and macroeconomic conditions. Professional price forecasts project 2026 range of $0.1330-$0.2770, with long-term growth potential reaching $0.5822+ by 2031 under favorable conditions. The guide provides diversified investment strategies for different investor profiles, risk management frameworks, secure storage solutions via Gate Web3 Wallet, and detailed assessment of technical, regulatory, and market risks. Suitable for crypto investors seeking strategic ARB positioning and Layer 2 ecosystem exposure.
Introduction: ARB's Market Position and Investment Value
Arbitrum (ARB), positioned as an Ethereum Layer 2 scaling solution, has established significant presence in blockchain infrastructure since its inception in 2023. As of January 14, 2026, ARB maintains a market capitalization of approximately $1.27 billion, with a circulating supply of about 5.72 billion tokens, and the price holds around $0.22. This asset, recognized as a leading optimistic rollup protocol, is playing an increasingly vital role in enhancing Ethereum's scalability and transaction efficiency.
This article will comprehensively analyze ARB's price trajectory from 2026 to 2031, combining historical patterns, market supply-demand dynamics, ecosystem development, and macroeconomic environment to provide investors with professional price forecasts and practical investment strategies.
I. ARB Price History Review and Market Status
ARB Historical Price Evolution Trajectory
- 2023: ARB launched on March 23, 2023, with initial market entry marking the beginning of its price discovery phase
- 2024: ARB reached its all-time high of $2.39 on January 12, 2024, representing a significant milestone in its early development
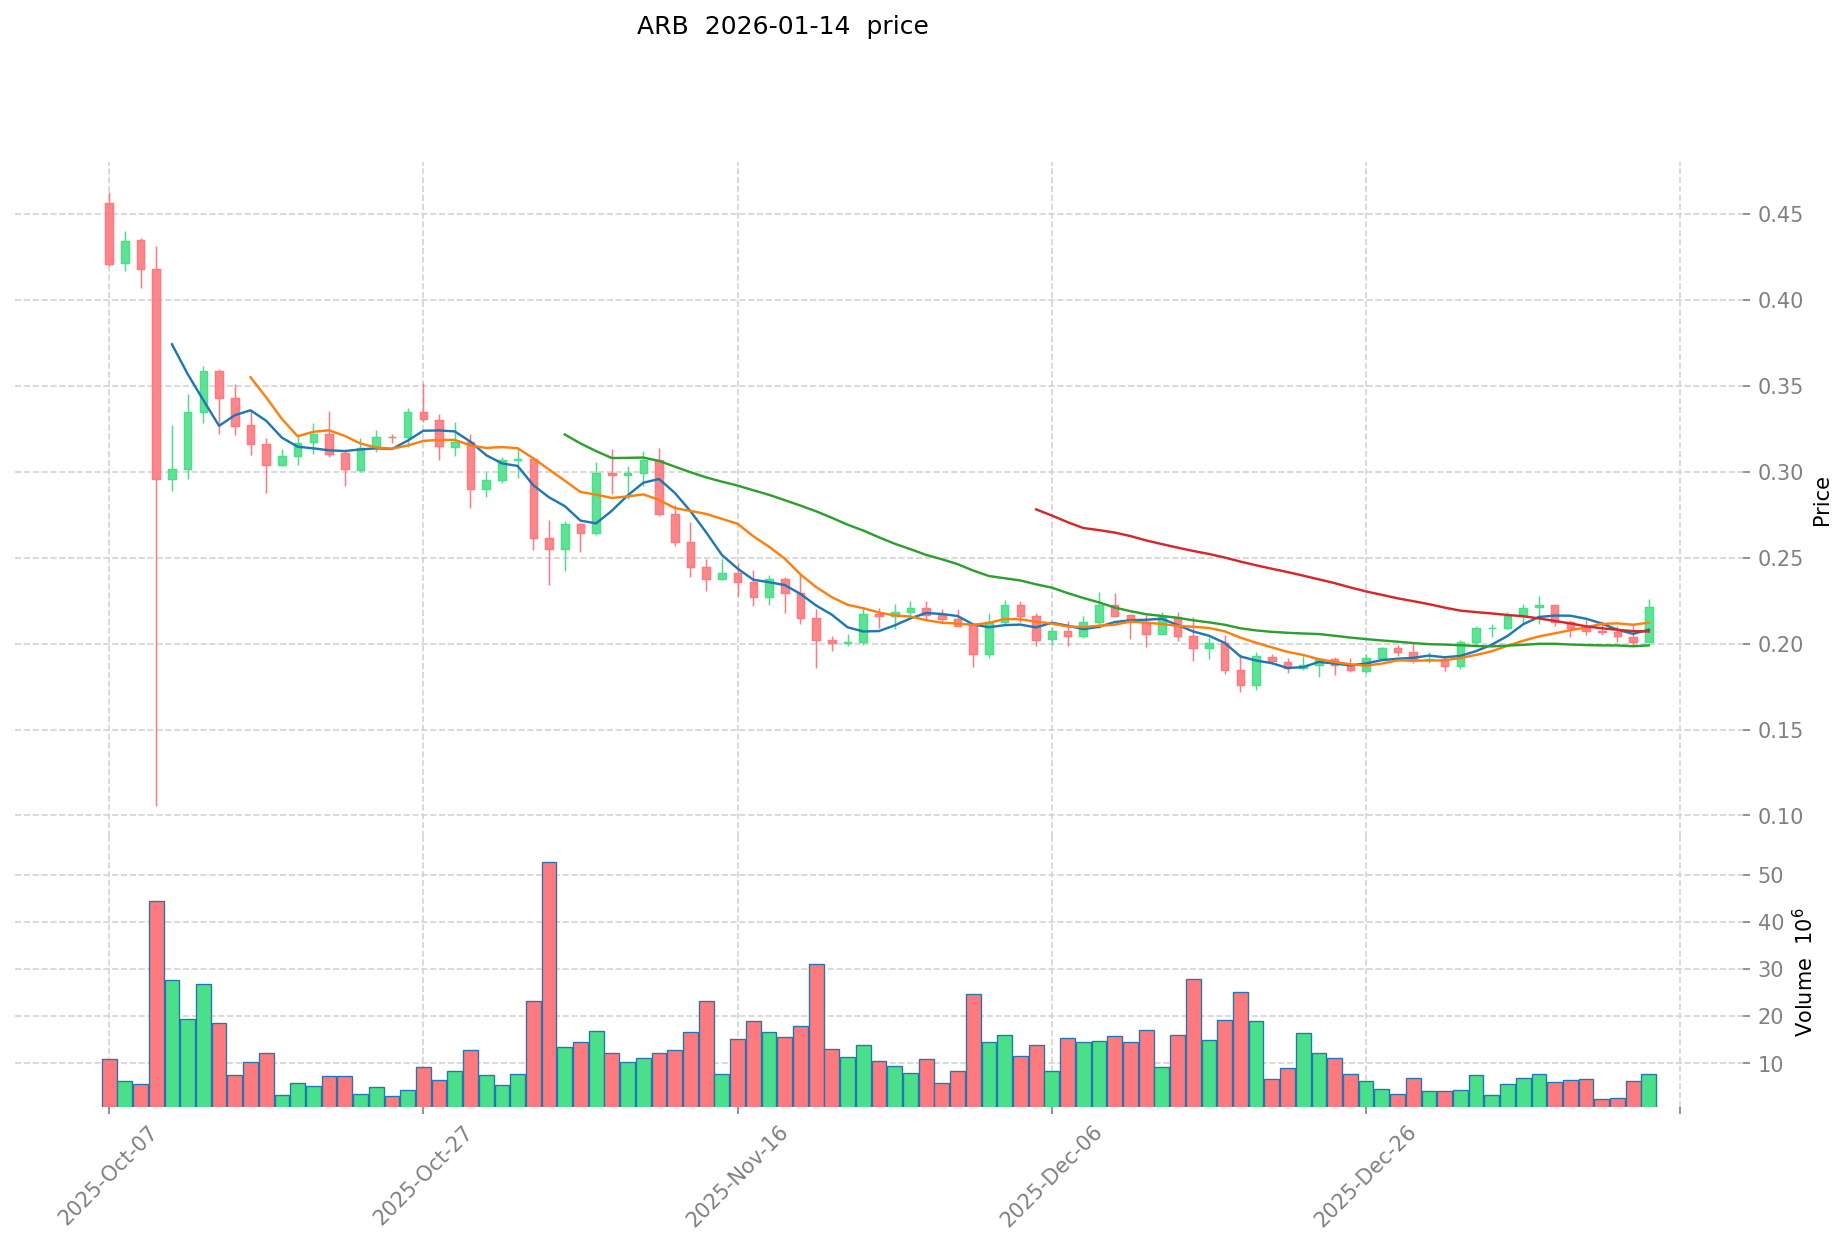
- 2025: ARB experienced substantial market correction, dropping to its all-time low of $0.172637 on December 19, 2025, reflecting broader market dynamics
ARB Current Market Status
As of January 14, 2026, ARB is trading at $0.2219, showing a recovery from its recent low point. The token has demonstrated short-term momentum with a 10.16% increase over the past 24 hours and a 0.18% gain in the last hour. The 24-hour trading range spans from $0.2012 to $0.2261, indicating moderate intraday volatility.
Over the past 30 days, ARB has gained 8.64%, suggesting gradual recovery momentum. However, the one-year performance shows a decline of 68.38% from previous levels, reflecting the challenging market conditions throughout 2025.
ARB currently holds a market capitalization of approximately $1.27 billion with a circulating supply of 5.72 billion tokens out of a maximum supply of 10 billion tokens, representing 57.19% of the total supply. The fully diluted market cap stands at $2.22 billion. The token ranks 74th by market capitalization with a market dominance of 0.065%.
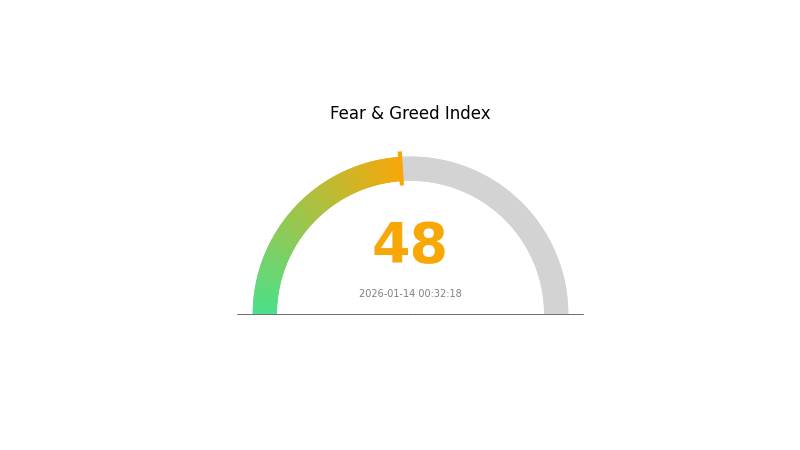
The Gate.com Fear & Greed Index registers at 48, indicating a neutral market sentiment. ARB is listed on 63 exchanges and has approximately 17,428 token holders. The 24-hour trading volume reaches $1.69 million, demonstrating active market participation.
Click to view current ARB market price
ARB Market Sentiment Indicator
2026-01-14 Fear and Greed Index: 48 (Neutral)
Click to view the current Fear & Greed Index
The current fear and greed index stands at 48, indicating a neutral market sentiment. This reading suggests that market participants are maintaining a balanced perspective, with neither excessive fear nor unbridled greed dominating investor behavior. At this equilibrium point, both bullish and bearish signals carry equal weight. Such neutral conditions typically present opportunities for measured portfolio adjustments and strategic positioning. Traders should remain cautious while staying alert to potential market shifts that could trigger sentiment changes.
ARB Holding Distribution
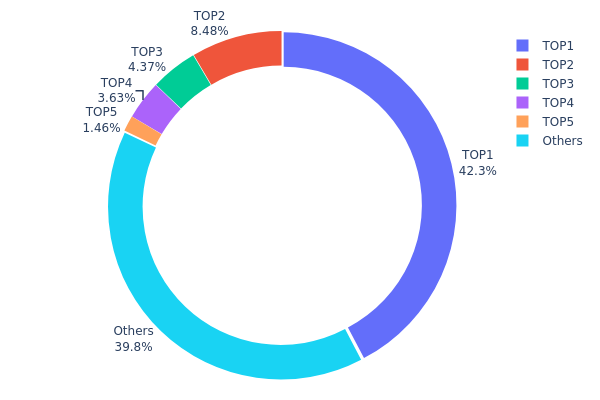
The holding distribution chart illustrates how ARB tokens are allocated across different wallet addresses, providing crucial insights into the token's decentralization level and potential market manipulation risks. This metric serves as a key indicator of whether token supply is concentrated among a few major holders or distributed more evenly across the community.
According to the current data, ARB exhibits a relatively concentrated holding pattern. The top address controls 89,374.30K tokens, accounting for 42.30% of the total supply, representing a significant concentration that warrants attention. The top five addresses collectively hold 127,288.48K tokens, comprising approximately 60.22% of the total supply. This level of concentration indicates that the majority of ARB tokens are controlled by a limited number of entities, which could potentially impact market stability.
Such a concentrated holding structure presents both opportunities and risks for the ARB ecosystem. On one hand, major holders may have strong incentives to support long-term project development and maintain price stability. On the other hand, this concentration exposes the market to heightened volatility risks, as large-scale sell-offs by top holders could trigger significant price fluctuations. The remaining 39.78% of tokens distributed among other addresses suggests some degree of community participation, but the dominant influence of major holders remains evident. Investors should carefully monitor any significant changes in the holding patterns of top addresses, as these movements could serve as early indicators of market sentiment shifts.
Click to view the current ARB Holding Distribution
| Top |
Address |
Holding Qty |
Holding (%) |
| 1 |
0x611f...dfb09d |
89374.30K |
42.30% |
| 2 |
0xb0a2...113d64 |
17912.45K |
8.47% |
| 3 |
0x91d4...c8debe |
9242.81K |
4.37% |
| 4 |
0x0529...c553b7 |
7677.62K |
3.63% |
| 5 |
0x92ea...e3d4ea |
3081.30K |
1.45% |
| - |
Others |
83981.26K |
39.78% |
II. Core Factors Influencing ARB's Future Price
Supply Mechanism
- Token Unlock Events: Large-scale token unlock events have historically impacted ARB price movements. Previous unlocks of approximately 2.69 billion tokens led to noticeable price pressure in the market.
- Historical Pattern: Token unlock events have consistently resulted in selling pressure, contributing to price volatility and downward movements during unlock periods.
- Current Impact: Limited token supply with increasing demand dynamics may support price appreciation, though investors should remain mindful of scheduled unlock events and their potential impact on market liquidity.
Institutional and Major Holder Dynamics
- Institutional Adoption: Growing institutional adoption of Layer 2 solutions continues to influence ARB's market positioning. Major blockchain projects and ecosystem partners have integrated Arbitrum technology into their infrastructure.
- Ecosystem Partnerships: Arbitrum has secured partnerships across multiple sectors including DeFi protocols, NFT platforms, and developer communities, strengthening its institutional foundation.
- Governance Structure: Significant decision-making power resides within the community, including authority over network upgrades, incentive programs, developer grants, and ecosystem direction.
Macroeconomic Environment
- Monetary Policy Impact: Broader macroeconomic trends including inflation dynamics and interest rate movements influence cryptocurrency market sentiment and capital allocation decisions affecting ARB valuation.
- Market Sentiment Dynamics: Investor confidence driven by news cycles, social media trends, and overall market psychology plays a substantial role in ARB price movements. Optimistic sentiment can fuel bullish forecasts, while negative news may trigger bearish outlooks.
- Regulatory Developments: Evolving regulatory frameworks and government policies regarding cryptocurrency adoption continue to shape market conditions and institutional participation levels.
Technical Development and Ecosystem Building
- Optimized Consensus Mechanism: Arbitrum utilizes advanced consensus mechanisms and sharding technology to process higher transaction volumes than Ethereum while maintaining substantially lower transaction fees, with average gas costs representing only 1.56% of Ethereum mainnet fees.
- Security Infrastructure: Built upon Ethereum's security framework, Arbitrum leverages mainnet security guarantees while providing enhanced scalability, offering users confidence in network reliability and asset protection.
- Ecosystem Applications: ARB token serves multiple utility functions including transaction fee payments, governance voting participation, and accessing various ecosystem benefits. DApp developers utilize ARB for incentive mechanisms, early access programs, and community engagement initiatives.
- Layer 2 Competitive Landscape: Market positioning relative to competing Layer 2 solutions influences adoption rates and ecosystem growth. Factors including transaction volume, active user metrics, total value locked (TVL), and developer activity contribute to competitive dynamics.
- Network Effects: User base scale and diversity directly impact cooperation efficiency within the Layer 2 network. Each new user joining and remaining active on the network increases its potential value to other participants, creating positive feedback loops that strengthen ecosystem development.
III. 2026-2031 ARB Price Forecast
2026 Outlook
- Conservative forecast: $0.13296 - $0.2216
- Neutral forecast: $0.2216
- Optimistic forecast: $0.277 (requires favorable market conditions and ecosystem expansion)
2027-2029 Outlook
- Market stage expectation: Recovery and growth phase with potential for increased adoption of Layer 2 solutions
- Price range forecast:
- 2027: $0.17202 - $0.34902 (approximately 12% increase)
- 2028: $0.28719 - $0.35301 (approximately 34% increase)
- 2029: $0.18913 - $0.42717 (approximately 46% increase)
- Key catalysts: Expansion of Arbitrum ecosystem, increased DeFi integration, and broader Layer 2 adoption across the cryptocurrency market
2030-2031 Long-term Outlook
- Baseline scenario: $0.22221 - $0.48585 (assuming steady ecosystem development and moderate market conditions)
- Optimistic scenario: $0.37663 - $0.58217 (assuming accelerated adoption and favorable regulatory environment)
- Transformative scenario: Potential to reach upper ranges of $0.58217+ (under conditions of mainstream Layer 2 adoption and significant network growth)
- 2026-01-14: ARB trading within the projected range as the ecosystem continues to develop
| Year |
Predicted High Price |
Predicted Average Price |
Predicted Low Price |
Price Change |
| 2026 |
0.277 |
0.2216 |
0.13296 |
0 |
| 2027 |
0.34902 |
0.2493 |
0.17202 |
12 |
| 2028 |
0.35301 |
0.29916 |
0.28719 |
34 |
| 2029 |
0.42717 |
0.32608 |
0.18913 |
46 |
| 2030 |
0.48585 |
0.37663 |
0.22221 |
69 |
| 2031 |
0.58217 |
0.43124 |
0.23718 |
94 |
IV. ARB Professional Investment Strategies and Risk Management
ARB Investment Methodology
(1) Long-term Holding Strategy
- Suitable for: Investors who believe in Ethereum scaling solutions and Layer 2 ecosystem growth, with a medium to long-term investment horizon
- Operational Recommendations:
- Consider accumulating ARB positions during market corrections when the price approaches support levels
- Monitor the development of Arbitrum ecosystem and TVL (Total Value Locked) growth as indicators of fundamental strength
- Recommended storage solution: Gate Web3 Wallet offers secure multi-chain support for storing ARB tokens with user-controlled private keys
(2) Active Trading Strategy
- Technical Analysis Tools:
- Moving Averages: Use 50-day and 200-day moving averages to identify trend directions and potential entry/exit points
- Relative Strength Index (RSI): Monitor overbought (above 70) and oversold (below 30) conditions to time trades
- Swing Trading Considerations:
- ARB has shown 24-hour volatility with a range between $0.2012 and $0.2261, providing opportunities for short-term trades
- Set stop-loss orders at 5-8% below entry points to manage downside risk
ARB Risk Management Framework
(1) Asset Allocation Principles
- Conservative investors: 2-5% of crypto portfolio allocation
- Aggressive investors: 10-15% of crypto portfolio allocation
- Professional investors: Up to 20% allocation with active hedging strategies
(2) Risk Hedging Solutions
- Portfolio diversification: Balance ARB holdings with other Layer 2 solutions and established cryptocurrencies
- Position sizing: Never allocate more than you can afford to lose, considering ARB's historical price decline of 68.38% over the past year
(3) Secure Storage Solutions
- Hot wallet recommendation: Gate Web3 Wallet provides convenient access for active traders with built-in security features
- Cold storage approach: For large holdings, consider hardware wallet solutions with offline private key storage
- Security considerations: Enable two-factor authentication, never share private keys, and verify contract addresses (ETH: 0xb50721bcf8d664c30412cfbc6cf7a15145234ad1, ARBEVM: 0x912CE59144191C1204E64559FE8253a0e49E6548) before transactions
V. ARB Potential Risks and Challenges
ARB Market Risks
- Price volatility: ARB has experienced significant price fluctuations, with a current price of $0.2219 representing a 90.7% decline from its all-time high of $2.39 reached on January 12, 2024
- Competition intensity: The Layer 2 scaling solution market is becoming increasingly competitive, potentially affecting Arbitrum's market share and token value
- Liquidity concerns: While ARB has a 24-hour trading volume of approximately $1.69 million, market depth may vary across different trading platforms
ARB Regulatory Risks
- Policy uncertainty: Changes in cryptocurrency regulations across different jurisdictions could impact ARB trading and usage
- Compliance requirements: Evolving regulatory frameworks may require additional compliance measures from Arbitrum ecosystem participants
- Cross-border restrictions: Potential limitations on cryptocurrency transactions in certain regions could affect ARB accessibility
ARB Technical Risks
- Smart contract vulnerabilities: While Arbitrum inherits Ethereum-level security, potential bugs or exploits in smart contracts could impact the ecosystem
- Network dependency: As an Ethereum Layer 2 solution, ARB's functionality is dependent on the underlying Ethereum network's stability and security
- Scalability challenges: Future technical limitations or competing technologies could impact Arbitrum's competitive position
VI. Conclusion and Action Recommendations
ARB Investment Value Assessment
Arbitrum (ARB) represents a significant player in the Ethereum Layer 2 scaling ecosystem, offering faster and cheaper transactions compared to the Ethereum mainnet. With a circulating supply of 5.72 billion tokens out of a maximum supply of 10 billion (57.19% circulation ratio), the token has substantial room for future distribution. The current market capitalization stands at approximately $1.27 billion, ranking 74th globally with a market dominance of 0.065%. While the technology demonstrates long-term potential in addressing Ethereum's scalability challenges, investors should note the significant price decline from historical highs and the competitive nature of the Layer 2 market. The token's listing on 63 exchanges and support from 17,428 holders indicates established market presence, though price performance has been challenging with a 68.38% decline over the past year.
ARB Investment Recommendations
✅ Beginners: Start with small position sizes (1-3% of portfolio) and focus on understanding Arbitrum's technology and ecosystem before increasing exposure. Use Gate.com's spot trading platform for straightforward buy-and-hold strategies.
✅ Experienced investors: Consider dollar-cost averaging (DCA) strategies to build positions during market downturns, while maintaining disciplined risk management with stop-loss orders. Monitor on-chain metrics and ecosystem development for informed decision-making.
✅ Institutional investors: Evaluate ARB as part of a diversified Layer 2 exposure strategy, considering both fundamental analysis of ecosystem growth and technical market structure. Implement structured position sizing with appropriate hedging instruments.
ARB Trading Participation Methods
- Spot trading: Direct purchase and holding of ARB tokens through Gate.com, suitable for long-term investment strategies
- Active trading: Utilize technical analysis and market timing strategies to capitalize on price volatility through Gate.com's trading platform
- Portfolio integration: Include ARB as part of a broader cryptocurrency portfolio focused on Ethereum ecosystem and Layer 2 scaling solutions
Cryptocurrency investment carries extremely high risks, and this article does not constitute investment advice. Investors should make prudent decisions based on their own risk tolerance and are advised to consult professional financial advisors. Never invest more than you can afford to lose.
FAQ
What is the ARB token price prediction for 2024-2025?
Based on market analysis, ARB token is predicted to trade between $9.24 to $12.48 in 2025. These price projections reflect technical analysis and market trends, though actual prices may vary based on market conditions.
What are the main factors affecting ARB price?
ARB price is influenced by governance decisions and community voting outcomes, monthly token unlocks worth $120 million before 2026, network adoption and transaction volume, market sentiment, and broader cryptocurrency trends. Early investor and team holdings concentration also impacts price movements.
How does ARB's price outlook compare to other Layer 2 tokens like OP and MATIC?
ARB demonstrates strong market fundamentals with a fully diluted market cap exceeding both OP and MATIC. As the leading Layer 2 solution by adoption and ecosystem growth, ARB is positioned for sustained price appreciation driven by increased user adoption and ecosystem expansion.
How does Arbitrum ecosystem development impact ARB price?
Strong Arbitrum ecosystem growth drives ARB price appreciation through increased network activity, developer adoption, and transaction volume. Conversely, ecosystem decline exerts downward pressure on ARB price.
What are the historical price trends and key support/resistance levels for ARB?
ARB exhibits a bearish trend with key support at 0.1824 and resistance at 0.1863. Price consolidation near recent lows suggests potential reversal attempts if support breaks, indicating dynamic trading levels for investors.
What is the analyst's target price prediction for ARB?
According to analysts, the ARB target price is 41.34 AUD, with a high estimate of 47.50 AUD and a low estimate of 35.00 AUD for 2027.
What risks and uncertainties exist in ARB price predictions?
ARB price predictions face market volatility, technology development uncertainty, and adoption rate fluctuations. Competitive dynamics and regulatory changes also impact long-term forecasts. Market demand shifts and ecosystem innovation are key determining factors.
* The information is not intended to be and does not constitute financial advice or any other recommendation of any sort offered or endorsed by Gate.