# 2025 BOT Price Prediction: Expert Analysis and Future Outlook for Bot Token Growth
Hyperbot (BOT) is an AI-powered on-chain trading terminal enabling whale tracking, market signal detection, and intelligent copy trading across multiple blockchains. This comprehensive guide delivers professional BOT price forecasts through 2030, integrating historical trends, ecosystem dynamics, and macroeconomic factors. It addresses critical investor needs: understanding BOT's market positioning, evaluating price trajectories, implementing risk management strategies, and accessing secure trading solutions via Gate. Designed for beginners, experienced traders, and institutional investors, this analysis examines technology development, market adoption drivers, regulatory landscapes, and security considerations. By combining technical analysis with strategic investment methodologies and risk hedging frameworks, readers gain actionable insights for navigating BOT's volatile yet potentially rewarding investment landscape in th
Introduction: BOT's Market Position and Investment Value
Hyperbot (BOT) is an AI-powered on-chain contract trading terminal that aggregates data and execution across multiple blockchain networks, enabling users to track smart money and whales, detect market signals, and perform intelligent copy trading with greater speed and precision. Since its launch in January 2025, the project has established itself as an innovative solution in the on-chain trading ecosystem. As of December 2025, BOT has achieved a market capitalization of approximately $926,376, with a circulating supply of 319,000,010 tokens and a current price hovering around $0.002904. This emerging asset, recognized for its "AI-driven whale tracking and copy trading capabilities," is playing an increasingly important role in intelligent on-chain trading opportunities.
This article will provide a comprehensive analysis of BOT's price trends from 2025 through 2030, integrating historical patterns, market supply and demand dynamics, ecosystem development, and macroeconomic factors to deliver professional price forecasts and practical investment strategies for investors seeking exposure to this innovative trading terminal.
I. BOT Price History Review and Market Status
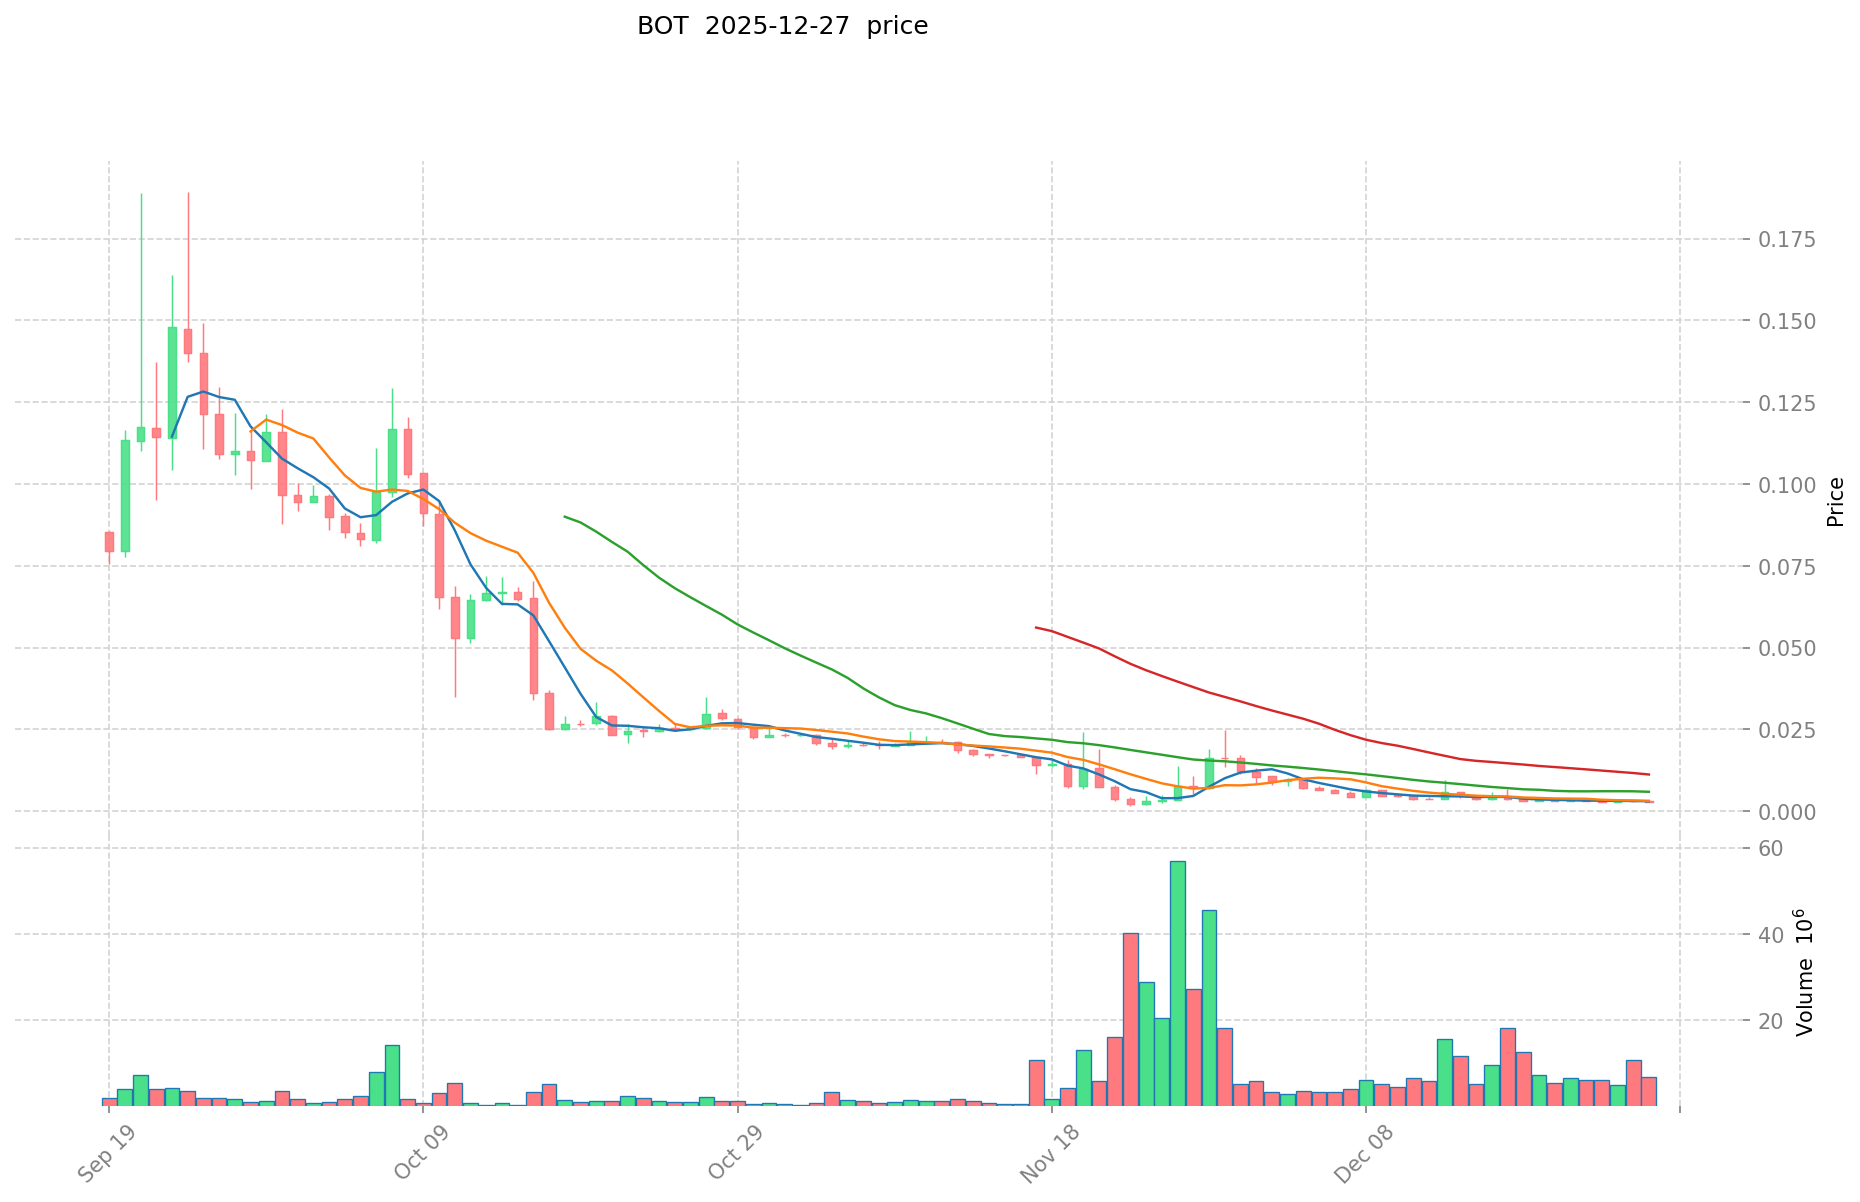
BOT Historical Price Movement Trajectory
All-Time High (ATH): On September 24, 2025, BOT reached its peak price of $0.18925, representing the maximum valuation point in the token's trading history.
All-Time Low (ATL): On November 23, 2025, BOT dropped to its lowest recorded price of $0.001714, marking a significant correction from the ATH.
Price Decline from Peak: Since reaching its all-time high, BOT has experienced a substantial drawdown of approximately 92.27% over the one-year period, reflecting considerable volatility and market pressure.
BOT Current Market Status
As of December 27, 2025, BOT is trading at $0.002904, with a 24-hour trading volume of approximately $16,813.86. The token exhibits the following characteristics:
Market Capitalization and Supply Metrics:
- Market Cap: $926,376.03
- Fully Diluted Valuation (FDV): $2,904,000
- Circulating Supply: 319,000,010 BOT (representing 31.9% of total supply)
- Total Supply: 1,000,000,000 BOT
- Market Dominance: 0.000091%
Recent Price Performance:
- 1-Hour Change: +0.27%
- 24-Hour Change: -1.32%
- 7-Day Change: -8.79%
- 30-Day Change: -57.35%
- 24-Hour Price Range: $0.002885 (low) to $0.003056 (high)
Network Activity:
- Total Holders: 7,366
- Supported Exchanges: 7 platforms
- Blockchain: BEP20 (Binance Smart Chain)
Click to view current BOT market price
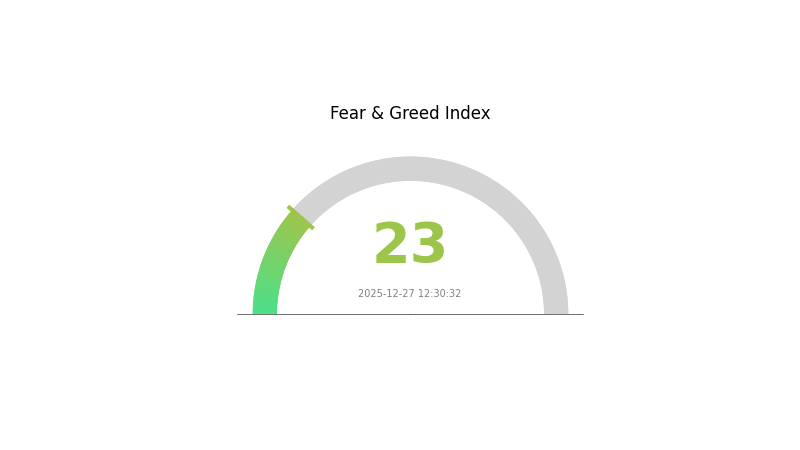
BOT Market Sentiment Indicator
2025-12-27 Fear and Greed Index: 23 (Extreme Fear)
Click to view current Fear & Greed Index
The crypto market is experiencing extreme fear, with the Fear and Greed Index plummeting to 23. This historically low reading signals intense market pessimism and heightened risk aversion among investors. During such periods, market volatility typically increases as panic selling dominates trading activity. Experienced traders often view extreme fear as a potential contrarian signal, presenting opportunities for long-term investors with strong conviction. However, caution remains essential as further downside pressure cannot be ruled out. Monitor key support levels and consider portfolio rebalancing based on your risk tolerance.
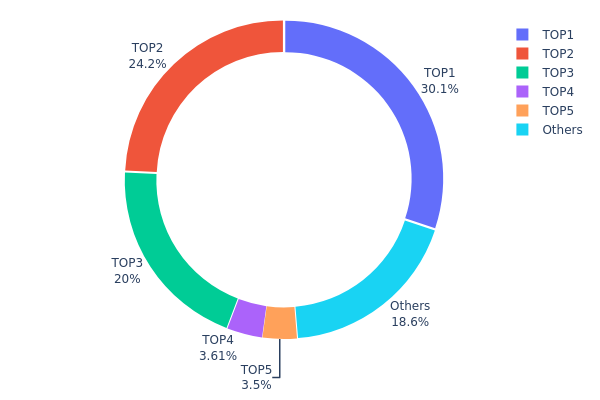
BOT Holding Distribution
The address holding distribution chart illustrates the concentration of token ownership across blockchain addresses, revealing how BOT tokens are distributed among top holders and the broader market. This metric serves as a critical indicator of token decentralization, liquidity dynamics, and potential market concentration risks. By analyzing the top addresses and their respective holdings, we can assess the overall health of the token ecosystem and identify structural vulnerabilities or strengths in the on-chain landscape.
The current distribution of BOT tokens exhibits pronounced concentration among the top three addresses, which collectively control 74.30% of the total supply. The largest holder (0xdb13...5422ba) maintains a dominant position with 30.09%, followed by substantial holdings at 24.21% and 20.00% respectively. This concentration pattern raises considerations regarding potential market influence, as a relatively small number of addresses possess the capacity to significantly impact token pricing and liquidity dynamics. The fourth and fifth largest holders contribute an additional 7.10% to the concentration, while the remaining ecosystem participants account for 18.60% of the supply. Such distribution characteristics suggest a market structure where meaningful price movements could be initiated by coordinated actions from top-tier holders, potentially affecting market stability and retail participant exposure.
The existing holding configuration reflects a moderately concentrated ownership structure that warrants ongoing monitoring. While decentralization remains an important consideration, the current state indicates that the BOT ecosystem maintains a balance between institutional or major stakeholder influence and broader community participation. The 18.60% allocation among dispersed addresses demonstrates meaningful retail engagement; however, the cumulative 74.30% concentration among the top three addresses indicates that market dynamics remain substantially influenced by a limited number of significant stakeholders. This structural characteristic is typical of emerging or established tokens and suggests that future distribution shifts, particularly through exchange listing activities on platforms like Gate.com or increased community participation, could meaningfully alter the decentralization profile.
Click to view the current BOT Holding Distribution
| Top |
Address |
Holding Qty |
Holding (%) |
| 1 |
0xdb13...5422ba |
300999.99K |
30.09% |
| 2 |
0x73d8...4946db |
242115.72K |
24.21% |
| 3 |
0xf6b5...12af16 |
200000.00K |
20.00% |
| 4 |
0xb39c...0553c1 |
36092.20K |
3.60% |
| 5 |
0x7be8...3d1060 |
35000.00K |
3.50% |
| - |
Others |
185792.09K |
18.6% |
Core Factors Influencing Future Price Trends of BOT
II. Core Factors Affecting BOT's Future Price
Technology Development and Ecosystem Building
-
Artificial Intelligence and Machine Learning Integration: The crypto trading bot market is experiencing rapid growth driven by AI and ML technologies. These emerging technologies enable bots to learn from historical data and generate more accurate predictions while reading market movement patterns. This technological advancement enhances decision-making capabilities and improves the overall trading strategy execution. With continuous algorithmic improvements, the automation efficiency of trading bots is expected to increase significantly.
-
DeFi Platform Integration: Specialized bots are being designed to interact with DeFi protocols for yield farming and liquidity mining. This ecosystem expansion opens new revenue streams and use cases for trading bot tokens, particularly as DeFi adoption continues to grow globally.
-
Personalization and Customization: The market is trending toward individualized trading strategies tailored to specific risk tolerances and investment objectives. This innovation expands trader adoption rates and creates higher switching costs, which can positively impact token valuations.
Market Growth and Adoption
The cryptocurrency trading bot market was valued at approximately USD 41.61 billion in 2024 and is projected to reach USD 154 billion by 2033, representing a compound annual growth rate (CAGR) of approximately 14% from 2025 to 2033. This growth trajectory reflects increasing demand for automated trading solutions among both retail and institutional investors seeking 24/7 trading capabilities without manual intervention. The adoption of trading bots is accelerating due to their ability to capture real-time market opportunities in the highly volatile and fast-moving crypto market environment.
Market Demand Drivers
The fundamental driver for BOT token price appreciation is the surging demand for trading automation. Both retail and institutional investors are actively seeking tools that enable continuous trading operations. The high volatility levels in cryptocurrency markets represent substantial profit opportunities in the short term, making trading bots an attractive tool for traders who want to navigate the market's unpredictable nature. Bots programmed to respond within seconds to changing market conditions can execute trades at optimal price points, creating measurable ROI advantages for users.
Security and Risk Management Concerns
Security remains one of the most critical challenges facing the crypto trading bot market today. Many investors remain cautious about potential bot malfunctions, hacking, or unauthorized account access. Concerns about the safety and integrity of trading algorithms and investor data may limit market growth. Solutions that address these security challenges and provide robust data protection mechanisms would strengthen investor confidence and potentially drive BOT token value upward.
Regulatory Environment
Regulatory uncertainty represents the most significant challenge for the trading bot industry. The lack of clear regulations regarding cryptocurrency trading and automation may create obstacles for market participants. Future regulatory frameworks could either restrict or facilitate bot operations, directly impacting market growth trajectories and token performance. Jurisdictions with favorable regulatory clarity, such as the United States and Japan, are experiencing higher adoption rates and market activity.
III. 2025-2030 BOT Price Forecast
2025 Outlook
- Conservative Forecast: $0.00244 - $0.00291
- Neutral Forecast: $0.00291
- Optimistic Forecast: $0.00369 (requires sustained market interest and positive ecosystem developments)
2026-2028 Mid-term Outlook
- Market Stage Expectation: Consolidation phase with gradual recovery, followed by moderate appreciation driven by increasing adoption and utility recognition.
- Price Range Forecast:
- 2026: $0.00297 - $0.0034
- 2027: $0.00211 - $0.00472
- 2028: $0.00319 - $0.00553
- Key Catalysts: Enhanced tokenomics implementation, expansion of use cases, growth in trading volume on major platforms such as Gate.com, and strengthened community engagement.
2029-2030 Long-term Outlook
- Base Case: $0.0043 - $0.00536 (assumes steady ecosystem development and moderate market growth)
- Optimistic Case: $0.00536 - $0.00674 (requires accelerated adoption, successful protocol upgrades, and favorable macroeconomic conditions)
- Transformational Case: $0.00674+ (assumes breakthrough partnerships, significant increase in on-chain activity, and broader cryptocurrency market expansion)
- 2025-12-27: BOT trading at dynamic market levels with consolidation patterns observed across major exchanges including Gate.com.
| 年份 |
预测最高价 |
预测平均价格 |
预测最低价 |
涨跌幅 |
| 2025 |
0.00369 |
0.00291 |
0.00244 |
0 |
| 2026 |
0.0034 |
0.0033 |
0.00297 |
13 |
| 2027 |
0.00472 |
0.00335 |
0.00211 |
15 |
| 2028 |
0.00553 |
0.00404 |
0.00319 |
38 |
| 2029 |
0.00536 |
0.00478 |
0.0043 |
64 |
| 2030 |
0.00674 |
0.00507 |
0.0039 |
74 |
Hyperbot (BOT) Professional Investment Strategy and Risk Management Report
IV. BOT Professional Investment Strategy and Risk Management
BOT Investment Methodology
(1) Long-term Holding Strategy
(2) Active Trading Strategy
BOT Risk Management Framework
(1) Asset Allocation Principles
- Conservative Investors: 0.5%-1.5% of total portfolio allocation to BOT, treating it as a high-risk speculative position.
- Active Investors: 2%-5% allocation, used as a tactical position for capturing short-term market inefficiencies.
- Professional Investors: 5%-10% allocation as part of a diversified Web3 infrastructure and AI-trading technology thesis.
(2) Risk Hedging Solutions
- Stablecoin pairs: Maintain a 1:1 ratio of BOT holdings to USDT or USDC positions to lock in gains during price rallies and provide dry powder for opportunistic buying during downturns.
- Portfolio diversification: Allocate excess capital to established blockchain infrastructure projects to reduce concentration risk in early-stage AI trading terminals.
(3) Secure Storage Solutions
- Web3 Wallet Recommendation: Gate Web3 wallet provides non-custodial storage with BSC network support, enabling direct interaction with Hyperbot platform while maintaining full asset control.
- Cold Storage Option: For positions exceeding $10,000 USD equivalent, consider hardware wallet solutions stored in secure physical locations.
- Security Precautions: Never share private keys or seed phrases; enable multi-signature authentication where available; regularly verify contract addresses on BscScan before transactions.
V. BOT Potential Risks and Challenges
BOT Market Risks
- Extreme Volatility: BOT has declined 92.27% over one year and 57.35% in the past 30 days, indicating severe price instability that can result in rapid capital erosion for poorly-timed entries.
- Low Trading Liquidity: With 24-hour volume of only $16,813.86 and market capitalization of $926,376.03, BOT faces significant liquidity constraints that can amplify price movements and create slippage on substantial trades.
- Limited Market Capitalization: Current market cap of $926,376.03 and dominance of 0.000091% indicate minimal market acceptance, reducing institutional adoption prospects and increasing abandonment risk.
BOT Regulatory Risks
- Evolving AI Compliance: As AI-powered trading terminals face increasing regulatory scrutiny globally, jurisdictions may implement restrictions on algorithmic trading or copy-trading functionality that could limit Hyperbot's operational scope.
- Securities Classification: Regulatory bodies may classify BOT token or Hyperbot's trading services as securities or derivatives, requiring additional licensing and compliance measures that could impede expansion.
- Cross-Border Trading Restrictions: Different regions maintain varying rules for trading platform operations; Hyperbot may face localization requirements or geographic limitations affecting addressable market size.
BOT Technical Risks
- Smart Contract Vulnerabilities: As a blockchain-based platform, Hyperbot faces inherent risks from unaudited or recently-audited smart contracts that could be exploited for fund theft or operational failures.
- Platform Dependency: Hyperbot's reliance on multi-chain DEX data and execution creates single points of failure if integrations malfunction or if underlying DEXs experience outages.
- Whale Tracking Accuracy: The core value proposition depends on accurate AI analysis of on-chain whale behavior; algorithmic errors could lead to false signals that undermine user trust and platform credibility.
VI. Conclusion and Action Recommendations
BOT Investment Value Assessment
Hyperbot represents a speculative play on the convergence of AI technology and blockchain trading infrastructure. The platform's AI-driven whale tracking and copy-trading capabilities address a genuine market need for retail traders to identify and follow institutional capital flows. However, the token's severe price deterioration (-92.27% YoY), minimal market capitalization ($926K), and extremely low trading volume indicate significant product-market fit challenges and investor skepticism as of December 2025. The project's long-term viability depends on successful user acquisition, sustained platform engagement, and broader adoption of AI-powered trading terminals across the crypto ecosystem. Current valuation metrics suggest the market has priced in substantial execution risk.
BOT Investment Recommendations
✅ Beginners: Allocate only 0.25%-0.5% of speculative capital if interested in AI trading infrastructure exposure; prioritize understanding Hyperbot's technical capabilities and competitive differentiation before entry; use Gate.com for secure trading and storage via Gate Web3 wallet.
✅ Experienced Investors: Consider 1%-3% tactical allocation during oversold conditions when on-chain metrics show whale accumulation; implement strict stop-losses at 25%-30% below entry points; actively monitor technical indicators and social sentiment for reversal signals.
✅ Institutional Investors: Evaluate BOT as a thematic bet on AI-powered DeFi infrastructure with potential exposure through derivative positions rather than direct token holdings; conduct comprehensive due diligence on Hyperbot's product roadmap, team credentials, and regulatory compliance framework before commitment.
BOT Trading Participation Methods
- Spot Trading: Purchase BOT directly on Gate.com through the BNB/BOT or USDT/BOT trading pairs; execute limit orders to optimize entry prices given low liquidity conditions.
- Gate Web3 Wallet Integration: Transfer purchased BOT to Gate Web3 wallet for non-custodial storage and direct Hyperbot platform interaction, eliminating exchange counterparty risk.
- DCA Strategy: Implement automated recurring purchases via Gate.com over 3-6 month periods to accumulate positions while averaging purchase costs across market cycles.
Cryptocurrency investment carries extreme risk. This report is not investment advice. Investors must make decisions based on personal risk tolerance and should consult professional financial advisors. Never invest funds you cannot afford to lose completely.
FAQ
What is the price prediction for bot crypto in 2030?
Based on current market analysis, BOT crypto is predicted to range between $0.00006457 and $0.00001299 by 2030. These forecasts reflect potential growth trajectories influenced by market adoption and technology developments.
How much is a bot coin worth?
As of December 27, 2025, a bot coin is worth approximately $87,549.61. The price fluctuates continuously based on market demand, trading volume, and overall crypto market conditions. For real-time pricing, refer to current market data.
What is BOT token and what is its use case?
BOT token is a utility token designed to power automated trading and bot services within the Web3 ecosystem. It enables users to access advanced trading automation, algorithmic strategies, and decentralized bot management features for optimized crypto market participation.
What factors could influence BOT token price in the future?
BOT token price is influenced by supply and demand dynamics, protocol updates, blockchain developments, trading volume, market sentiment, and macroeconomic conditions. Halving events and network upgrades also significantly impact its valuation trajectory.
What are the risks of investing in BOT cryptocurrency?
BOT cryptocurrency risks include API latency affecting trade execution, regulatory uncertainty in different jurisdictions, intense competition from institutional trading bots, and market volatility. Smart investors should carefully assess their risk tolerance before participating.
* The information is not intended to be and does not constitute financial advice or any other recommendation of any sort offered or endorsed by Gate.