This comprehensive guide analyzes ACE token's investment potential through 2031, examining Fusionist's position as a Web3 gaming platform. The article reviews ACE's dramatic price history—from $15.659 ATH to current $0.241—and evaluates market sentiment amid extreme fear conditions. Key sections include technical analysis of price trends, detailed 2026-2031 price forecasts ranging from $0.147 to $0.562 across scenarios, and professional investment strategies for conservative, experienced, and institutional investors. The guide addresses critical risk factors including price volatility, regulatory challenges, and smart contract vulnerabilities, while providing practical recommendations for trading on Gate and securing holdings via Web3 Wallet for optimal ecosystem participation.
Introduction: ACE's Market Position and Investment Value
Fusionist (ACE), positioned as an independent WEB3 gaming platform delivering AAA quality through Unity and HDRP technologies, has been developing since its launch in 2023. As of 2026, ACE holds a market capitalization of approximately 21 million USD, with a circulating supply of around 87 million tokens, and its price remains at approximately 0.241 USD. This asset, recognized as a gaming-integrated cryptocurrency, is playing an increasingly significant role in the Web3 gaming and blockchain entertainment sectors.
This article will comprehensively analyze ACE's price trends from 2026 to 2031, combining historical patterns, market supply and demand dynamics, ecosystem development, and macroeconomic conditions to provide investors with professional price forecasts and practical investment strategies.
I. ACE Price History Review and Market Status
ACE Historical Price Evolution Trajectory
- 2023: ACE reached its all-time high of $15.659 on December 22, marking a significant milestone in the token's early trading history.
- 2024-2025: The token entered a prolonged correction phase, experiencing substantial price decline as market conditions shifted.
- 2025: ACE recorded its all-time low of $0.1045 on October 10, representing a decline of over 99% from its historical peak.
ACE Current Market Status
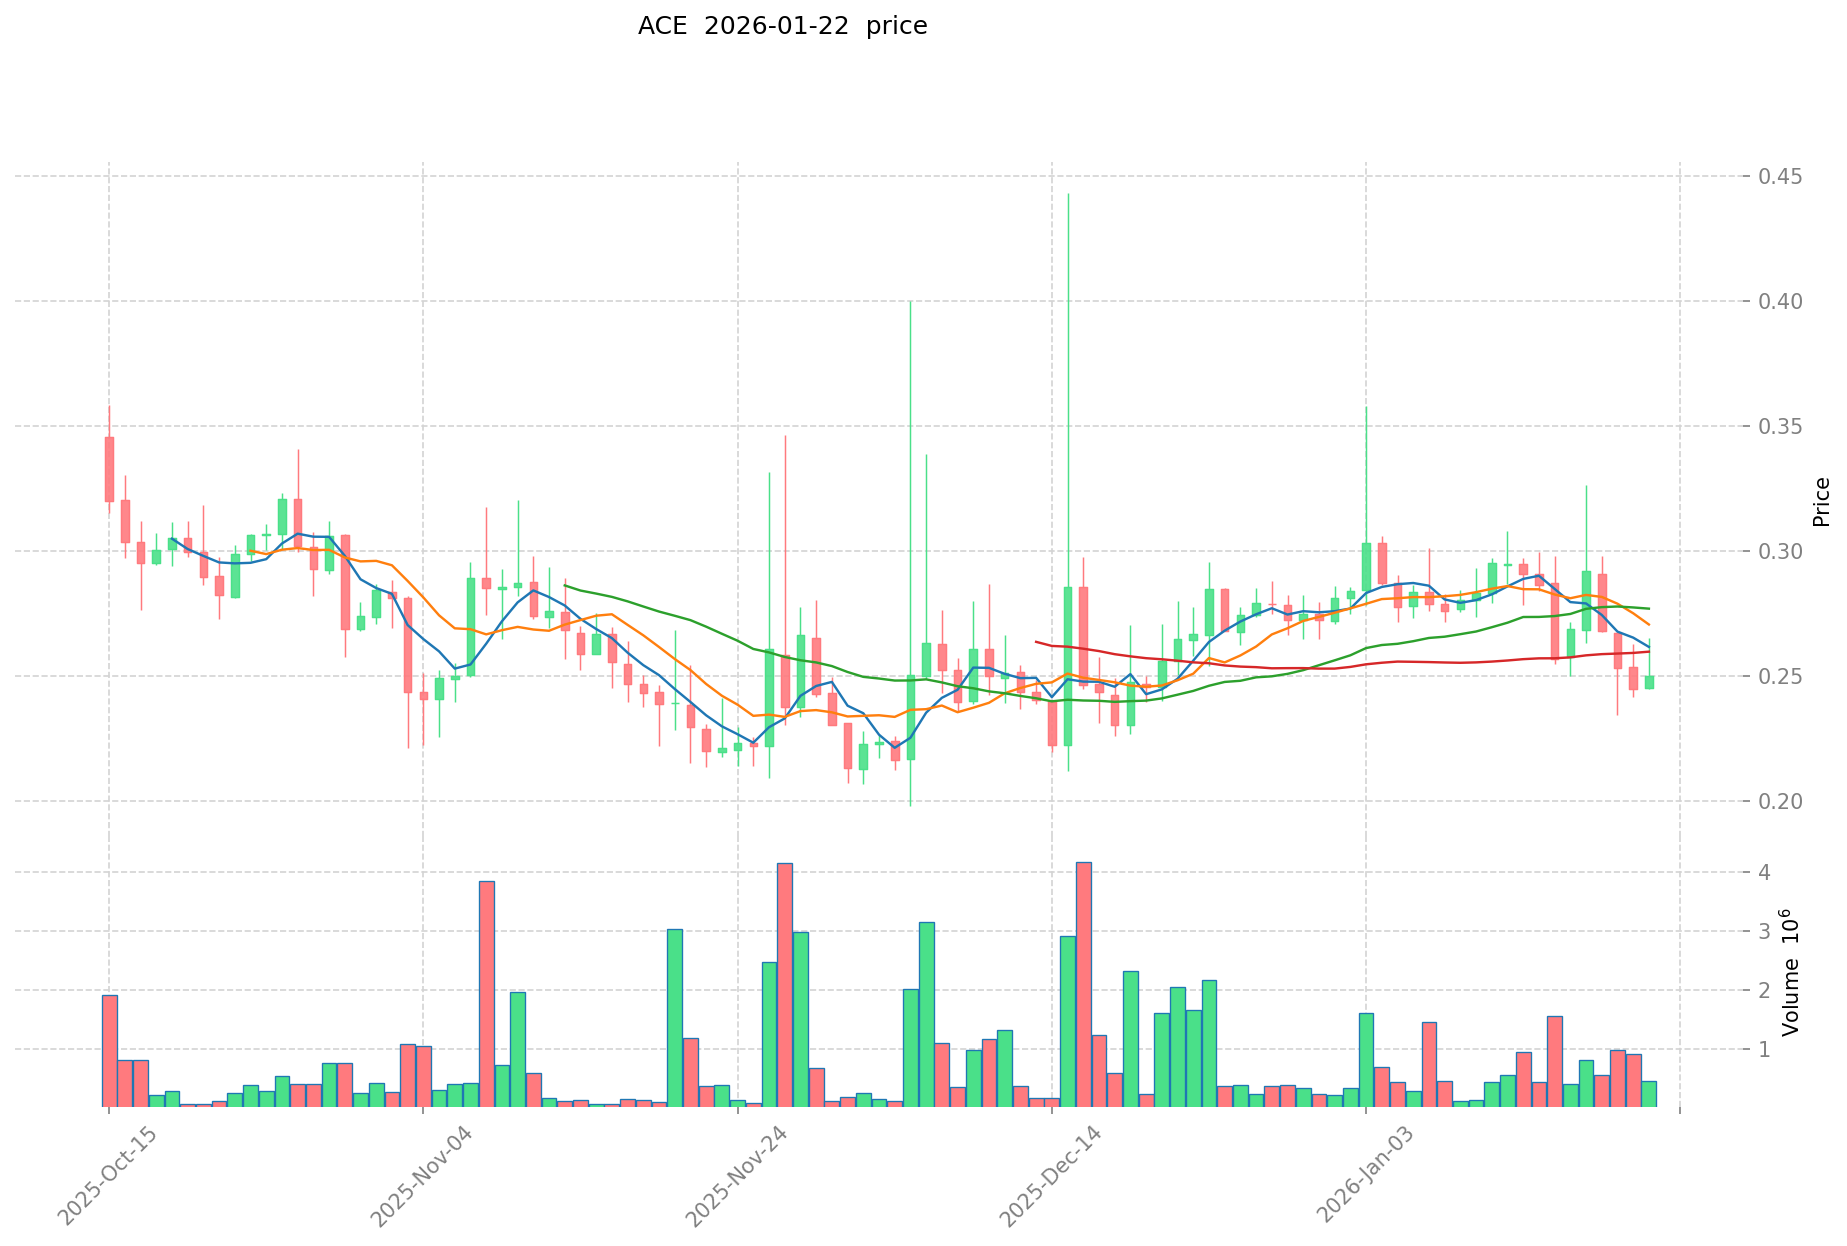
As of January 23, 2026, ACE is trading at $0.241, demonstrating mixed short-term momentum across different timeframes. The token has declined by 1.11% over the past hour and 5.08% in the last 24 hours, with the 24-hour trading range spanning between $0.24 and $0.2618. Over the past week, ACE has decreased by 6.43%, while the 30-day performance shows a 10.01% decline. The annual performance reflects an 85.55% decrease, indicating significant pressure throughout the past year.
The token's market capitalization stands at approximately $20.98 million, with a fully diluted valuation of $35.26 million. ACE has a circulating supply of 87,045,238 tokens out of a total supply of 146,307,870, representing a circulation ratio of 59.21%. The maximum supply is capped at 147 million tokens. The 24-hour trading volume reached $101,124.41, while ACE maintains a market dominance of 0.0011%.
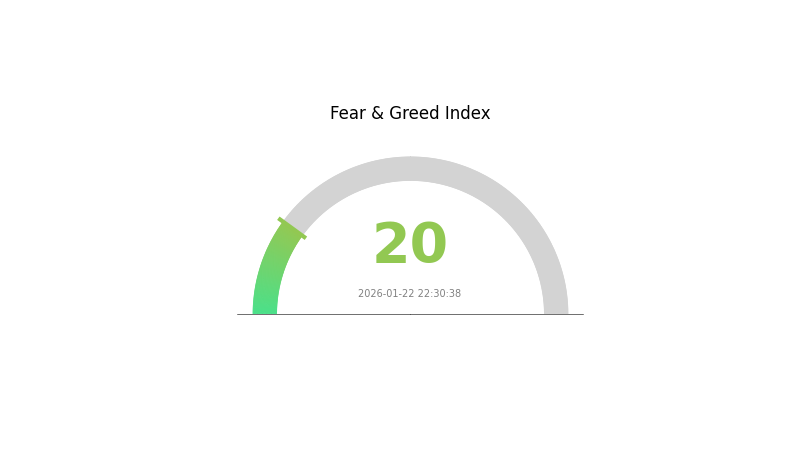
ACE is currently listed on 28 exchanges and has attracted 17,239 holders. The token's market-cap-to-FDV ratio stands at 59.21%, indicating moderate token distribution relative to total supply. The Crypto Fear & Greed Index registered 20 on January 22, 2026, signaling an "Extreme Fear" sentiment in the broader cryptocurrency market.
Click to view current ACE market price
ACE Market Sentiment Index
2026-01-22 Fear and Greed Index: 20 (Extreme Fear)
Click to view current Fear & Greed Index
The cryptocurrency market is currently experiencing extreme fear with an index reading of 20. This exceptionally low level indicates strong negative sentiment among investors, suggesting widespread concern about market conditions. When fear reaches such extreme levels, it often presents contrarian opportunities for experienced traders. Market volatility tends to be elevated during these periods. Investors should exercise caution while remaining alert to potential buying opportunities that may emerge as sentiment stabilizes.
ACE Holdings Distribution
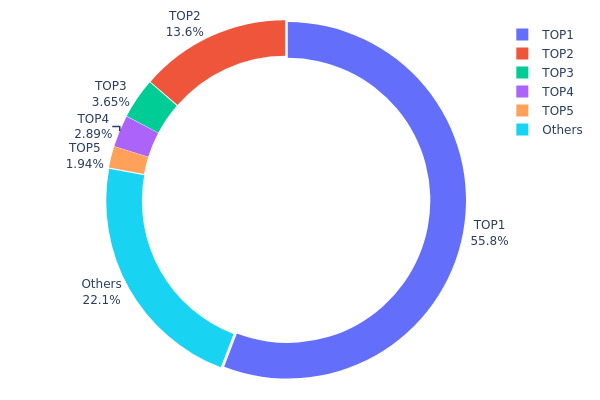
The holdings distribution chart illustrates the concentration of token supply across different wallet addresses, serving as a key metric to assess the degree of decentralization and potential market manipulation risks. Based on the current data, ACE exhibits a relatively high concentration pattern. The top address holds 13,831.62K tokens, accounting for 55.80% of the total supply, while the second-largest holder controls 3,381.37K tokens (13.64%). Combined, the top two addresses alone control 69.44% of the circulating supply, indicating significant centralization at the whale level. The top five addresses collectively hold 77.91% of tokens, leaving only 22.09% distributed among smaller holders and retail investors.
This high concentration structure presents several implications for market dynamics. The dominance of a single address holding over half the supply creates potential volatility risks, as large-scale sell-offs could trigger sharp price corrections and liquidity challenges. The limited distribution among retail participants may also constrain organic trading activity and price discovery mechanisms. From a market structure perspective, such concentration reduces the token's resilience against coordinated actions by major holders, potentially exposing the asset to heightened manipulation risks.
However, it's worth noting that the largest addresses may include protocol-controlled treasuries, staking contracts, or exchange cold wallets, which could represent locked or strategically reserved tokens rather than freely tradable supply. Further investigation into the nature of these addresses would provide more context regarding the actual circulating supply available for market trading and the genuine level of decentralization within the ACE ecosystem.
Click to view current ACE Holdings Distribution
| Top |
Address |
Holding Qty |
Holding (%) |
| 1 |
0xa399...14b71c |
13831.62K |
55.80% |
| 2 |
0x8894...e2d4e3 |
3381.37K |
13.64% |
| 3 |
0xe4cb...a43abb |
905.48K |
3.65% |
| 4 |
0x97b9...b68689 |
715.11K |
2.88% |
| 5 |
0x33ea...5d21fe |
481.03K |
1.94% |
| - |
Others |
5469.39K |
22.09% |
II. Core Factors Affecting ACE's Future Price
Based on the available information, there is insufficient data to provide a comprehensive analysis of the core factors affecting ACE's future price at this time. The fundamental elements including supply mechanisms, institutional dynamics, macroeconomic environment, and technical developments require specific data points that are not currently accessible in the provided materials.
For accurate price analysis and investment decisions regarding ACE, we recommend monitoring official announcements and conducting further research when more detailed information becomes available.
III. 2026-2031 ACE Price Prediction
2026 Outlook
- Conservative Prediction: $0.147 - $0.241
- Neutral Prediction: Around $0.241
- Optimistic Prediction: Up to $0.285 (requires favorable market conditions and increased adoption)
2027-2029 Outlook
- Market Stage Expectation: Gradual growth phase with increasing volatility and market maturation
- Price Range Predictions:
- 2027: $0.250 - $0.376
- 2028: $0.265 - $0.441
- 2029: $0.346 - $0.395
- Key Catalysts: Platform development progress, user base expansion, and broader cryptocurrency market sentiment
2030-2031 Long-term Outlook
- Baseline Scenario: $0.264 - $0.388 (assuming steady ecosystem development)
- Optimistic Scenario: $0.475 - $0.562 (contingent on significant platform upgrades and market share gains)
- Transformative Scenario: Potentially reaching $0.560+ (under exceptionally favorable conditions including mainstream adoption and technological breakthroughs)
- 2026-01-23: ACE trading within the projected range, showing potential for moderate growth trajectory
| Year |
Predicted High Price |
Predicted Average Price |
Predicted Low Price |
Price Change |
| 2026 |
0.28462 |
0.2412 |
0.14713 |
0 |
| 2027 |
0.37596 |
0.26291 |
0.24976 |
9 |
| 2028 |
0.44082 |
0.31943 |
0.26513 |
32 |
| 2029 |
0.39533 |
0.38013 |
0.34591 |
57 |
| 2030 |
0.56221 |
0.38773 |
0.26366 |
60 |
| 2031 |
0.56046 |
0.47497 |
0.24698 |
97 |
IV. ACE Professional Investment Strategies and Risk Management
ACE Investment Methodology
(1) Long-term Holding Strategy
- Suitable for: Long-term blockchain gaming enthusiasts and believers in Web3 gaming ecosystems
- Operational Recommendations:
- Consider accumulating positions during market downturns when ACE trades near historical support levels
- Monitor Fusionist's game development milestones and community engagement metrics as fundamental indicators
- Implement a secure storage solution to protect holdings from unauthorized access
(2) Active Trading Strategy
- Technical Analysis Tools:
- Moving Averages: Track 50-day and 200-day moving averages to identify potential trend reversals and momentum shifts
- Volume Analysis: Monitor 24-hour trading volume patterns to confirm price movements and identify potential breakout opportunities
- Swing Trading Key Points:
- Identify support levels around $0.24 and resistance near $0.26 based on recent price action
- Set stop-loss orders to manage downside risk, particularly given ACE's recent volatility
ACE Risk Management Framework
(1) Asset Allocation Principles
- Conservative Investors: 1-3% of crypto portfolio
- Aggressive Investors: 5-8% of crypto portfolio
- Professional Investors: 8-12% of crypto portfolio with active monitoring
(2) Risk Hedging Solutions
- Portfolio Diversification: Balance ACE holdings with established cryptocurrencies and other gaming tokens to reduce sector-specific risk
- Position Sizing: Use dollar-cost averaging to build positions gradually and reduce timing risk
(3) Secure Storage Solutions
- Hot Wallet Recommendation: Gate Web3 Wallet for convenient trading and interaction with Fusionist ecosystem
- Cold Storage Solution: Consider hardware wallet solutions for long-term holdings exceeding short-term trading needs
- Security Considerations: Enable two-factor authentication, verify contract addresses (0xc27A719105A987b4c34116223CAE8bd8F4B5def4 on BSC), and never share private keys or seed phrases
V. ACE Potential Risks and Challenges
ACE Market Risks
- Price Volatility: ACE has experienced an 85.55% decline over the past year, demonstrating high price volatility characteristic of gaming tokens
- Market Sentiment: Trading sentiment indicators suggest neutral market conditions, which may lead to continued price consolidation
- Liquidity Concerns: With a 24-hour trading volume of approximately $101,124, liquidity may be limited during high volatility periods
ACE Regulatory Risks
- Gaming Token Classification: Evolving regulatory frameworks for blockchain gaming tokens may impact ACE's operational model
- Cross-border Compliance: As a Web3 gaming platform, Fusionist may face varying regulatory requirements across different jurisdictions
- Securities Law Considerations: Changes in how gaming tokens are classified could affect ACE's trading status and accessibility
ACE Technical Risks
- Smart Contract Vulnerabilities: As a BSC-based token, ACE is subject to potential smart contract exploits or technical issues
- Platform Dependency: ACE's value is closely tied to Fusionist's gaming platform success and user adoption rates
- Competition: The Web3 gaming sector faces intense competition, which may impact Fusionist's market position and ACE token utility
VI. Conclusion and Action Recommendations
ACE Investment Value Assessment
ACE represents a speculative investment opportunity within the blockchain gaming sector. With a current market capitalization of approximately $21 million and a circulating supply of 87 million tokens (59.21% of total supply), ACE offers exposure to Fusionist's Web3 gaming ecosystem. The token's recent performance shows challenges, with a 5.08% decline in 24 hours and an 85.55% decrease over the past year. The current price of $0.241 stands significantly below its historical high of $15.659. Long-term value depends on Fusionist's ability to attract and retain users through its Unity-based gaming platform and multi-mode gameplay offerings. Short-term risks include continued price volatility, limited trading volume, and competitive pressures in the blockchain gaming market.
ACE Investment Recommendations
✅ Beginners: Start with a small allocation (1-2% of crypto portfolio) and focus on understanding Fusionist's gaming ecosystem before increasing exposure. Use Gate Web3 Wallet for secure storage and easy access.
✅ Experienced Investors: Consider tactical positions during market weakness, combining technical analysis with fundamental monitoring of Fusionist's development progress. Maintain strict risk management with position sizes of 3-5%.
✅ Institutional Investors: Conduct thorough due diligence on Fusionist's technology stack, user metrics, and competitive positioning. Consider ACE as part of a diversified blockchain gaming portfolio with appropriate hedging strategies.
ACE Trading Participation Methods
- Spot Trading: Purchase ACE directly on Gate.com and other supporting exchanges with BSC network compatibility
- Dollar-Cost Averaging: Implement systematic investment plans to build positions gradually and reduce timing risk
- Active Monitoring: Track Fusionist's game updates, community growth, and partnership announcements to inform trading decisions
Cryptocurrency investments carry extremely high risks. This article does not constitute investment advice. Investors should make prudent decisions based on their own risk tolerance and are advised to consult professional financial advisors. Never invest more than you can afford to lose.
FAQ
What is the current price of ACE token, and what are its historical high and low prices?
ACE token's current price fluctuates daily based on market conditions. Historical data shows it has reached significant highs during bull markets and experienced lows during market corrections. For real-time pricing information, check major cryptocurrency data platforms for accurate current quotes and detailed price history.
Analyze ACE price trends using technical analysis(support/resistance levels, moving averages), fundamental analysis(project updates, adoption metrics), on-chain metrics(trading volume, holder distribution), and market sentiment indicators. Monitor historical price patterns and correlation with overall crypto market movements for comprehensive predictions.
What are the main factors affecting ACE token price?
ACE token price is primarily influenced by market demand and supply dynamics, trading volume, overall crypto market sentiment, project development progress, regulatory changes, and macroeconomic factors. Increased adoption and positive news typically drive price appreciation.
How to assess the risks and return potential of investing in ACE tokens?
ACE token value depends on market demand, adoption rate, and ecosystem development. Strong fundamentals and growing transaction volume suggest positive growth potential. Evaluate project roadmap, team credibility, and community engagement to assess long-term prospects and returns.
What are the differences and advantages of ACE tokens compared to other mainstream cryptocurrencies?
ACE tokens offer enhanced scalability, lower transaction fees, and faster settlement times. With innovative smart contract functionality and community-driven governance, ACE provides superior efficiency and transparency compared to traditional cryptocurrencies, positioning it as a next-generation blockchain solution.
* The information is not intended to be and does not constitute financial advice or any other recommendation of any sort offered or endorsed by Gate.