This comprehensive guide analyzes Chainbase (C) token's price trajectory from 2026 through 2031, combining historical market data, supply-demand dynamics, and ecosystem growth indicators. The article provides professional price forecasts across conservative, neutral, and optimistic scenarios, with 2026 consolidation expected around $0.0757, potentially reaching $0.1039 by 2031. Designed for investors at all levels, it delivers practical strategies including long-term holding approaches and active trading tactics, alongside critical risk management frameworks covering asset allocation, portfolio diversification, and secure storage solutions on Gate. The analysis addresses key challenges including volatility risks, regulatory uncertainties, and technical dependencies within the blockchain data infrastructure sector, enabling informed investment decisions.
Introduction: C's Market Position and Investment Value
Chainbase (C) serves as a foundational layer for the DataFi era, building an AI-focused hyperdata network since its emergence in 2025. The project has achieved significant adoption with over 500 billion data calls, an active community of 20,000+ developers, and 8,000+ project integrations. As of January 25, 2026, C maintains a market capitalization of approximately $12.16 million with a circulating supply of 160 million tokens, trading at around $0.076. This asset, recognized for its role in transforming fragmented onchain signals into structured, verifiable, and AI-ready data, is playing an increasingly important role in the decentralized data economy.
This article provides a comprehensive analysis of C's price trajectory from 2026 through 2031, combining historical patterns, market supply-demand dynamics, ecosystem development, and macroeconomic conditions to offer professional price forecasts and practical investment strategies for investors.
I. C Price History Review and Market Status
C Historical Price Evolution Trajectory
- 2025: C token launched in July with initial trading activity, experiencing significant volatility throughout the year
- 2025 July: Token reached a notable price level of 0.5396 on July 18th during early trading period
- 2025 October: Market experienced a substantial correction, with price declining to 0.0661 on October 10th
C Current Market Dynamics
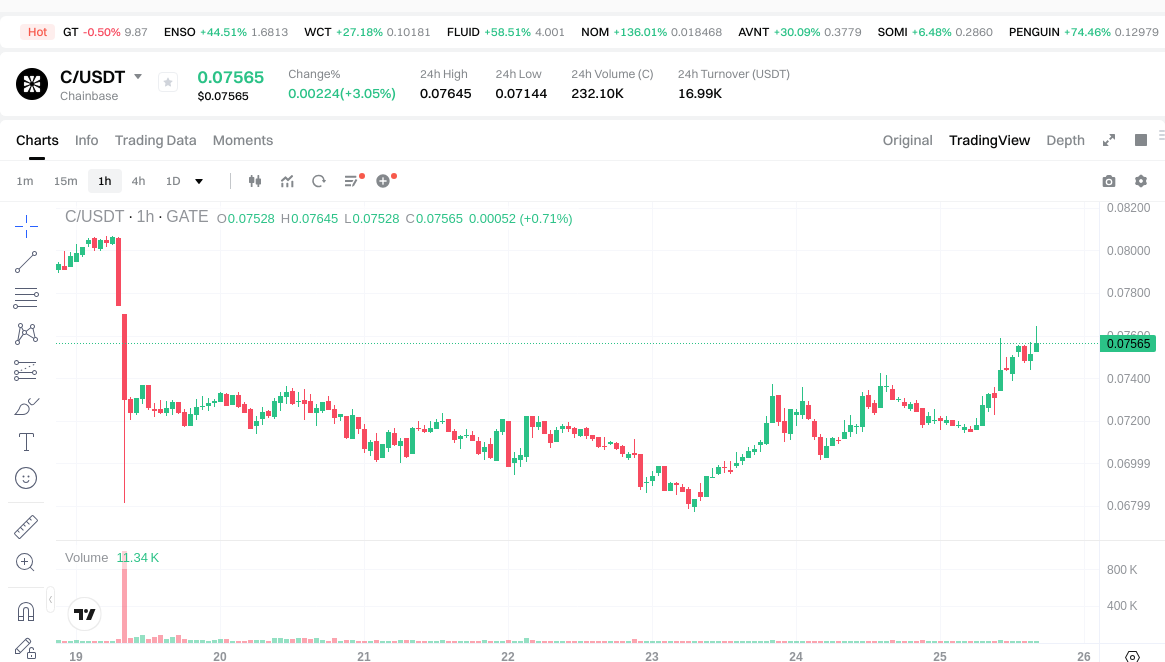
As of January 25, 2026, C is trading at 0.07597, representing a 3.6% increase over the past 24 hours. The token has demonstrated mixed performance across different timeframes, with a 2.13% gain in the last hour, while showing a 3.8% decline over the past week and an 11.83% decrease over the past 30 days. Since its launch, C has achieved a 38.62% appreciation over the past year.
The token's 24-hour trading range spans from 0.07144 to 0.07645, with a total trading volume of 16,607.3723. The current market capitalization stands at 12,155,200, with 160,000,000 tokens in circulation out of a maximum supply of 1,000,000,000, representing a 16% circulation ratio. The fully diluted market cap is calculated at 75,970,000.
With a market dominance of 0.0024%, C ranks at position 1,110 among cryptocurrencies. The token maintains a presence across 22 exchanges and has attracted a holder base of 70,411 addresses. Market sentiment indicators currently register at 25 on the volatility index, reflecting prevailing market conditions.
Click to view the current C market price
C Market Sentiment Index
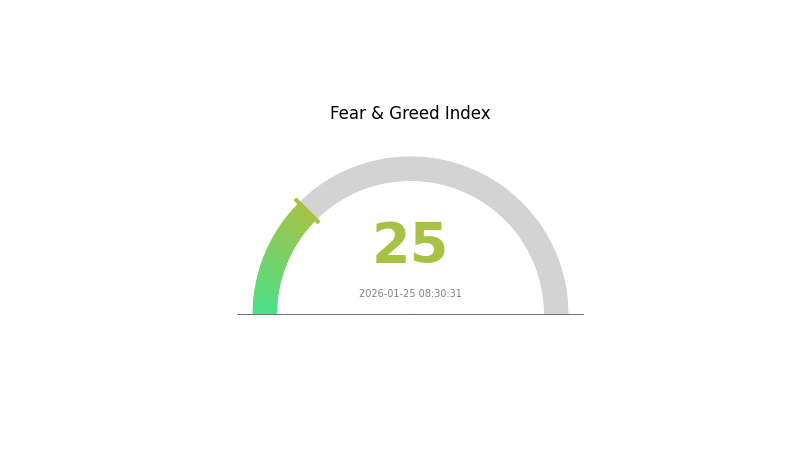
2026-01-25 Fear & Greed Index: 25 (Extreme Fear)
Click to view current Fear & Greed Index
The cryptocurrency market is experiencing extreme fear with an index reading of 25. This indicates strong bearish sentiment among investors, who are likely concerned about market volatility and potential downside risks. During periods of extreme fear, opportunities may emerge for contrarian investors. However, caution is advised as market conditions remain uncertain. Traders should implement proper risk management strategies and avoid making impulsive decisions based on short-term emotions.
C Holdings Distribution
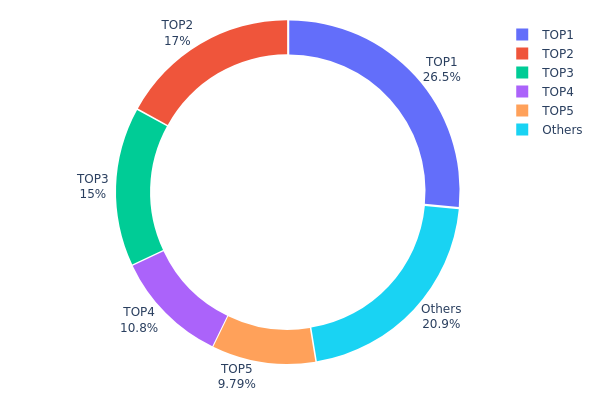
The holdings distribution chart illustrates the concentration of C tokens across different wallet addresses, providing insights into the degree of centralization within the token's ecosystem. This metric serves as a crucial indicator of market structure, as it reveals how token supply is allocated among holders and potential control dynamics within the network.
Based on the current data, C exhibits a highly concentrated distribution pattern. The top five addresses collectively control approximately 79.1% of the total token supply, with the largest single address holding 26.51% (265,142.86K tokens). The second and third largest holders possess 17.00% and 15.00% respectively, while addresses ranked fourth and fifth hold 10.80% and 9.79%. The remaining addresses outside the top five account for only 20.9% of total supply, indicating significant centralization risk.
This concentration level presents several implications for market dynamics. Such distribution creates potential vulnerability to price manipulation, as large holders possess sufficient market power to influence token valuation through coordinated trading activities. The limited dispersion among addresses suggests restricted decentralization, which may undermine the fundamental blockchain principle of distributed ownership. Additionally, this structure amplifies volatility risk, as substantial sell-offs from top addresses could trigger sharp price corrections and liquidity cascades. From a governance perspective, the current distribution pattern may concentrate decision-making authority among few participants, potentially affecting protocol development directions and community consensus mechanisms.
Click to view current C Holdings Distribution
| Top |
Address |
Holding Qty |
Holding (%) |
| 1 |
0x81e7...fdb2b2 |
265142.86K |
26.51% |
| 2 |
0x2219...4fb170 |
170000.00K |
17.00% |
| 3 |
0xee91...a6504b |
150000.00K |
15.00% |
| 4 |
0xff5a...931888 |
108000.00K |
10.80% |
| 5 |
0x2d49...950ccd |
97931.86K |
9.79% |
| - |
Others |
208925.28K |
20.9% |
II. Core Factors Affecting C's Future Price
Based on the provided materials, there is insufficient data to comprehensively analyze the core factors affecting C's future price. The reference materials do not contain specific information regarding supply mechanisms, institutional holdings, macroeconomic impacts, or technical developments for this asset.
Without concrete data on supply dynamics, major institutional positions, corporate adoption patterns, monetary policy correlations, or ecosystem developments, a meaningful analysis cannot be constructed while maintaining analytical rigor and avoiding speculation.
Readers interested in C's price dynamics should monitor official project announcements, on-chain data sources, and verified market intelligence reports as they become available.
III. 2026-2031 C Price Forecast
2026 Outlook
- Conservative forecast: $0.07035 - $0.07565
- Neutral forecast: $0.07565
- Optimistic forecast: $0.07943 (assuming favorable market conditions)
Based on current market analysis, C token is expected to maintain relative stability in 2026, with price fluctuations ranging between $0.07035 and $0.07943. The average trading price may settle around $0.07565, reflecting a consolidation phase as the project continues its development roadmap.
2027-2029 Mid-term Outlook
- Market stage expectations: Gradual appreciation phase with moderate volatility
- Price range forecast:
- 2027: $0.06436 - $0.08374 (potential 2% growth)
- 2028: $0.07016 - $0.08951 (potential 6% cumulative growth)
- 2029: $0.06891 - $0.10209 (potential 11% cumulative growth)
- Key catalysts: Market adoption expansion, ecosystem development progress, and broader cryptocurrency market sentiment
During this period, C token may experience steady growth trajectory, with 2029 potentially marking a breakout year if development milestones are achieved. The widening price range in 2029 suggests increased market activity and potential volatility.
2030-2031 Long-term Outlook
- Baseline scenario: $0.05428 - $0.11418 (assuming continued ecosystem expansion)
- Optimistic scenario: Approaching $0.11427 by 2031 (assuming accelerated adoption and favorable regulatory environment)
- Transformative scenario: Sustained levels above $0.10 (under conditions of significant technological breakthroughs and mainstream acceptance)
By 2030-2031, projections suggest C token could achieve substantial appreciation, with potential cumulative growth of 23-36% from 2026 baseline. The 2031 forecast indicates a possible average price of $0.10388, representing a maturation phase for the project. However, investors should note the wider price bands in these projections, reflecting inherent uncertainties in long-term cryptocurrency valuations.
2026-01-25: C token trading within predicted consolidation range, establishing foundation for potential multi-year growth trajectory.
| Year |
Predicted High Price |
Predicted Average Price |
Predicted Low Price |
Price Change |
| 2026 |
0.07943 |
0.07565 |
0.07035 |
0 |
| 2027 |
0.08374 |
0.07754 |
0.06436 |
2 |
| 2028 |
0.08951 |
0.08064 |
0.07016 |
6 |
| 2029 |
0.10209 |
0.08508 |
0.06891 |
11 |
| 2030 |
0.11418 |
0.09359 |
0.05428 |
23 |
| 2031 |
0.11427 |
0.10388 |
0.07376 |
36 |
IV. C Professional Investment Strategy and Risk Management
C Investment Methodology
(1) Long-term Holding Strategy
- Suitable for: Investors believing in the DataFi ecosystem and blockchain data infrastructure development
- Operational Recommendations:
- Consider accumulating positions during market corrections when C trades below key support levels
- Monitor project development milestones including API call volume growth and developer community expansion
- Storage solution: Gate Web3 Wallet offers secure non-custodial storage with multi-chain support
(2) Active Trading Strategy
- Technical Analysis Tools:
- Volume Profile: Monitor the 24-hour trading volume of approximately 16,607 C tokens to identify accumulation zones
- Support/Resistance Levels: Current trading range between $0.07144 (24h low) and $0.07645 (24h high) provides reference points
- Swing Trading Considerations:
- Recent 7-day decline of 3.8% may present potential entry opportunities for short-term traders
- Watch for volatility patterns given the 38.62% annual gain despite recent monthly decline of 11.83%
C Risk Management Framework
(1) Asset Allocation Principles
- Conservative investors: 2-3% of crypto portfolio allocation
- Moderate investors: 5-8% of crypto portfolio allocation
- Aggressive investors: 10-15% of crypto portfolio allocation
(2) Risk Hedging Solutions
- Portfolio Diversification: Combine C holdings with established blockchain infrastructure tokens
- Position Sizing: Implement dollar-cost averaging to mitigate entry timing risk
(3) Secure Storage Solutions
- Hot Wallet Recommendation: Gate Web3 Wallet provides convenient access for active trading
- Cold Storage Option: Consider hardware wallet solutions for long-term holdings exceeding portfolio threshold
- Security Precautions: Enable two-factor authentication, never share private keys, verify contract address (0xba12bc7b210e61e5d3110b997a63ea216e0e18f7 on Base network) before transactions
V. C Potential Risks and Challenges
C Market Risks
- Volatility Risk: Historical price range from $0.0661 to $0.5396 demonstrates significant price fluctuations
- Liquidity Risk: With 22 exchange listings and modest 24-hour volume, large orders may impact market price
- Competition Risk: The blockchain data infrastructure sector includes multiple competing solutions
C Regulatory Risks
- Classification Uncertainty: Evolving regulatory frameworks for data-focused blockchain projects may affect operations
- Cross-border Compliance: Multi-jurisdictional operations require adherence to varying regulatory standards
- Data Privacy Regulations: Blockchain data aggregation services may face scrutiny under data protection laws
C Technical Risks
- Smart Contract Risk: ERC-20 token standard implementation requires ongoing security audits
- Integration Dependencies: Reliance on 8,000+ project integrations creates potential points of failure
- Scalability Challenges: Handling 500 billion+ data calls demands continuous infrastructure optimization
VI. Conclusion and Action Recommendations
C Investment Value Assessment
Chainbase (C) represents a specialized investment opportunity within the blockchain data infrastructure sector. With backing from established venture funds and an active community of 20,000+ developers, the project demonstrates credible foundation-building efforts. The current market capitalization of approximately $12.16 million and fully diluted valuation of $75.97 million suggest early-stage positioning. However, the 16% circulating supply (160 million of 1 billion total tokens) indicates potential future dilution risks. The 30-day decline of 11.83% contrasts with the annual gain of 38.62%, reflecting both growth potential and market volatility inherent to emerging infrastructure projects.
C Investment Recommendations
✅ Beginners: Start with minimal allocation (1-2% of crypto portfolio) to gain exposure while understanding the DataFi sector dynamics; use Gate Web3 Wallet for secure storage and consider educational resources about blockchain data infrastructure
✅ Experienced Investors: Implement staged entry strategy during price consolidation periods; monitor developer activity metrics and integration growth as fundamental indicators; maintain position sizing discipline given the relatively low circulating supply
✅ Institutional Investors: Conduct thorough due diligence on tokenomics and vesting schedules considering the 84% uncirculated supply; evaluate competitive positioning within the blockchain data layer ecosystem; assess alignment with broader data infrastructure investment thesis
C Trading Participation Methods
- Spot Trading: Available on Gate.com and 21 other exchanges with varying liquidity profiles
- Dollar-Cost Averaging: Systematic periodic purchases to reduce timing risk exposure
- Limit Orders: Strategic placement at key support levels identified through technical analysis
Cryptocurrency investment carries extreme risk, and this article does not constitute investment advice. Investors should make prudent decisions based on their own risk tolerance and are advised to consult professional financial advisors. Never invest more than you can afford to lose.
FAQ
What is the current price of C coin? What are the historical highest and lowest prices?
C coin's current price fluctuates based on market conditions. Historical data shows significant volatility, with the all-time high reaching approximately $0.85 and the all-time low around $0.02. Current market price varies; check real-time data for the latest valuation.
What are the main factors for C coin price prediction? How to analyze technical aspects, fundamentals, and market sentiment?
C coin price prediction relies on three key factors: Technical analysis examines price charts, support/resistance levels, and trading volume trends. Fundamental analysis evaluates project development, partnerships, and ecosystem growth. Market sentiment tracks investor confidence through social media activity and community engagement. Combined analysis of these three dimensions provides comprehensive price movement insights.
What are the advantages and disadvantages of C coin compared to other mainstream cryptocurrencies?
C coin offers faster transaction speeds and lower fees than Bitcoin and Ethereum. Its smart contract platform rivals competitors but has smaller trading volume. Development ecosystem is growing rapidly, though adoption remains behind established players like Ethereum.
What are the main driving factors affecting C coin price fluctuations?
C coin price is primarily driven by market demand and trading volume, blockchain network activity, regulatory developments, macroeconomic conditions, and sentiment shifts in the crypto market. Technical factors like adoption rates and ecosystem growth also significantly influence price movements.
How to assess the reliability of C coin price predictions? What are common prediction pitfalls?
Evaluate predictions by analyzing historical accuracy rates, data sources, and methodology transparency. Avoid pitfalls: over-reliance on single indicators, ignoring market volatility, and following unverified influencers. Focus on fundamental analysis, trading volume trends, and on-chain metrics for more reliable assessments.
What are the long-term development prospects and application scenarios of C coin?
C coin demonstrates strong potential in decentralized finance, smart contracts, and blockchain infrastructure. With growing adoption in Web3 ecosystems, institutional interest, and technological innovations, C coin is positioned for sustainable growth and expanded real-world applications across multiple sectors.
* The information is not intended to be and does not constitute financial advice or any other recommendation of any sort offered or endorsed by Gate.