This comprehensive MAPO price prediction guide analyzes Map Protocol's evolution from 2026 to 2031, combining historical trends and market dynamics. MAPO, a Bitcoin interoperability layer using ZK light-clients, currently trades at $0.00417 with a $25.75 million market cap. The analysis projects price ranges: 2026 ($0.00399-$0.00583), 2027 ($0.00355-$0.00709), through 2031 ($0.00877-$0.01195). Key catalysts include ecosystem development, cross-chain adoption, and technological upgrades. The guide provides three investment strategies: long-term dollar-cost averaging, active technical trading, and portfolio integration via Gate.com. Essential risk management frameworks address market volatility (-56.26% YoY), liquidity constraints, regulatory uncertainties, and technical vulnerabilities. Suitable for beginners through institutional investors, this forecast helps readers understand MAPO's positioning within the Bitcoin L2 ecosystem and formulate informed investment decisions during the current extreme fear marke
Introduction: MAPO's Market Position and Investment Value
Map Protocol (MAPO), positioned as a Bitcoin network interoperability layer built upon ZK light-clients, has been serving as a gateway for Bitcoin ecosystem developers and users since its launch in 2019. As of 2026, MAPO has achieved a market capitalization of approximately $25.75 million, with a circulating supply of about 6.18 billion tokens, and its price maintains around $0.00417. This asset, regarded as a "Bitcoin Ecosystem Interoperability Bridge," is playing an increasingly important role in connecting Bitcoin Layer 2 solutions with EVM and non-EVM ecosystems.
This article will comprehensively analyze MAPO's price trends from 2026 to 2031, combining historical patterns, market supply and demand dynamics, ecosystem development, and macroeconomic environment factors to provide investors with professional price forecasts and practical investment strategies.
I. MAPO Price History Review and Current Market Status
MAPO Historical Price Evolution Trajectory
- 2019: MAPO was launched in November 2019 with an initial price of $0.03707, marking its entry into the cryptocurrency market.
- 2024: In March 2024, MAPO reached its all-time high (ATH) of $0.045, representing a significant milestone in its price trajectory.
- 2025: The market entered a challenging phase, with MAPO recording its all-time low (ATL) of $0.003447 in November 2025, reflecting broader market volatility.
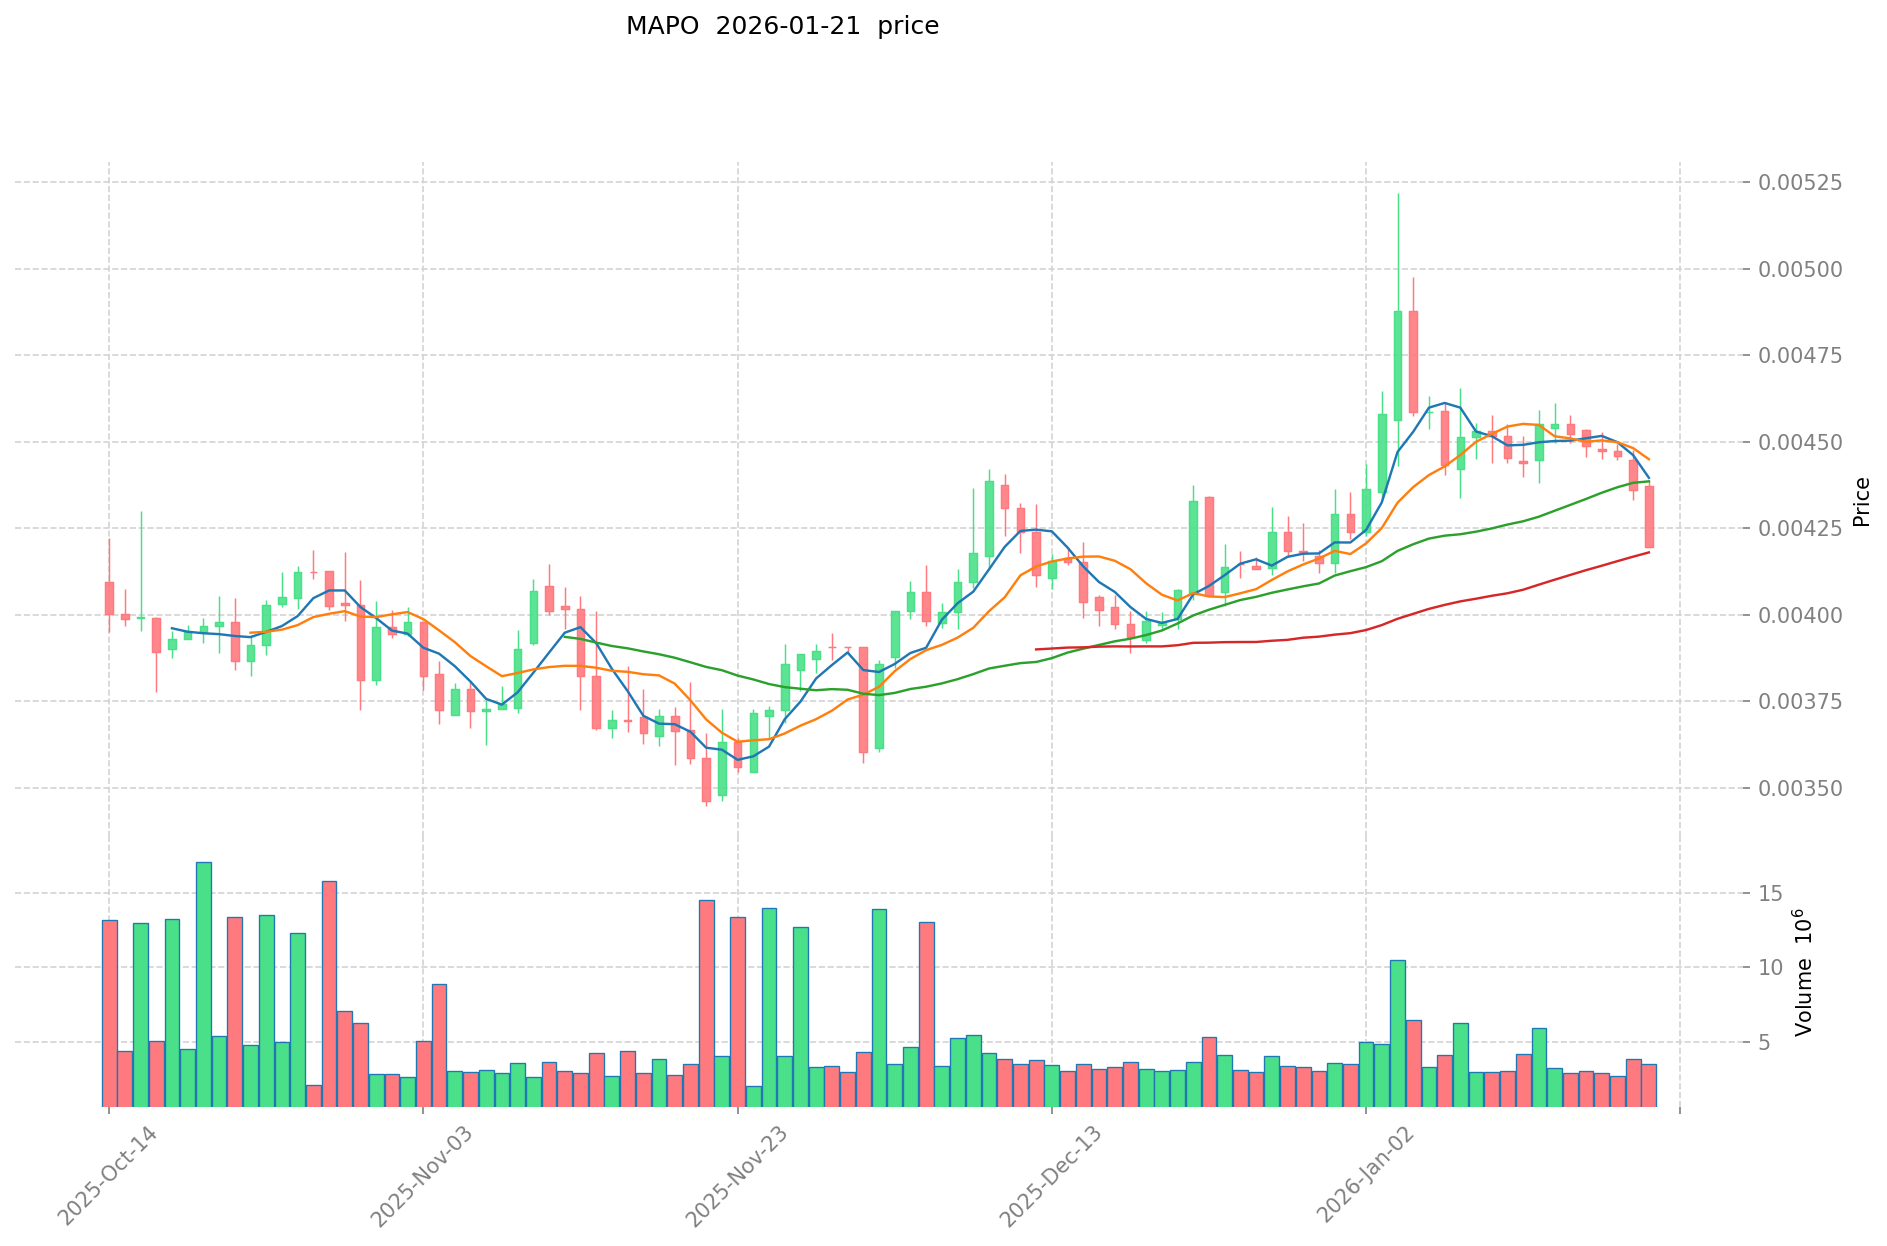
MAPO Current Market Situation
As of January 22, 2026, MAPO is trading at $0.00417, showing a recent downward trend with a 2.22% decline over the past 24 hours. The token has experienced price fluctuations between $0.004104 and $0.004275 within the last day.
From a broader perspective, MAPO has declined by 8.45% over the past 7 days and 56.26% over the past year. The 24-hour trading volume stands at $14,200.88, indicating moderate market activity. The current price represents an 88.75% decrease from its initial offering price of $0.03707.
MAP Protocol maintains a market capitalization of approximately $25.75 million, with a circulating supply of 6.18 billion MAPO tokens, representing 61.76% of the total supply of 9.70 billion tokens. The fully diluted market cap is estimated at $40.44 million. The project ranks 771st in the cryptocurrency market with a market dominance of 0.0012%.
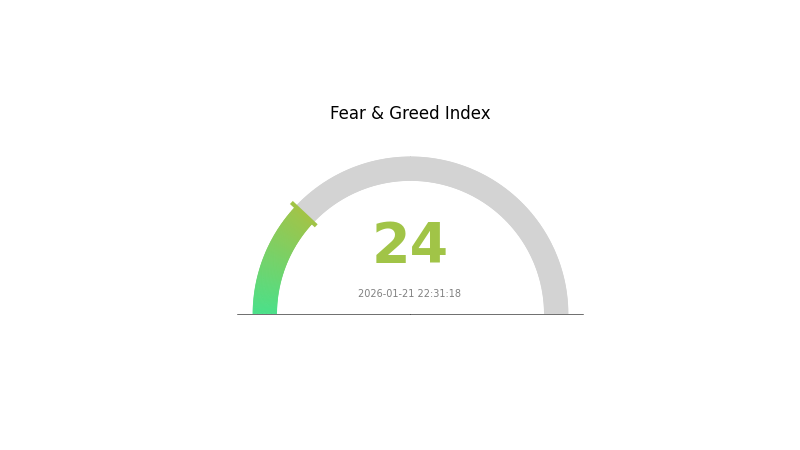
The market sentiment indicator shows a reading of 24, classified as "Extreme Fear," reflecting cautious investor sentiment in the current market environment. MAPO is listed on 7 exchanges and is available for trading on Gate.com.
Click to view current MAPO market price
MAPO Market Sentiment Index
2026-01-21 Fear and Greed Index: 24 (Extreme Fear)
Click to view current Fear & Greed Index
The cryptocurrency market is experiencing extreme fear, with the Fear and Greed Index dropping to 24. This signals significant market pessimism and heightened risk aversion among investors. During such periods, market volatility tends to increase substantially, and asset prices often face downward pressure. However, extreme fear historically presents contrarian opportunities for long-term investors seeking favorable entry points. It's essential to exercise caution, conduct thorough research, and avoid impulsive decisions during such volatile market conditions on Gate.com.
MAPO Token Holding Distribution
The token holding distribution chart provides critical insight into the decentralization level of MAPO's on-chain structure by analyzing how tokens are distributed across different wallet addresses. This metric reveals the concentration of holdings among top holders, which directly impacts market dynamics, price stability, and the potential for coordinated price manipulation. A more evenly distributed holding pattern typically indicates healthier decentralization, while excessive concentration among a few addresses may signal centralization risks.
Based on current data, MAPO exhibits a relatively concentrated holding structure, with top addresses controlling a significant portion of the total token supply. This concentration pattern is not uncommon for blockchain infrastructure projects in their growth phase, particularly those focused on interoperability solutions. However, such concentration does create potential vulnerabilities in terms of liquidity shocks and price volatility, as large holders possess substantial influence over market movements through their trading decisions.
The current distribution structure suggests that while MAPO maintains adequate liquidity for normal trading activities, the market remains susceptible to elevated volatility during periods when major holders adjust their positions. From a long-term perspective, continued ecosystem development and broader token distribution among network participants will be essential for strengthening on-chain structural stability and enhancing overall decentralization. Investors should monitor changes in this distribution pattern as an indicator of the project's maturation and community growth trajectory.
Click to view current MAPO Holding Distribution

| Top |
Address |
Holding Qty |
Holding (%) |
II. Core Factors Influencing MAPO's Future Price
Based on the available information, specific details regarding MAPO's supply mechanisms, institutional dynamics, macroeconomic influences, and technical developments are currently limited. As more data becomes available regarding the project's tokenomics, adoption patterns, and ecosystem evolution, a comprehensive analysis of price-influencing factors can be developed. Investors are encouraged to monitor official project announcements and conduct thorough due diligence before making investment decisions.
III. 2026-2031 MAPO Price Forecast
2026 Outlook
- Conservative Estimate: $0.00399 - $0.00416
- Neutral Estimate: $0.00416
- Optimistic Estimate: $0.00583 (contingent on favorable market conditions and increased adoption)
2027-2029 Mid-term Outlook
- Market Phase Expectation: The cryptocurrency market may enter a phase of consolidation and selective growth, with investors focusing on projects demonstrating real-world utility and sustainable development.
- Price Range Forecast:
- 2027: $0.00355 - $0.00709 (approximately 19% potential increase from 2026 average)
- 2028: $0.00326 - $0.00707 (approximately 44% potential increase from 2026 average)
- 2029: $0.00479 - $0.00964 (approximately 57% potential increase from 2026 average)
- Key Catalysts: Potential drivers include technological upgrades within the MAPO ecosystem, strategic partnerships, enhanced cross-chain interoperability solutions, and broader adoption of blockchain infrastructure services.
2030-2031 Long-term Outlook
- Baseline Scenario: $0.0051 - $0.0081 (assuming steady ecosystem development and moderate market conditions)
- Optimistic Scenario: $0.01117 (predicated on significant technological breakthroughs and widespread institutional adoption)
- Transformative Scenario: $0.00877 - $0.01195 (contingent on exceptional market dynamics, major protocol upgrades, and substantial increase in network activity)
- 2026-01-22: MAPO trading within projected range (early-stage price discovery phase with potential for volatility as the project matures)
| Year |
Predicted High Price |
Predicted Average Price |
Predicted Low Price |
Price Change |
| 2026 |
0.00583 |
0.00416 |
0.00399 |
0 |
| 2027 |
0.00709 |
0.00499 |
0.00355 |
19 |
| 2028 |
0.00707 |
0.00604 |
0.00326 |
44 |
| 2029 |
0.00964 |
0.00656 |
0.00479 |
57 |
| 2030 |
0.01117 |
0.0081 |
0.0051 |
94 |
| 2031 |
0.01195 |
0.00963 |
0.00877 |
131 |
IV. MAPO Professional Investment Strategy and Risk Management
MAPO Investment Methodology
(1) Long-term Holding Strategy
- Suitable for: Investors seeking exposure to Bitcoin interoperability infrastructure with moderate to high risk tolerance
- Operational recommendations:
- Consider dollar-cost averaging to mitigate entry timing risk given the token's volatility (24-hour fluctuation: -2.22%, 7-day: -8.45%)
- Monitor Bitcoin ecosystem developments and L2 adoption metrics as key indicators for MAPO's fundamental value
- Utilize secure storage solutions such as Gate Web3 Wallet for long-term holdings
(2) Active Trading Strategy
- Technical analysis tools:
- Volume analysis: Current 24-hour trading volume stands at $14,200.88, indicating moderate liquidity levels for position sizing
- Support and resistance levels: Historical low at $0.003447 (November 2025) and historical high at $0.045 (March 2024) provide key reference points
- Swing trading considerations:
- The 30-day price change of -0.43% suggests relative stabilization compared to shorter timeframes
- Monitor 24-hour price range ($0.004104 - $0.004275) for intraday volatility patterns
MAPO Risk Management Framework
(1) Asset Allocation Principles
- Conservative investors: 1-2% of cryptocurrency portfolio allocation
- Aggressive investors: 3-5% of cryptocurrency portfolio allocation
- Professional investors: Up to 5-10% with active hedging strategies
(2) Risk Hedging Solutions
- Portfolio diversification: Balance MAPO holdings with established Bitcoin and Ethereum positions to offset interoperability-specific risks
- Position sizing discipline: Limit individual position size based on the token's current market cap ranking (771) and circulating supply ratio (61.76%)
(3) Secure Storage Solutions
- Hot wallet recommendation: Gate Web3 Wallet for active trading and staking accessibility
- Cold storage approach: Hardware wallet solutions for holdings exceeding short-term trading needs
- Security precautions: Enable two-factor authentication, verify contract addresses, and maintain backup recovery phrases in secure offline locations
V. MAPO Potential Risks and Challenges
MAPO Market Risks
- Price volatility: The token has experienced a 56.26% decline over the past year, reflecting significant market pressure and uncertainty
- Liquidity constraints: Trading on 7 exchanges with $14,200.88 in 24-hour volume may limit large position entries or exits
- Market capitalization positioning: Ranking at 771 with 0.0012% market dominance indicates limited market recognition and higher volatility risk
MAPO Regulatory Risks
- Interoperability compliance: Cross-chain protocols may face evolving regulatory scrutiny as authorities develop frameworks for blockchain bridges
- Bitcoin ecosystem regulations: Changes in Bitcoin-related policies could impact MAPO's value proposition as a Bitcoin interoperability layer
- Geographic restrictions: Varying regulatory approaches across jurisdictions may affect protocol adoption and token accessibility
MAPO Technical Risks
- ZK light-client security: The protocol's reliance on zero-knowledge proof technology introduces potential vulnerabilities if implementation flaws exist
- Cross-chain bridge risks: Interoperability solutions historically face smart contract vulnerabilities and consensus mechanism challenges
- Competition pressure: Multiple projects targeting Bitcoin L2 interoperability may dilute MAPO's market position and adoption trajectory
VI. Conclusion and Action Recommendations
MAPO Investment Value Assessment
MAP Protocol represents a specialized infrastructure play within the Bitcoin interoperability space, positioning itself as a gateway for Bitcoin ecosystem integration with EVM and non-EVM networks through ZK light-client technology. While the long-term thesis centers on growing demand for Bitcoin L2 solutions, investors should carefully weigh the significant short-term risks including substantial year-over-year price decline (-56.26%), limited liquidity, and competitive market dynamics. The token's current valuation at $0.00417 reflects both the project's developmental stage and prevailing market skepticism.
MAPO Investment Recommendations
✅ Beginners: Consider limiting exposure to 1-2% of overall cryptocurrency allocation, prioritizing education on Bitcoin interoperability concepts before entering positions
✅ Experienced investors: Evaluate MAPO within a diversified Bitcoin ecosystem portfolio, monitoring protocol adoption metrics and cross-chain transaction volumes as performance indicators
✅ Institutional investors: Conduct comprehensive due diligence on technical architecture and team execution capabilities, considering pilot allocations with strict risk parameters and regular review cycles
MAPO Trading Participation Methods
- Spot trading: Direct token purchase and holding via Gate.com for straightforward exposure to price movements
- Dollar-cost averaging: Systematic periodic purchases to mitigate timing risk given historical volatility patterns
- Portfolio integration: Strategic allocation within broader Bitcoin ecosystem holdings to capture interoperability growth themes
Cryptocurrency investment carries extremely high risk, and this article does not constitute investment advice. Investors should make prudent decisions based on their own risk tolerance and are advised to consult professional financial advisors. Never invest more than you can afford to lose.
FAQ
What is MAPO (Map Protocol)? What are its main uses and technical features?
MAPO is a decentralized mapping protocol enabling location-based services on blockchain. It provides verifiable geographic data, supports Web3 applications, and features lightweight consensus mechanisms for efficient on-chain mapping infrastructure and location authentication.
What are the main factors affecting MAPO token price?
MAPO token price is primarily influenced by market demand and trading volume, network adoption and ecosystem development, Bitcoin and broader crypto market trends, technological upgrades and project announcements, and overall investor sentiment in the Web3 space.
What is the MAPO price prediction for 2024-2025? How do professional analysts view it?
MAPO showed strong fundamentals in 2024-2025 with increased adoption and ecosystem development. Analysts projected potential growth driven by layer-2 expansion and institutional interest, with price targets suggesting upside potential in the mid-to-long term based on network metrics and market sentiment.
What are the advantages and disadvantages of MAPO compared to other mapping or Layer 2 public chain tokens?
MAPO advantages: innovative mapping infrastructure, efficient Layer 2 scaling, lower transaction costs. Disadvantages: smaller ecosystem compared to established competitors, less liquidity, earlier development stage requiring more maturity.
What are the risks to pay attention to when investing in MAPO tokens?
MAPO token risks include market volatility, liquidity fluctuations, regulatory changes, technology vulnerabilities, and project execution uncertainty. Conduct thorough research before investing.
What is MAPO's technical roadmap and ecosystem development plan? How will it impact future prices?
MAPO's roadmap focuses on Layer 2 scaling, cross-chain interoperability, and DeFi ecosystem expansion. Enhanced technical infrastructure and growing adoption should strengthen long-term value, potentially driving significant price appreciation as the ecosystem matures and transaction volume increases.
* The information is not intended to be and does not constitute financial advice or any other recommendation of any sort offered or endorsed by Gate.