This article provides a detailed comparison between two popular DeFi lending protocols, AMP and AAVE, highlighting their distinct investment values and potential risks. It evaluates historical price trends, supply mechanisms, institutional adoptions, and technical developments to guide investors in making informed decisions between the tokens. Ideal for investors seeking insights into crypto lending protocols and market strategies, the piece touches on price predictions, investment strategies, and risk assessments. Suitable for novice, experienced, and institutional investors, it offers a comprehensive understanding of AMP vs. AAVE in the current DeFi landscape.
Introduction: AMP vs AAVE Investment Comparison
In the cryptocurrency market, AMP vs AAVE comparison has always been an unavoidable topic for investors. The two not only differ significantly in market cap ranking, application scenarios, and price performance, but also represent different positioning in the crypto asset space.
AMP (AMP): Since its launch in 2020, it has gained market recognition for its role as a collateral token in the Flexa payment network.
AAVE (AAVE): Introduced in 2020, it has been hailed as a leading decentralized lending protocol, becoming one of the most prominent DeFi platforms globally.
This article will provide a comprehensive analysis of the investment value comparison between AMP and AAVE, focusing on historical price trends, supply mechanisms, institutional adoption, technological ecosystems, and future predictions, attempting to answer the question most important to investors:
"Which is the better buy right now?"
I. Price History Comparison and Current Market Status
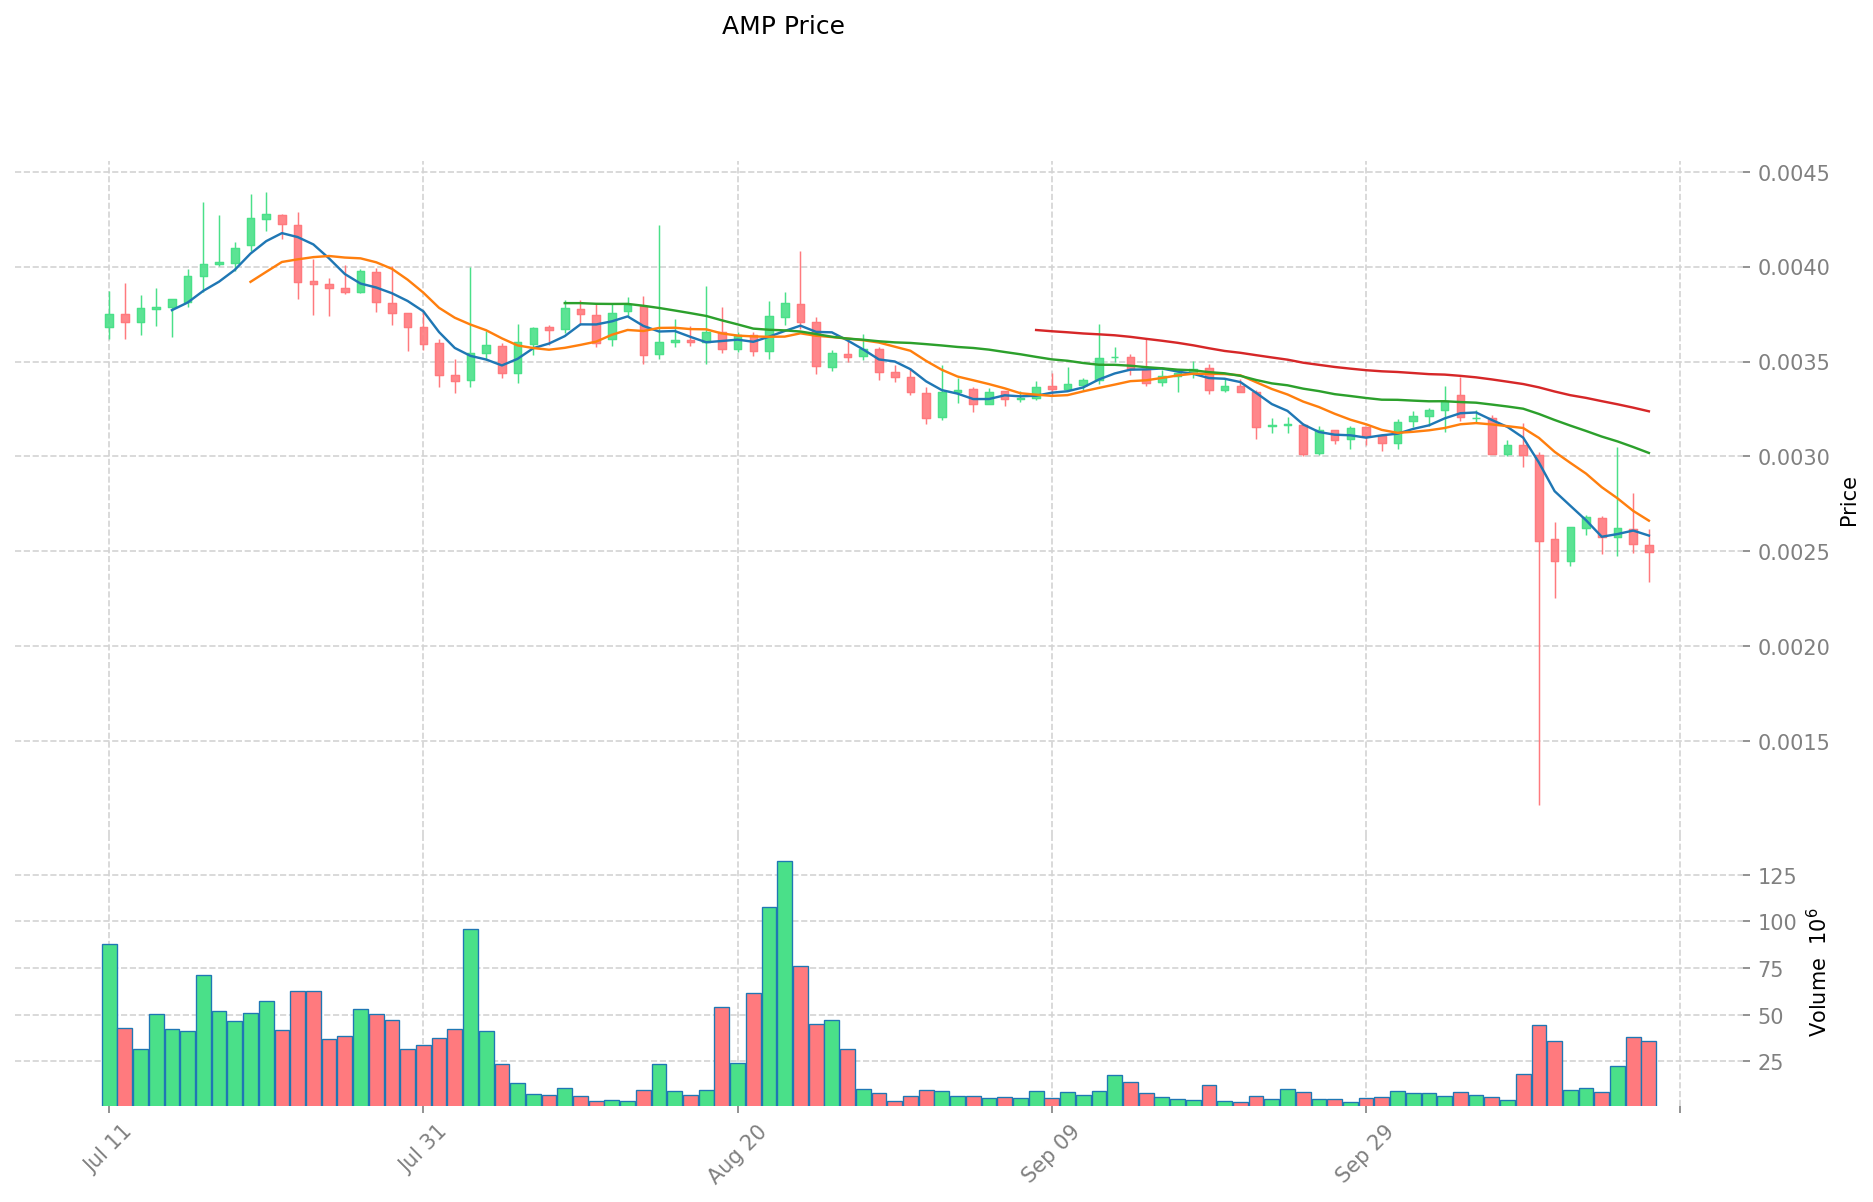
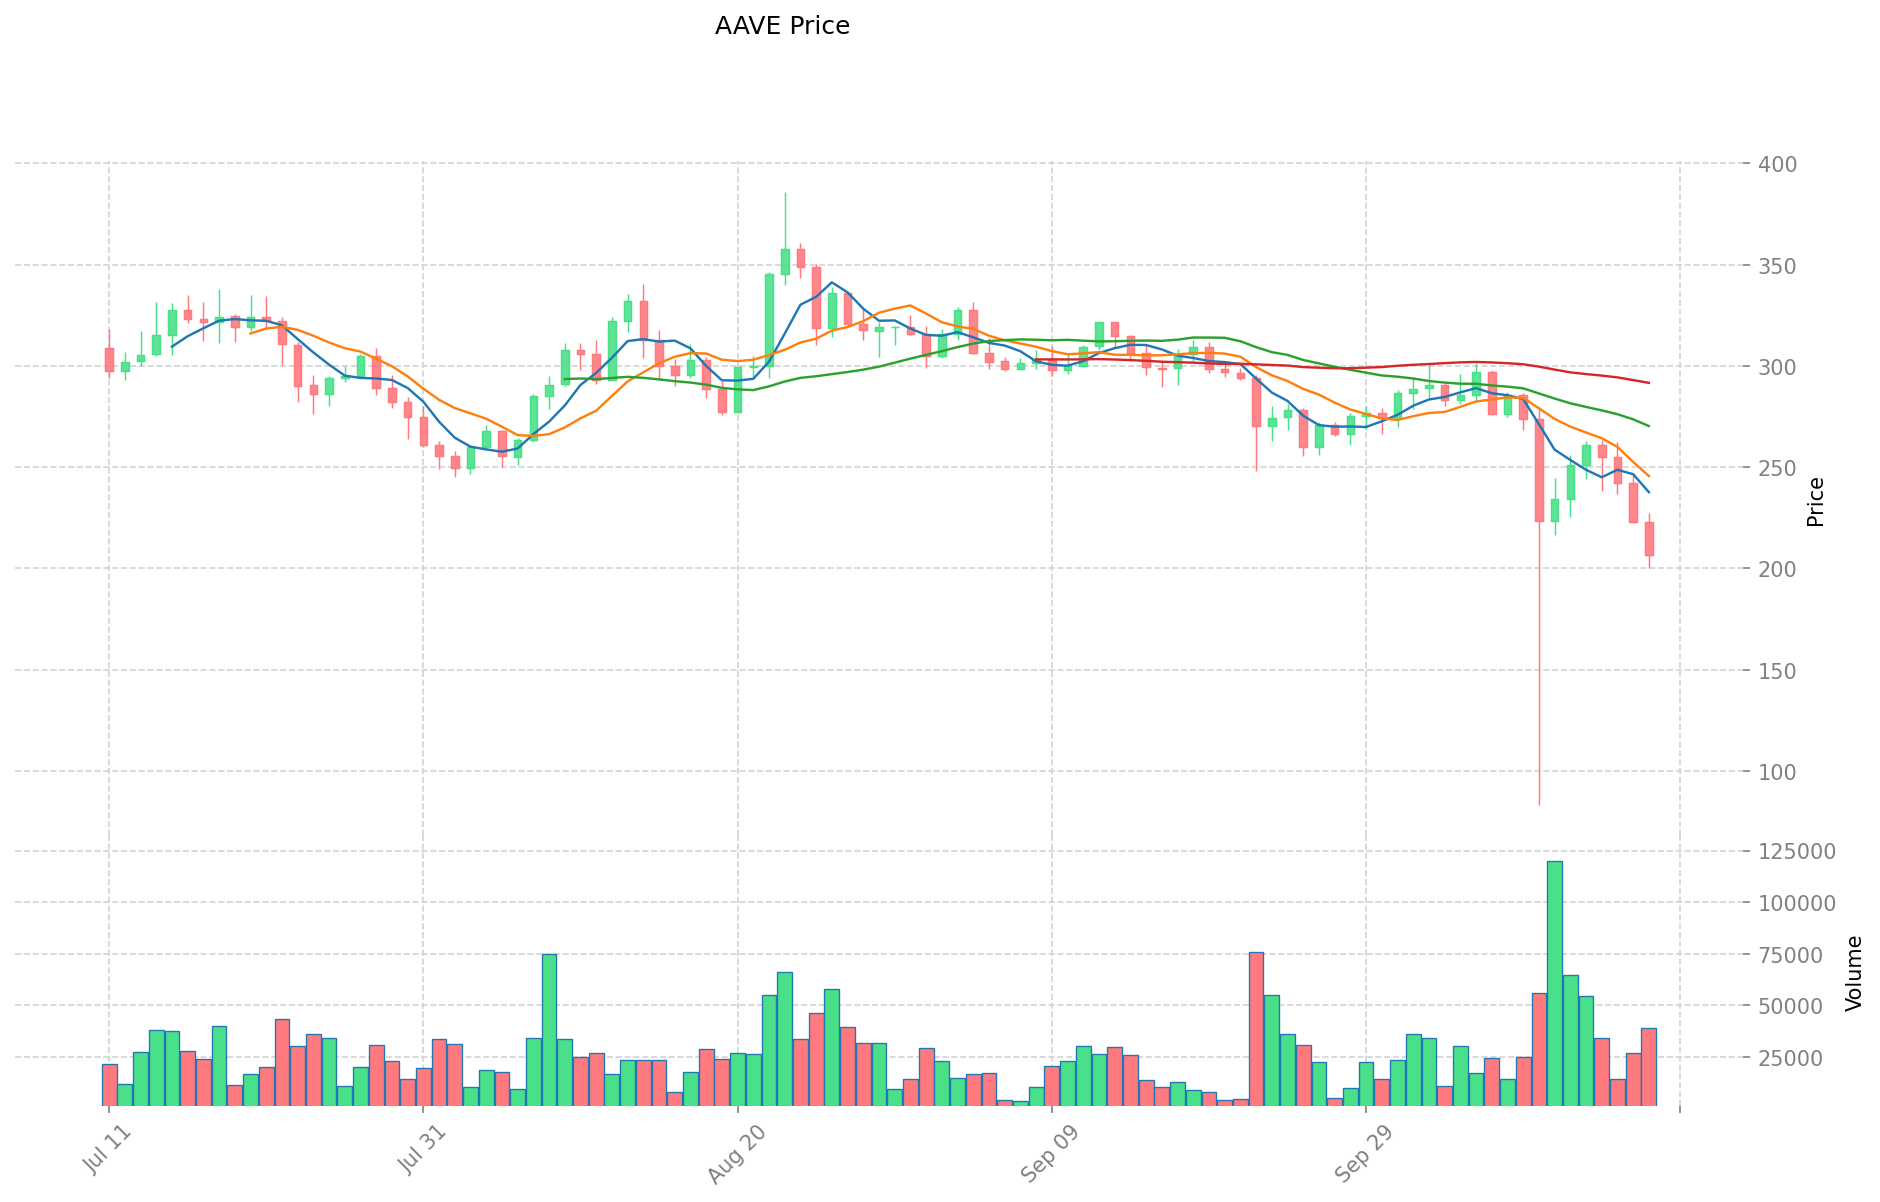
AMP and AAVE Historical Price Trends
- 2020: AAVE launched through the improvement proposal (AIP1), converting LEND tokens to AAVE at a 100:1 ratio.
- 2021: AMP reached its all-time high of $0.120813 on June 17, while AAVE hit its peak at $661.69 on May 19.
- Comparative analysis: During the market cycle, AMP dropped from its all-time high to a low of $0.00140933 on October 13, 2023, while AAVE's lowest point was $26.02 on November 5, 2020.
Current Market Situation (2025-10-18)
- AMP current price: $0.002501
- AAVE current price: $206.57
- 24-hour trading volume: $89,725.25 (AMP) vs $8,131,923.33 (AAVE)
- Market Sentiment Index (Fear & Greed Index): 23 (Extreme Fear)
Click to view real-time prices:
- Check AMP current price Market Price
- Check AAVE current price Market Price
II. Core Factors Affecting Investment Value of AMP vs AAVE
Supply Mechanisms Comparison (Tokenomics)
- AMP: Fixed supply of 100 billion tokens with 48 billion currently in circulation. No new tokens will ever be created.
- AAVE: Maximum supply of 16 million tokens with about 14.6 million in circulation. AAVE has a deflationary model where tokens used for fees are burned.
- 📌 Historical pattern: Fixed-supply models like AMP tend to be more susceptible to speculation-driven price volatility, while deflationary models like AAVE's can create upward price pressure during periods of heavy protocol usage.
Institutional Adoption and Market Applications
- Institutional holdings: AAVE has attracted more institutional interest, with adoption by major DeFi players and inclusion in institutional DeFi products.
- Enterprise adoption: AAVE has stronger enterprise integration through its liquidity protocols, while AMP serves as collateral in payment networks like Flexa.
- Regulatory stance: Both tokens face varying regulatory treatment across jurisdictions, with lending protocols like AAVE facing increased scrutiny in certain markets.
Technical Development and Ecosystem Building
- AMP technical upgrades: Focuses on improving its collateralization network for instant, fraud-proof payments.
- AAVE technical development: Continuously expanding lending capabilities with V3 protocol improvements including portal functionality, isolation mode, and high-efficiency mode.
- Ecosystem comparison: AAVE has a more established DeFi ecosystem with multiple lending markets across chains, while AMP is primarily focused on payment applications through the Flexa network.
Macroeconomic Factors and Market Cycles
- Performance during inflation: AAVE potentially offers better inflation protection through its yield-generating capabilities in the lending market.
- Macroeconomic monetary policy: Rising interest rates typically pressure both tokens, but AAVE's interest-bearing mechanics may provide some offsetting benefits.
- Geopolitical factors: Cross-border transaction demand benefits AMP's payment infrastructure use case, while regulatory uncertainty affects both protocols.
III. 2025-2030 Price Prediction: AMP vs AAVE
Short-term Prediction (2025)
- AMP: Conservative $0.002425 - $0.0025 | Optimistic $0.0025 - $0.003025
- AAVE: Conservative $144.928 - $207.04 | Optimistic $207.04 - $265.0112
Mid-term Prediction (2027)
- AMP may enter a growth phase, with an estimated price range of $0.0019448 - $0.004436575
- AAVE may enter a bullish market, with an estimated price range of $190.20122976 - $356.29244448
- Key drivers: Institutional capital inflow, ETF, ecosystem development
Long-term Prediction (2030)
- AMP: Base scenario $0.003586132055756 - $0.005050890219375 | Optimistic scenario $0.005050890219375 - $0.006111577165443
- AAVE: Base scenario $286.1544484413048 - $427.09619170344 | Optimistic scenario $427.09619170344 - $538.1412015463344
View detailed price predictions for AMP and AAVE
Disclaimer: This analysis is based on historical data and market projections. Cryptocurrency markets are highly volatile and unpredictable. This information should not be considered as financial advice. Always conduct your own research before making any investment decisions.
AMP:
| 年份 |
预测最高价 |
预测平均价格 |
预测最低价 |
涨跌幅 |
| 2025 |
0.003025 |
0.0025 |
0.002425 |
0 |
| 2026 |
0.003315 |
0.0027625 |
0.002458625 |
10 |
| 2027 |
0.004436575 |
0.00303875 |
0.0019448 |
21 |
| 2028 |
0.004896337875 |
0.0037376625 |
0.002279974125 |
49 |
| 2029 |
0.00578478025125 |
0.0043170001875 |
0.0036262801575 |
72 |
| 2030 |
0.006111577165443 |
0.005050890219375 |
0.003586132055756 |
101 |
AAVE:
| 年份 |
预测最高价 |
预测平均价格 |
预测最低价 |
涨跌幅 |
| 2025 |
265.0112 |
207.04 |
144.928 |
0 |
| 2026 |
299.752512 |
236.0256 |
167.578176 |
14 |
| 2027 |
356.29244448 |
267.889056 |
190.20122976 |
29 |
| 2028 |
405.717975312 |
312.09075024 |
199.7380801536 |
51 |
| 2029 |
495.28802063088 |
358.904362776 |
315.83583924288 |
73 |
| 2030 |
538.1412015463344 |
427.09619170344 |
286.1544484413048 |
106 |
IV. Investment Strategy Comparison: AMP vs AAVE
Long-term vs Short-term Investment Strategies
- AMP: Suitable for investors focused on payment scenarios and ecosystem potential
- AAVE: Suitable for investors seeking stability and inflation-resistant properties
Risk Management and Asset Allocation
- Conservative investors: AMP: 30% vs AAVE: 70%
- Aggressive investors: AMP: 60% vs AAVE: 40%
- Hedging tools: Stablecoin allocation, options, cross-currency portfolios
V. Potential Risk Comparison
Market Risk
- AMP: Higher volatility due to fixed supply and speculation
- AAVE: Exposure to DeFi market fluctuations and liquidity risks
Technical Risk
- AMP: Scalability, network stability
- AAVE: Smart contract vulnerabilities, protocol upgrades
Regulatory Risk
- Global regulatory policies have differing impacts on both tokens
VI. Conclusion: Which Is the Better Buy?
📌 Investment Value Summary:
- AMP advantages: Potential in payment networks, fixed supply
- AAVE advantages: Established DeFi ecosystem, deflationary model
✅ Investment Advice:
- Novice investors: Consider a higher allocation to AAVE for its established position
- Experienced investors: Balanced portfolio with both AMP and AAVE
- Institutional investors: AAVE may be more suitable due to its institutional adoption and DeFi leadership
⚠️ Risk Warning: Cryptocurrency markets are highly volatile. This article does not constitute investment advice.
None
VII. FAQ
Q1: What are the key differences between AMP and AAVE?
A: AMP is a collateral token for the Flexa payment network, while AAVE is a token for a decentralized lending protocol. AMP has a fixed supply of 100 billion tokens, whereas AAVE has a maximum supply of 16 million with a deflationary model.
Q2: Which token has performed better historically?
A: AAVE has generally shown stronger price performance. In 2021, AAVE reached an all-time high of $661.69, while AMP's peak was $0.120813. As of 2025-10-18, AAVE's price is $206.57, compared to AMP's $0.002501.
Q3: How do the supply mechanisms of AMP and AAVE differ?
A: AMP has a fixed supply of 100 billion tokens with no new tokens being created. AAVE has a maximum supply of 16 million tokens with a deflationary model where tokens used for fees are burned.
Q4: Which token has greater institutional adoption?
A: AAVE has attracted more institutional interest and has stronger enterprise integration through its liquidity protocols. It's also included in more institutional DeFi products compared to AMP.
Q5: What are the main risk factors for each token?
A: AMP faces higher volatility due to its fixed supply and speculation. AAVE is exposed to DeFi market fluctuations and liquidity risks. Both tokens face regulatory risks, with lending protocols like AAVE facing increased scrutiny in certain markets.
Q6: How do the long-term price predictions for AMP and AAVE compare?
A: By 2030, AMP's base scenario price range is predicted to be $0.003586132055756 - $0.005050890219375, while AAVE's is $286.1544484413048 - $427.09619170344. AAVE is generally expected to have higher potential for price appreciation.
Q7: Which token might be more suitable for different types of investors?
A: For novice investors, AAVE may be more suitable due to its established position. Experienced investors might consider a balanced portfolio with both AMP and AAVE. Institutional investors may prefer AAVE due to its wider adoption and leadership in the DeFi space.
* The information is not intended to be and does not constitute financial advice or any other recommendation of any sort offered or endorsed by Gate.


