This comprehensive guide compares AT and OP as competing investment assets in the crypto market. AT (APRO Token), an AI-enhanced oracle infrastructure launched in 2025, powers RWA, AI, Prediction Markets, and DeFi ecosystems. OP (Optimism), an Ethereum Layer-2 scaling solution since 2022, offers low-cost, fast transactions. The article analyzes historical price trends, current market status, tokenomics, institutional adoption, and technical ecosystems. AT trades at $0.16059 with high volatility, while OP trades at $0.3139 with more stability. Long-term price predictions through 2031 favor OP with 115% projected growth versus AT's 34%. Investment recommendations vary by investor type: conservative investors should prioritize OP (70%) over AT (30%), while experienced investors can balance both assets. Detailed risk analysis, strategic allocation guidance, and FAQs equip readers to make informed decisions.
Introduction: Investment Comparison Between AT and OP
In the cryptocurrency market, the comparison between AT vs OP continues to be a topic that investors cannot overlook. The two not only show significant differences in market cap ranking, application scenarios, and price performance, but also represent distinct crypto asset positioning.
AT (APRO Token): Launched in 2025, it has gained market recognition with its positioning as an AI-enhanced oracle infrastructure powering ecosystems across RWA, AI, Prediction Markets, and DeFi.
OP (Optimism): Since its launch in 2022, it has been recognized as a low-cost, fast Ethereum Layer-2 blockchain solution, serving as one of the prominent scaling solutions in the Ethereum ecosystem.
This article will comprehensively analyze the investment value comparison between AT vs OP around historical price trends, supply mechanisms, institutional adoption, technical ecosystems, and future predictions, attempting to answer the question that investors care about most:
"Which is the better buy right now?"
I. Historical Price Comparison and Current Market Status
AT (APRO Token) and OP (Optimism) Historical Price Trends
- 2024: OP reached a price peak of $4.84 on March 6, 2024, driven by broader market momentum and ecosystem developments.
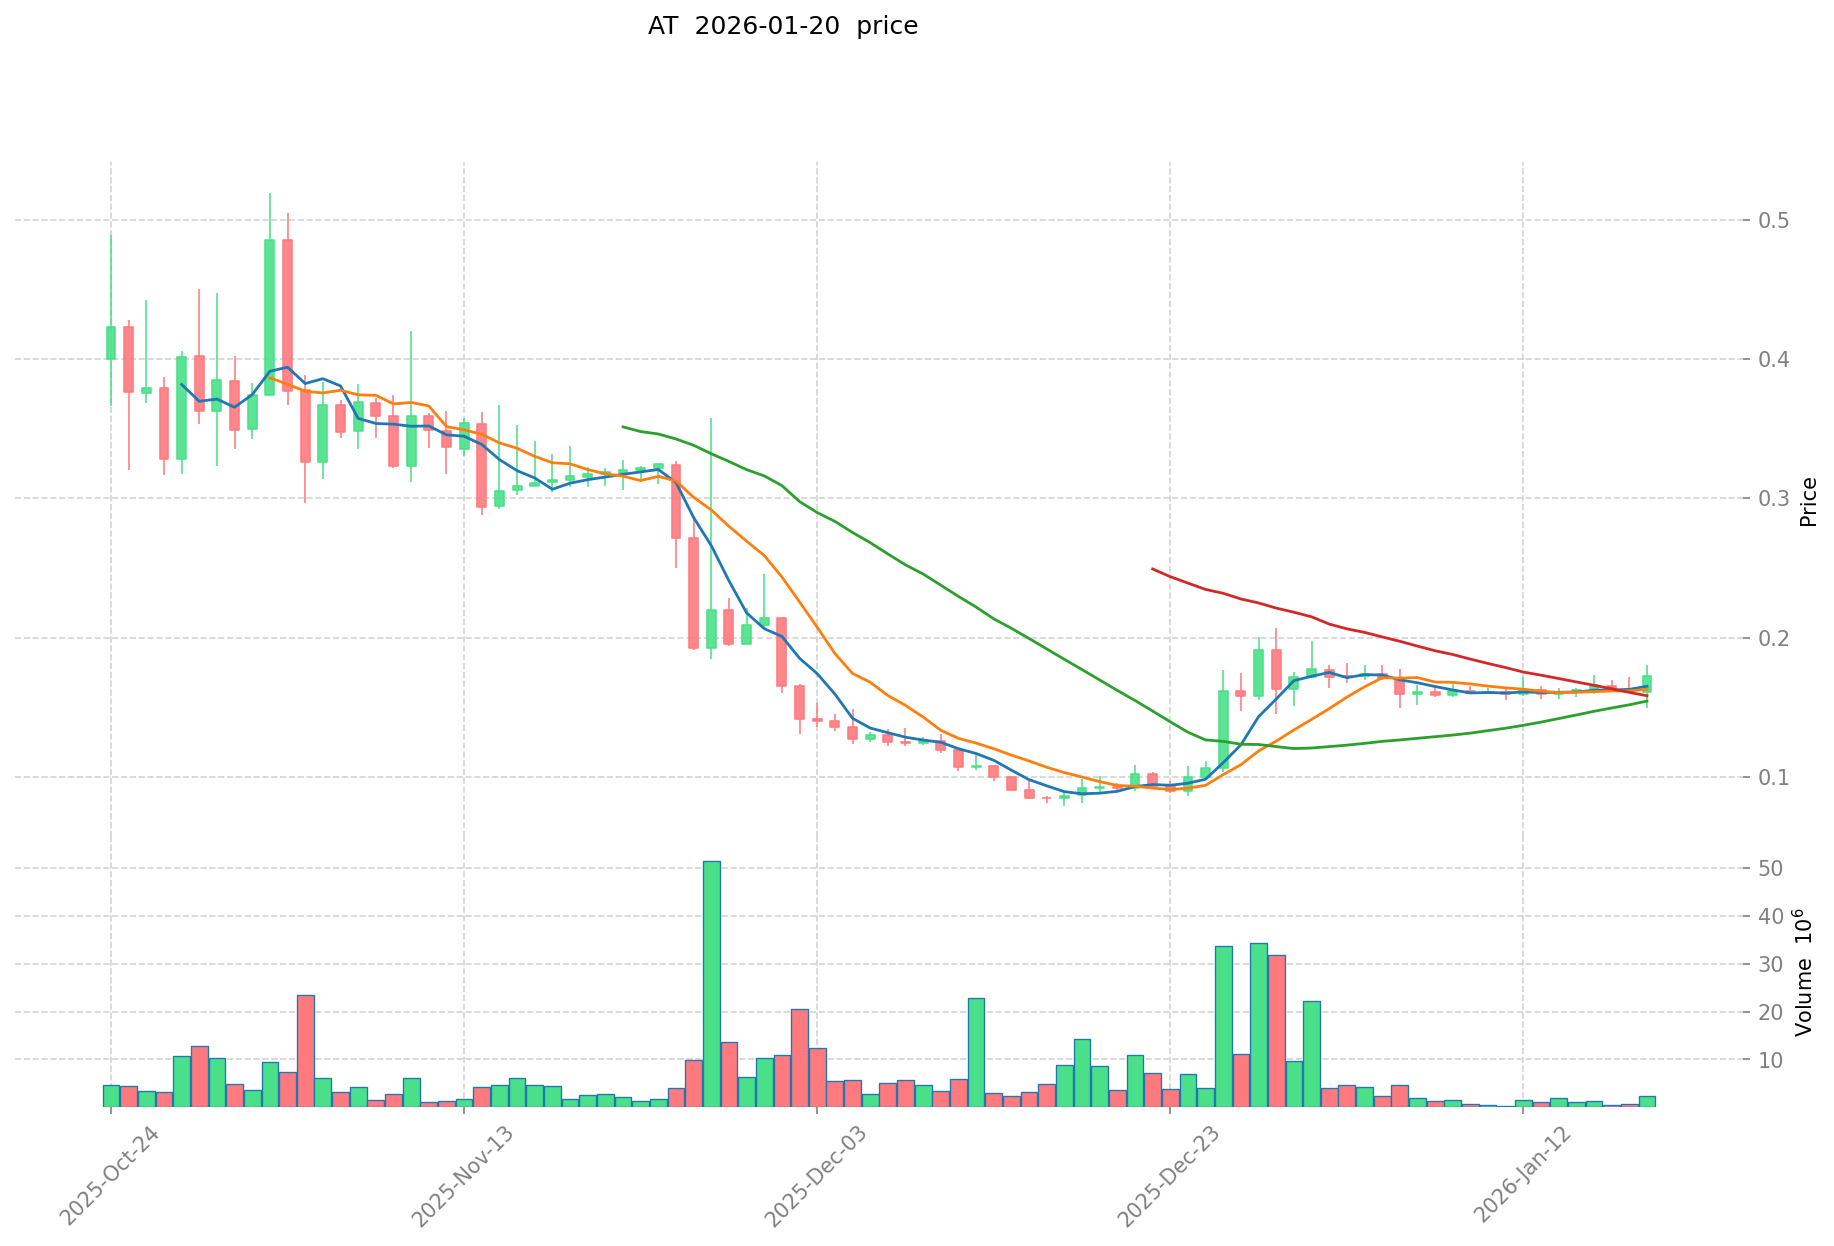
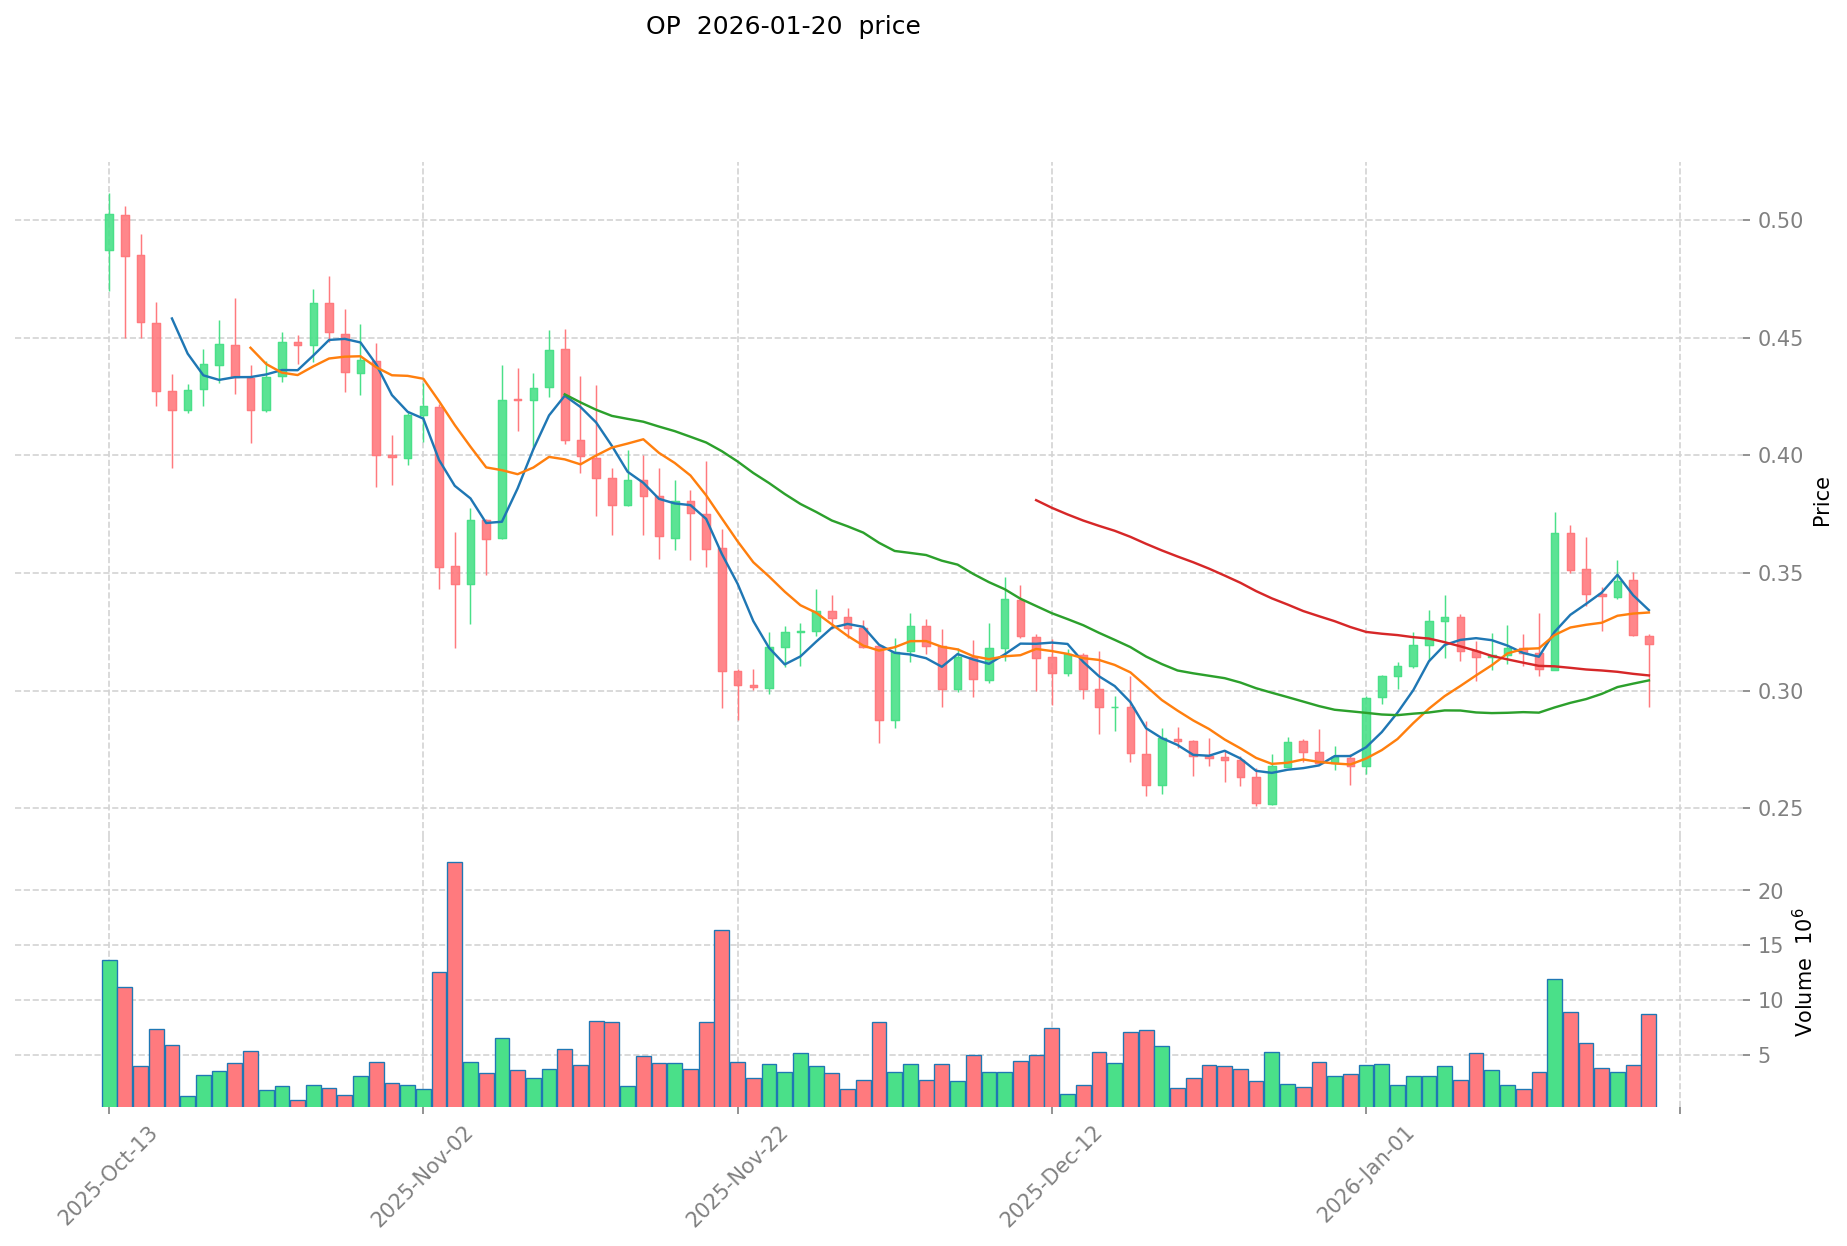
- 2025: AT experienced significant volatility, with its all-time high of $0.5196 recorded on November 2, 2025, followed by a decline to its all-time low of $0.07888 on December 17, 2025. OP also faced downward pressure, recording its all-time low of $0.251922 on December 26, 2025.
- Comparative Analysis: During the recent market cycle, AT demonstrated substantial volatility, dropping from its peak of $0.5196 to a low of $0.07888 within approximately six weeks. Meanwhile, OP experienced a more prolonged decline, falling from its 2024 high of $4.84 to $0.251922 by late 2025, reflecting broader market challenges.
Current Market Situation (January 20, 2026)
- AT Current Price: $0.16059
- OP Current Price: $0.3139
- 24-Hour Trading Volume: AT recorded $360,511.66, while OP posted $1,915,859.81
- Market Sentiment Index (Fear & Greed Index): 32 (Fear)
View real-time prices:
II. Core Factors Affecting AT vs OP Investment Value
Supply Mechanism Comparison (Tokenomics)
Due to insufficient reference materials, specific supply mechanism details for AT and OP cannot be provided at this time.
Institutional Adoption and Market Application
Institutional Holdings: Current reference materials do not provide comparative data on institutional preference between AT and OP.
Enterprise Adoption: Specific applications of AT and OP in cross-border payments, settlements, and investment portfolios are not available in the provided materials.
National Policies: Regulatory attitudes of different countries toward these two assets are not covered in the current reference materials.
Technical Development and Ecosystem Building
AT Technical Upgrades: Information regarding AT's technical development and potential impact is not available in the reference materials.
OP Technical Development: Details about OP's technical advancement and potential implications are not provided in the current materials.
Ecosystem Comparison: Comparative data on DeFi, NFT, payment solutions, and smart contract implementations for both assets are not available.
Macroeconomic Factors and Market Cycles
Performance in Inflationary Environments: Comparative analysis of anti-inflation properties between AT and OP cannot be determined from available materials.
Macroeconomic Monetary Policy: The specific impact of interest rates and the US Dollar Index on both assets is not documented in the reference materials.
Geopolitical Factors: Information regarding cross-border transaction demand and international circumstances affecting these assets is not available in the provided materials.
III. 2026-2031 Price Prediction: AT vs OP
Short-term Forecast (2026)
- AT: Conservative $0.1386-$0.1612 | Optimistic $0.1612-$0.1676
- OP: Conservative $0.2075-$0.3144 | Optimistic $0.3144-$0.3836
Mid-term Forecast (2028-2029)
- AT may enter a phase of moderate growth, with projected price range of $0.1154-$0.2123
- OP may enter a phase of accelerated expansion, with projected price range of $0.3431-$0.6860
- Key drivers: institutional capital inflows, ETF developments, ecosystem growth
Long-term Forecast (2030-2031)
- AT: Baseline scenario $0.1885-$0.1984 | Optimistic scenario $0.2344-$0.2769
- OP: Baseline scenario $0.4384-$0.5845 | Optimistic scenario $0.7540-$0.8500
View detailed price predictions for AT and OP
Disclaimer
AT:
| Year |
Predicted High Price |
Predicted Average Price |
Predicted Low Price |
Price Change |
| 2026 |
0.1676168 |
0.16117 |
0.1386062 |
0 |
| 2027 |
0.190696344 |
0.1643934 |
0.136446522 |
2 |
| 2028 |
0.19174846176 |
0.177544872 |
0.1154041668 |
10 |
| 2029 |
0.212343666912 |
0.18464666688 |
0.1458708668352 |
14 |
| 2030 |
0.23422429693728 |
0.198495166896 |
0.1885704085512 |
23 |
| 2031 |
0.276940456853299 |
0.21635973191664 |
0.190396564086643 |
34 |
OP:
| Year |
Predicted High Price |
Predicted Average Price |
Predicted Low Price |
Price Change |
| 2026 |
0.383568 |
0.3144 |
0.207504 |
1 |
| 2027 |
0.43971984 |
0.348984 |
0.18496152 |
12 |
| 2028 |
0.571810284 |
0.39435192 |
0.3430861704 |
26 |
| 2029 |
0.68597516484 |
0.483081102 |
0.40095731466 |
55 |
| 2030 |
0.7540412921118 |
0.58452813342 |
0.438396100065 |
88 |
| 2031 |
0.849991585212693 |
0.6692847127659 |
0.575584852978674 |
115 |
IV. Investment Strategy Comparison: AT vs OP
Long-term vs Short-term Investment Strategies
- AT: May appeal to investors focused on emerging AI-oracle infrastructure and early-stage ecosystem development with higher risk tolerance
- OP: May suit investors seeking exposure to established Ethereum Layer-2 scaling solutions with relatively more mature market positioning
Risk Management and Asset Allocation
- Conservative Investors: AT 30% vs OP 70%
- Aggressive Investors: AT 55% vs OP 45%
- Hedging Tools: stablecoin allocation, options strategies, cross-asset portfolio diversification
V. Potential Risk Comparison
Market Risks
- AT: Demonstrated substantial price volatility with a decline from $0.5196 to $0.07888 within approximately six weeks in 2025, reflecting higher sensitivity to market sentiment shifts
- OP: Experienced prolonged downward pressure from its 2024 peak of $4.84 to $0.251922 by late 2025, indicating exposure to broader market corrections and ecosystem competition
Technical Risks
- AT: scalability challenges, network stability considerations
- OP: dependency on Ethereum mainnet security, potential competition from alternative Layer-2 solutions
Regulatory Risks
- Global regulatory policies may impact both assets differently based on their classification, use cases, and jurisdictional adoption patterns
VI. Conclusion: Which Is the Better Buy?
📌 Investment Value Summary:
- AT Advantages: Positioning in AI-enhanced oracle infrastructure with exposure to RWA, AI, Prediction Markets, and DeFi sectors
- OP Advantages: Established presence as an Ethereum Layer-2 scaling solution with recognition in the broader blockchain ecosystem
✅ Investment Recommendations:
- Novice Investors: Consider prioritizing OP for relatively more established market presence, while limiting AT exposure to a smaller portfolio percentage
- Experienced Investors: May evaluate diversified allocation based on risk appetite, with balanced consideration of both assets' distinct positioning
- Institutional Investors: Conduct thorough due diligence on ecosystem development, technical roadmaps, and regulatory compliance before allocation decisions
⚠️ Risk Disclaimer: The cryptocurrency market exhibits high volatility. This article does not constitute investment advice.
VII. FAQ
Q1: What are the main differences between AT and OP in terms of their core functions?
AT (APRO Token) is an AI-enhanced oracle infrastructure powering ecosystems across RWA, AI, Prediction Markets, and DeFi, launched in 2025. OP (Optimism), launched in 2022, is a low-cost, fast Ethereum Layer-2 blockchain solution serving as a prominent scaling solution in the Ethereum ecosystem. AT focuses on data oracle services with AI integration across multiple emerging sectors, while OP specializes in scaling Ethereum's transaction capacity through Layer-2 technology.
Q2: How have AT and OP performed historically in terms of price volatility?
AT demonstrated extreme volatility with its all-time high of $0.5196 on November 2, 2025, followed by an 85% decline to $0.07888 within approximately six weeks. OP experienced a more prolonged decline from its 2024 peak of $4.84 (March 6, 2024) to its all-time low of $0.251922 on December 26, 2025, representing a 95% drop. AT's volatility is characterized by rapid, sharp movements within shorter timeframes, while OP exhibits extended downward pressure over a longer market cycle.
Q3: What is the price prediction outlook for AT versus OP through 2031?
For 2026, AT is projected at $0.1386-$0.1676 (conservative to optimistic), while OP ranges from $0.2075-$0.3836. By 2031, AT's predicted range extends to $0.1904-$0.2769, whereas OP is forecasted at $0.5756-$0.8500. OP demonstrates a significantly higher growth trajectory with projected price increases of 115% by 2031 compared to AT's 34%, reflecting OP's more established market position and ecosystem maturity.
Q4: How should different investor types approach portfolio allocation between AT and OP?
Conservative investors may consider a 30% AT / 70% OP allocation to limit exposure to AT's higher volatility while maintaining substantial positions in OP's more established ecosystem. Aggressive investors might opt for a 55% AT / 45% OP split to capture potential upside from AT's emerging AI-oracle infrastructure while maintaining diversification through OP's Layer-2 scaling solutions. Novice investors are recommended to prioritize OP with limited AT exposure, while institutional investors should conduct thorough due diligence on ecosystem development and regulatory compliance.
Q5: What are the primary risks associated with investing in AT compared to OP?
AT faces higher market risk due to demonstrated extreme volatility (85% decline within six weeks in 2025) and potential technical challenges related to scalability and network stability as an emerging infrastructure project. OP's risks include dependency on Ethereum mainnet security, competition from alternative Layer-2 solutions, and prolonged downward price pressure reflecting broader ecosystem challenges. Both assets face regulatory uncertainty, though classification and jurisdictional treatment may differ based on their distinct use cases and positioning.
Q6: What factors should investors monitor when evaluating AT versus OP for investment?
Investors should track institutional adoption patterns, enterprise integration developments, ecosystem growth metrics (DeFi, NFT, payment solutions), technical upgrades and roadmap execution, macroeconomic conditions (interest rates, US Dollar Index), regulatory policy changes across jurisdictions, and market sentiment indicators (Fear & Greed Index currently at 32). Additionally, monitoring 24-hour trading volumes (AT: $360,511.66 vs OP: $1,915,859.81 as of January 20, 2026) provides insights into liquidity and market participation levels.
* The information is not intended to be and does not constitute financial advice or any other recommendation of any sort offered or endorsed by Gate.